Verifying Fossil-Fuel Carbon Dioxide Emissions Forecasted by an Artificial Neural Network with the GEOS-Chem Model
WANG Yi-Nan1, 2 , L#cod#x000dc; Da-Ren1, *  , LI Qian
1 , PAN Yu-Bing1, 2
, LI Qian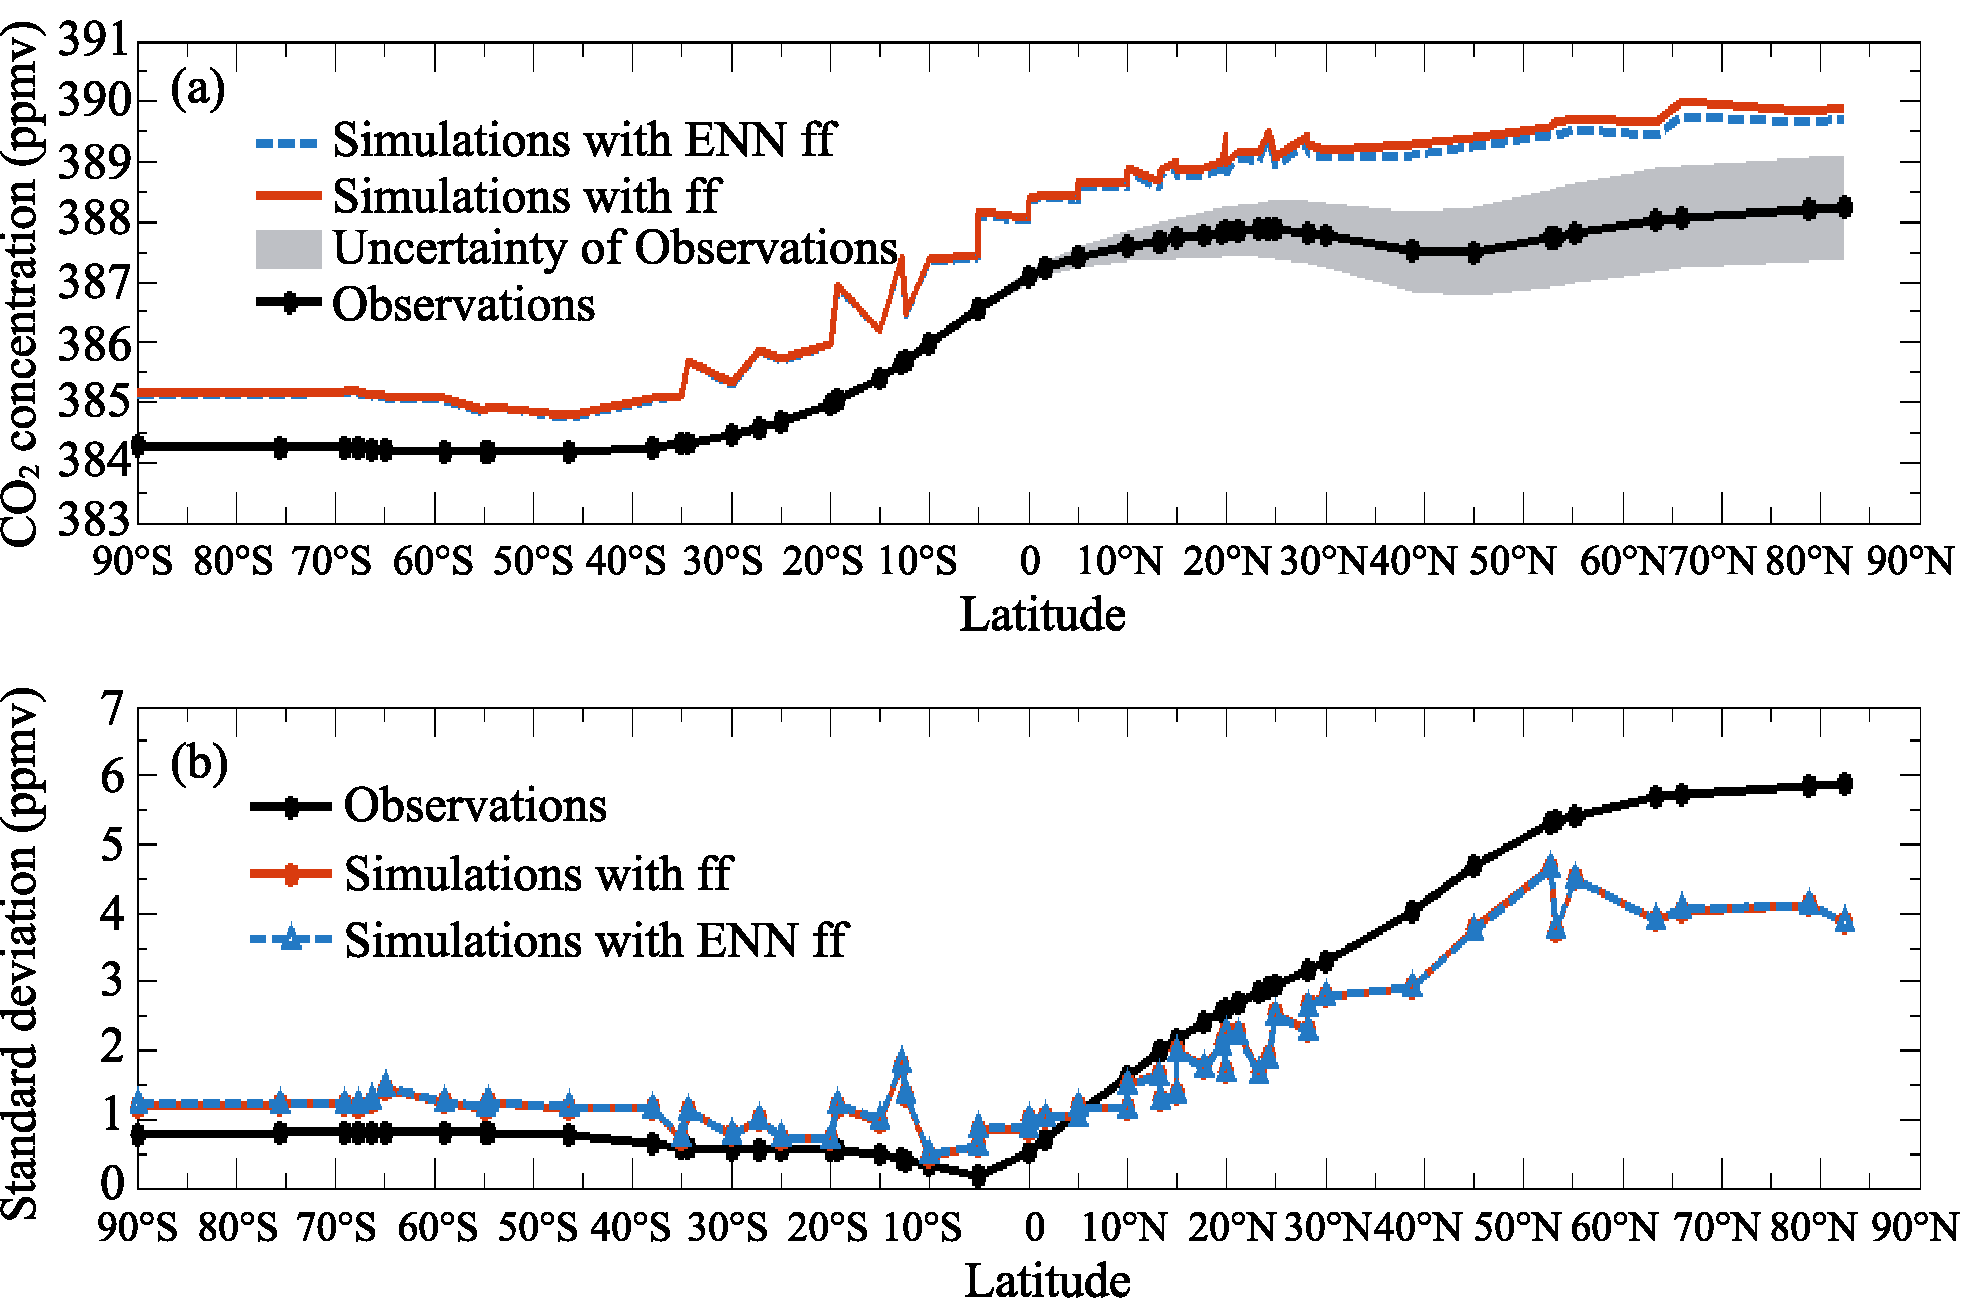
Verifying Fossil-Fuel Carbon Dioxide Emissions Forecasted by an Artificial Neural Network with the GEOS-Chem Model |
|
WANG Yi-Nan
, LI Qian |
| Figure 4 a The observed and simulated annual mean CO 2 concentrations near the surface at different latitudes during 2009. The observations are from GLOBALVIEW data products. Black dots denote the locations of the observation sites. Shading represents the standard deviations of the observations. b The standard deviation of annual average CO 2 concentrations at different latitudes in 2009. The dots red and black and triangles denote the locations of observation sites, as in a. |
| |