Sensitivity of the Terrestrial Ecosystem to Precipitation and Temperature Variability over China
[SUN Guo-Dong ]
]
]
|
|


In this study, the sensitivities of net primary production (NPP), soil carbon, and vegetation carbon to precipitation and temperature variability over China are discussed using the state-of-the-art Lund-Potsdam-Jena dynamic global vegetation model (LPJ DGVM). The impacts of the sensitivities to precipitation variability and temperature variability on NPP, soil carbon, and vegetation carbon are discussed. It is shown that increasing precipitation variability, representing the frequency of extreme precipitation events, leads to losses in NPP, soil carbon, and vegetation carbon over most of China, especially in North and Northeast China where the dominant plant functional types (i.e., those with the largest simulated areal cover) are grass and boreal needle-leaved forest. The responses of NPP, soil carbon, and vegetation carbon to decreasing precipitation variability are opposite to the responses to increasing precipitation variability. The variations in NPP, soil carbon, and vegetation carbon in response to increasing and decreasing precipitation variability show a nonlinear asymmetry. Increasing precipitation variability results in notable interannual variation of NPP. The sensitivities of NPP, soil carbon, and vegetation carbon to temperature variability, whether negative or positive, meaning frequent hot and cold days, are slight. The present study suggests, based on the LPJ model, that precipitation variability has a more severe impact than temperature variability on NPP, soil carbon, and vegetation carbon.
Climate variability exhibits distinct differences on various timescales and in different regions according to observational data ( Easterling et al., 2000; Schneider et al., 2004; Zveryaev, 2004; Gu and Adler, 2006; Parker et al., 2007; Efthymiadis et al., 2007). Changes in climate extreme events, such as floods, droughts, and heat waves, may be one of the important causes of variations in climate variability ( Liu et al., 2006; Moberg et al., 2006; Brown et al., 2008). There is also increasing evidence from climate models suggesting further variation in climate variability in the future ( Mishra and Singh, 2009).
As one of the most interesting topics in this field of research, characterizing the response of the terrestrial ecosystem to climate variability has recently begun to receive much attention. Some investigations have indicated that climate variability not only has a severe impact on ecosystem structure ( Claussen et al., 1999; Zeng and Neelin, 2000; Liu et al., 2006), but also leads to changes in soil and vegetation carbon stocks ( Tian et al., 1998; Botta and Foley, 2002). In addition, the level of uncertainty in estimating carbon flux increases as a result of the variation in precipitation variability, as demonstrated, for example, in northern mixed grass prairie ( Mitchell and Csillag, 2001). There are different views about the relationship between climate variability and terrestrial ecosystems ( Fang et al., 2001). For example, Botta and Foley (2002) demonstrated that climate variability plays an important role in the variations of ecosystem structure, soil carbon, and vegetation carbon. Mitchell and Csillag (2001) also pointed out that grassland is sensitive to climate variability.
The response of terrestrial carbon to climate variability over China has been examined previously. The interannual variation of carbon fluxes in China has been demonstrated using different vegetation models ( Cao et al., 2003; Gao and Liu, 2008). Recent estimates have shown that there are notable interannual and decadal variations in China's carbon exchange as a consequence of climate variability ( Mao et al., 2009). However, there has been little discussion about the sensitivity of the terrestrial ecosystem to changing temperature and precipitation variability over China.
In the present study, the sensitivities of net primary production (NPP), soil carbon, and vegetation carbon to temperature and precipitation variability over China are discussed by analyzing results from the state-of-the-art Lund-Potsdam-Jena dynamic global vegetation model ( LPJ DGVM; Sitch et al., 2003). We also show whether the variability in temperature or the variability in precipitation has a more important impact on the terrestrial ecosystem.
Some previous studies have demonstrated that terrestrial vegetation models are effective tools to assess the responses of terrestrial ecosystems to climate change and land use ( Gao and Yu, 1998; Friend and White, 2000; Botta and Foley, 2002). In our research, the LPJ model is used to explore the sensitivity of the terrestrial ecosystem over China to climate variability.
The LPJ model, which originates from the biome model family ( Prentice et al., 1992), is process-based model that can represent terrestrial vegetation dynamics and land- atmosphere carbon and water exchanges. The LPJ DGVM explicitly considers photosynthesis, mortality, fire disturbance, and soil heterotrophic respiration, among other processes. The distribution of plant functional types (PFTs) simulated by the LPJ model is represented reasonably well ( Sun, 2009); the carbon flux falls within an acceptable range ( Sun, 2009); and the model has been used previously to study terrestrial ecosystem dynamics ( Beer et al., 2007; Jung et al., 2007; Sitch et al., 2005). For a detailed description and evaluation of the model, see Sitch et al. (2003).
The simulation of any grid cell with the LPJ model is driven by the input of monthly climatology, including temperature, precipitation, wet day frequency, and cloud cover. The data provided by the Climate Research Unit ( CRU; Mitchell and Jones, 2005) covering the period 1901-1998 (resolution: 0.5°) are used in this study. In addition, eight soil texture classes (coarse, medium, fine, medium-coarse, fine-coarse, fine-medium, fine-medium- coarse, and organic) are used, which are also available globally on a 0.5° grid.
The LPJ model is run from 1901 to 1998 as the reference experiment using the CRU data, preceded by a 1000-year spin-up period, repeatedly using 30-year transient climate data. This achieves a state of equilibrium in terms of a preindustrial stable vegetation structure and carbon pools, which are then employed as the initial conditions for all the sensitivity experiments ( Sitch et al., 2003; Zaehle et al., 2005). To solely examine the sensitivities of NPP, soil carbon, and vegetation carbon to temperature or precipitation variability, we change the variability presented by the standard deviation without changing the mean state.
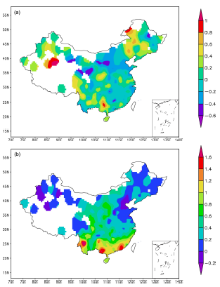
Several experiments are independently conducted to measure the impact of precipitation or temperature variability on the terrestrial ecosystem. According to the change in climate variability during 1961-2000 based on the monthly precipitation and mean surface air temperature data of 160 terrestrial stations provided by the China Meteorological Administration (Fig. 1), we perform 13 simulations with the same initial state'the reference experiment and 12 disturbance experiments. Table 1 shows the experimental design, in which the precipitation variability and temperature variability during the period of climate variability (1901-1998) are increased or decreased by 20%, 40%, and 60%.
To distinguish the difference between the sensitivities of NPP, soil carbon, and vegetation to precipitation and temperature variability in different regions over China, the whole region is divided into five approximate regions: North China (42-48°N, 107-118°E); Northeast China (42-48°N, 120-128°E); South China (22-33°N, 105- 120°E); Northwest China (35-42°N, 80-97°E); and Southwest China (27-34°N, 80-97°E).
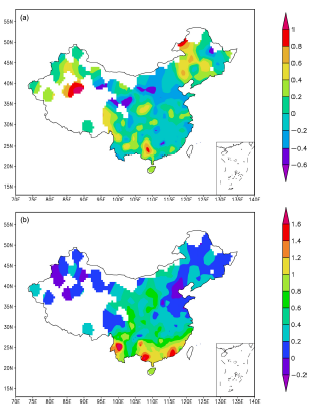 | Figure 1 The relative change of variability denoted by standard deviation between 1961-1980 and 1980-2000 using the Chinese Meteorology Administration (a) precipitation and (b) temperature. |
| Table 1 The variational scope of precipitation and temperature variability denoted by standard deviation. |
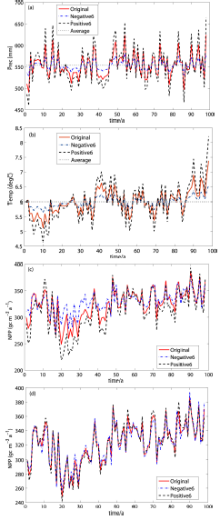
Figure 2a shows the precipitation variations due to the different experimental perturbations. The precipitation perturbation compared with the reference precipitation is positive for increasing standard deviation and is negative for decreasing standard deviation when the precipitation is larger than the mean state. However, when the precipitation is less than the mean state, the precipitation perturbation is opposite to that when the precipitation is larger than the mean state. An increase of the standard deviation in terms of precipitation means increasing wet and drought events, such as heavy precipitation events. On the contrary, decreasing precipitation variability leads to low interannual precipitation variation.
 | Figure 2 (a) Annual precipitation for the changing precipitation variability during the period 1901-1998 as the reference period; (b) annual temperature for the changing temperature variability during the period 1901-1998 as the reference period; (c) annual NPP for the changing precipitation variability during the period 1901-1998 as reference period; (d) annual NPP for the changing temperature variability during the period 1901-1998 as the reference period. |
To discuss the sensitivity of NPP to precipitation variability, we change the precipitation variability only, without changing the mean state and other input factors. The NPP in all of China shows slight variation. However, the variations in different regions are clearly distinct (Table 2). The average NPP during the experimental period decreases by 10.32-39.55 gC m-2 yr-1 (approxi-mately 2.55%-9.77%) in North China, where grassland is the dominant PFT, and by 4.68-15.31 gC m-2 yr-1(approximately 0.97%-3.16%) in Northeast China, where boreal forest is the dominant PFT, when the increase in precipitation variability rises from 20% to 60% compared to the reference state (Table 2). When the precipitation variability is reduced, the average NPP has an adverse impact compared to when it is increased. The NPP shows a large gain of 11.78-25.09 gC m-2 yr-1 in North China, and of 5.12-9.78 gC m-2 yr-1 in Northeast China, when the reduction in precipitation variability rises from 20% to 60%. The amount that NPP varies as a result of increasing the precipitation variability is greater than that induced by strengthening the decrease in precipitation variability. Therefore, these numerical results demonstrate a nonlinear asymmetry in the variation of NPP with changing precipitation variability. In the other three regions, the variation of NPP is negligible.
To analyze the cause of the variation in NPP, we also show the variation in gross primary production (GPP) and autotrophic respiration ( Ra). In the LPJ model, the difference between GPP and Ra is defined as the NPP. For the five regions, the average GPP and Ra during the exp-erimental period reduce with greater increased precipitation variability, and increase with stronger decreased precipitation variability. These numerical results suggest that increasing precipitation variability restricts photo-synthesis and autotrophic respiration, while decreasing precipitation variability accelerates these processes. The amounts of variation in GPP and Ra in North China, Northeast China, and South China are greater than those in Northwest China and Southwest China. In South China, GPP decreases by 12.20 gC m-2 yr-1 and Ra decreases by 14.90 gC m-2 yr-1, meaning NPP has a slight loss when precipitation variability increases by 60%. In North and Northeast China, the fact that the decrease in the amount of GPP is greater than that of Ra causes the serious loss in NPP. This result is analogous to that reported by Cao et al. (2003).
The sensitivity of NPP variability to precipitation variability is also analyzed. Figure 3b shows that the NPP variability changes little in Northwest China, Southwest China, and South China with increasing precipitation variability, while there is a marked change in North and Northeast China. These results demonstrate that NPP in North and Northeast China is sensitive to precipitation variability. The annual variation of NPP increases with increasing precipitation variability, and decreases with decreasing precipitation variability (Figs. 2c and 3b). The simulation indicates that the growth of grass and boreal forest are highly dependent on water supply in North and Northeast China ( Gao et al., 2000).
| Table 2 The variation in net primary production (NPP), gross primary production (GPP), Ra, soil carbon (SoilC), and vegetation carbon (VegeC) for the different regions in China due to different precipitation variability. The reference experiment is for no impact of variation of precipitation variability on the terrestrial ecosystem. PV-60% means that the precipitation variability decreases by 60%. PV+60% means that the precipitation variability increases by 60%. |
There is marked variation in soil carbon not only in North China and Northeast China, but also in South China with changing precipitation variability (Table 2). Soil carbon consists of three components: below-ground litter, the short-term carbon pool, and the long-term carbon pool. The below-ground litter and long-term carbon pool components are insensitive to changing precipitation variability; however, the decomposition of litter responds rapidly to changing soil moisture caused by precipitation variability. In addition, the variation in soil carbon shows a nonlinear asymmetry. In North China, the soil carbon increases by 1.78% to 3.04% when the decrease in precipitation variability rises from 20% to 60%, and decreases by 0.72% to 3.17% when the increase in precipitation variability rises from 20% to 60%. The situation is similar in Northeast China. However, in South China, soil carbon decreases by 9.55-21.53 gC m-2 yr-1 when the decrease in precipitation variability rises from 20% to 60%, and increases by 19.32-54.98 gC m-2 yr-1 when the increase in precipitation variability rises from 20% to 60%.
The vegetation carbon is restrained with increasing precipitation variability in the whole region (Table 2). When the increase in precipitation variability rises from 20% to 60%, the vegetation carbon decreases by 8.08% to 25.25%, by 2.68% to 10.07%, and by 0.44% to 0.94% in North China, Northeast China, and South China, respectively. When the decrease in precipitation varia-bility rises from 20% to 60%, the vegetation carbon gradually increases. The variation of vegetation carbon originates from leaf, sapwood, heartwood, and root variations. Because the variation of soil moisture is responsive to changing precipitation variability, the variations of sapwood, heartwood, and root are noticeable. It is clear that nonlinear asymmetries exist in the soil and vegetation carbon.
There is a similar variation in temperature perturbation with that in precipitation perturbation when the temperature variability changes (Fig. 2b). The perturbation causes high temperatures when the temperature is greater than the mean state, and causes low temperatures when the temperature is less than the mean state when the temperature variability rises. This means that hot and cold extreme events become more frequent.
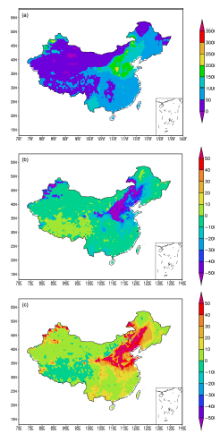
 | Figure 3 (a) Simulated NPP variability during the period 1901-1998 (units: mm); (b) the difference between NPP variability for decreasing precipitation variability (PV-60%) and the NPP variability for the reference state; (c) the difference between NPP variability for increasing precipitation variability (PV+60%) and the NPP variability for the reference state. |
In terms of the variation in soil carbon, vegetation carbon, and NPP, there is little sensitivity to the hot and cold events in the whole region; for example, the different impacts of temperature variability and precipitation variability on soil carbon in Northeast China. The relative change of soil carbon is 3.17% when the precipitation variability increases by 60%. However, the relative change of soil carbon is 0.09% when the temperature variability increases by 60%. The soil carbon consists of three components: below-ground litter, the short-term carbon pool, and the long-term carbon pool. The effects of precipitation and temperature on the below-ground litter and long-term carbon pool components are similar. However, the change of precipitation variability accelerates the decomposition of litter into soil carbon for the short-term carbon pool component due to the rapid response of soil moisture to precipitation. The soil temperature responds slowly to temperature variability. The decomposition of litter into soil carbon is also slow. From the results, we find that NPP, soil carbon, and vegetation carbon are more sensitive to precipitation variability than temperature variability.
In this study, the sensitivities of NPP, soil carbon, and vegetation carbon to precipitation and temperature vari-ability have been discussed. Within the LPJ DGVM, the numerical results show that precipitation variability plays an active role in vegetation dynamics over China. In-creasing precipitation variability restrains NPP, GPP, Ra,soil carbon, and vegetation carbon, especially in North China where the dominant PFT is grassland and in Northeast China where the dominant PFT is boreal forest. Decreasing precipitation variability has the opposite effect on the terrestrial ecosystem. The results also show that there is a nonlinear asymmetry with the changing pre-cipita-tion variability. The variational amounts in carbon flux induced by increasing precipitation variability are greater than those caused by decreasing precipitation variability. However, the response of the terrestrial eco-system to temperature variability is slight. These results indicate that the interannual precipitation variability may be a crucial factor influencing the terrestrial ecosystem in North and Northeast China, where precipitation is scarce (Cao et al., 2003). These results also confirm that terres-trial ecosystems may be quite sensitive to precipitation perturbations ( Lotsch et al., 2003).
The numerical results show that the interannual NPP rises with an increase in precipitation variability. This means that when there are more flood or drought events, the NPP has a severe response. However, despite the precipitation and temperature variability, the dominant PFTs remain the same in China.
In this study, the variation in climate variability is linear. However, climate change is nonlinear, so it is neces- sary to discuss the sensitivity of the terrestrial ecosystem to nonlinear climate change by employing a nonlinear approach. The LPJ model, in which the feedback to changing climate is not considered, is an offline model. It is therefore reasonable to discuss the terrestrial ecosystem through coupling the LPJ DGVM into general circulation models. However, this research is only the initial step for discussing the variation in the terrestrial ecosystem in China. One of the next steps will be to introduce nonlinear variation into the terrestrial ecosystem using a nonlinear method, such as the conditional nonlinear optimal perturbation (CNOP) approach ( Mu et al., 2003).
Acknowledgments. The authors thank the reviewers for their valuable suggestions. Funding was provided by grants from the National Basic Research Program of China (Grant No. 2012CB955202), the National Natural Science Foundation of China (Grant No. 41375111), the LASG Free Exploration Fund, and the LASG State Key Laboratory Special Fund.
| 1 |
|
| 2 |
|
| 3 |
|
| 4 |
|
| 5 |
|
| 6 |
|
| 7 |
|
| 8 |
|
| 9 |
|
| 10 |
|
| 11 |
|
| 12 |
|
| 13 |
|
| 14 |
|
| 15 |
|
| 16 |
|
| 17 |
|
| 18 |
|
| 19 |
|
| 20 |
|
| 21 |
|
| 22 |
|
| 23 |
|
| 24 |
|
| 25 |
|
| 26 |
|
| 27 |
|
| 28 |
|
| 29 |
|
| 30 |
|
| 31 |
|
| 32 |
|
| 33 |
|
| 34 |
|