
Statistical Downscaling of FGOALS-s2 Projected Precipitation in Eastern China
[DAI Yi-Feng1, 2, 3 , LIU Yi-Min1, *  , JIN Ji-Ming
4 ]
, JIN Ji-Ming|
|


A statistical regression downscaling method was used to project future changes in precipitation over eastern China based on Phase 5 of the Coupled Model Intercomparison Project (CMIP5) the Representative Concentration Pathway (RCP) scenarios simulated by the second spectral version of the Flexible Global Ocean- Atmosphere-Land System (FGOALS-s2) model. Our val-idation results show that the downscaled time series agree well with the present observed precipitation in terms of both the annual mean and the seasonal cycle. The regression models built from the historical data are then used to generate future projections. The results show that the enhanced land-sea thermal contrast strengthens both the subtropical anticyclone over the western Pacific and the east Asian summer monsoon flow under both RCPs. However, the trend of precipitation in response to warming over the 21st century are different across eastern China under different RCPs. The area to the north of 32°N is likely to experience an increase in annual mean precipitation, while for the area between 23°N and 32°N mean precipitation is projected to decrease slightly over this century under RCP8.5. The change difference between scenarios mainly exists in the middle and late century. The land-sea thermal contrast and the associated east Asian summer monsoon flow are stronger, such that precipitation increases more, at higher latitudes under RCP8.5 compared to under RCP4.5. For the region south of 32°N, rainfall is projected to increase slightly under RCP4.5 but decrease under RCP8.5 in the late century. At the high resolution of 5 km, our statistically downscaled results for projected precipitation can be used to force hydrological models to project hydrological processes, which will be of great benefit to regional water planning and management.
A wide variety of general circulation models (GCMs) have been used for future projections of climate change under different scenarios. Recently, a new set of coordinated climate model experiments, Phase 5 of the Coupled Model Intercomparison Project (CMIP5), have been released ( Taylor et al., 2012), and several researchers have used these model outputs to analyze precipitation changes in China under the Representative Concentration Pathway (RCP) scenarios ( Xu and Xu, 2012; Chen and Sun, 2013). However, for assessing the hydrological impacts of climate change at regional scales, the CMIP5 models are still at a coarse horizontal resolution and cannot be used directly due to the mismatch in the spatial resolution. There have been attempts at using regional climate models for climate change projections, which can simulate some significantly different regional-scale patterns of change when compared to their driving GCMs ( Gao et al., 2008; Zou and Zhou, 2013), which is known as dynamical downscaling. However, the regional pattern will be dependent on the model performance.
Compared to dynamical downscaling, statistical down-scaling has the advantage of being computationally efficient in producing high-resolution climatic variables from GCM outputs ( Wilks, 2010; Fan et al., 2013). Statistical downscaling assumes that a stationary statistical relationship remains unchanged from present to future climate. Such an assumption could possibly result in uncertainties in future projections in nonlinear climate systems. But, the uncertainty could be largely reduced by using all possible greenhouse gas emission scenarios ( von Storch et al., 1993).
In this study, we provide precipitation projections in eastern China under CMIP5 scenarios using statistical downscaling methods. In section 2, we describe the datasets and model simulations, followed by an explanation of the statistical downscaling method in section 3. In section 4, we show the validation of the present day climate simulations. In section 5, we present the percentage change of the statistically downscaled annual mean precipitation relative to the present climate under different RCPs over the whole of eastern China with a resolution of 5 km. In section 6, we summarize our results and discuss the limitations of our statistical downscaling approaches.
The historically observed precipitation data used in this study come from a long-term gridded station dataset from 1971 to 2005, which has a 0.05° longitudinal and latitudinal resolution ( Hu et al., 2008). The global climate system model output used in this study was generated with the second spectral version of the Flexible Global Ocean- Atmosphere-Land System (FGOALS-s2) model developed by the State Key Laboratory of Numerical Modeling for Atmospheric Sciences and Geophysical Fluid Dynamics (LASG), the Institute of Atmospheric Physics (IAP), which has participated in the CMIP5 experiments. The atmospheric component is the Spectral Atmospheric Model of LASG/IAP Version 2 (SAMIL2), whose horizontal resolution is 2.81° longitude × 1.66° latitude, with 26 hybrid vertical layers. The oceanic component is the LASG/IAP Climate Ocean Model Version 2 (LICOM2), and its resolution is 1°×1°. The other components, includ-ing the land surface, ice, and coupler components, are from the National Center for Atmospheric Research (NCAR) Community Climate System Model (CCSM3). A more detailed introduction of the FGOALS-s2 model is included in Bao et al. (2013).
In order to investigate the projected changes of precipitation in eastern China, the results from three groups of the CMIP5 coordinated experiments with three individual ensembles each have been taken, including the historical simulations, the RCP4.5 (intermediate emission scenario) and RCP8.5 (high emission scenario) future projections. The labels for the RCPs provide a rough estimate of the radiative forcing in the year 2100. The historical simulations have been integrated from 1850 to 2005, and the last 35 years (1971-2005) of data are used in this study due to the limitation of observations.
Statistical downscaling through regression is a very common method that has been developed by numerous researchers to make the connections between global-scale climate simulations and local-scale studies ( Wigley et al., 1990; Huth, 1999). To ensure the dynamical consistency between historical data and future simulation, we use the statistical downscaling method presented by Dettinger et al. (2004) to downscale precipitation in eastern China. The procedure involves first sorting both the historical observed and simulated precipitation for each month of the year; then, if there are fewer occasions without precipitation in the simulation than observation, we separate wet from dry occasions by identifying a threshold value in the simulations that describes the onset of precipitation in the observations. The threshold value will be above zero to ensure that there are exactly the same number of wet occasions in the observation and simulation. Afterwards, the sorted, remaining observed precipitation values are functionally related to the corresponding simulated values by developing a regression relationship between them. Instead of precipitation itself, the square roots of precipitation are regressed to render them approximately Gaussian ( Wilson, 1997), and except for April and October we use a third-order polynomial equation, as the precipitation change is comparatively small, and fifth-order polynomial equations are fitted for all the other months in order to reduce the possible extreme values achieved in the future simulations.
Can the statistical downscaling method we use be regarded as a plausible approach to provide useful precipitation projections? To answer this question, we first validate the downscaled precipitation with observations of the present climate. The data for the period 1981 through 2005 are used to train the regression model, while the data for the period 1971 through 1980 are used for validation.
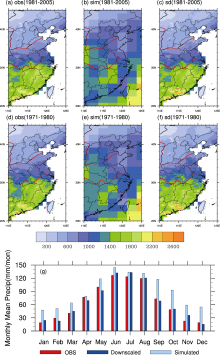
The annual mean precipitation over the eastern China domain is similar in both spatial distribution and magnitude in the period 1971-80 (Fig. 1d) and 1981-2005 (Fig. 1a). It is characterized by maxima over southeastern China and a decrease towards the north, with the 1000-mm isoline located slightly north of the Yangtze River. The spatial pattern correlation between the two periods is greater than 0.99, showing that there are generally few changes for annual precipitation. Compared with the observation (Figs. 1a and 1d), the precipitation center simulated by FGOALS-s2 (Figs. 1b and 1e) is located too far north over southeastern China, which is a very common deviation in GCM simulations of East Asia due to their coarse horizontal resolution ( Gao et al., 2006). It turns out that the spatial pattern correlation between the simulation and observation for the validation period 1971-80 in eastern China (Figs. 1d and 1e) is only 0.03. Here, we use a regression method introduced before to build the relationship between the monthly historical output and monthly observations. We can see that a very close agreement between the observed (Fig. 1d) and downscaled simulated (Fig. 1f) annual mean precipitation is evident, with a spatial pattern correlation greater than 0.98, which represents a remarkable improvement. Moreover, as shown in the seasonal variation (Fig. 1g), although the original simulation presents a good seasonal cycle, downscaled monthly precipitation is much closer, quantitatively, to the observation than the original simulation. The downscaling method significantly reduces the bias in the original simulations, especially for the fall and winter seasons, while the original simulations almost double the observation values, indicating that this method has strong ability in realistically reproducing the observed precipitation.
In statistical downscaling studies, there are common assumptions ( Wilby et al., 1998) that stable empirical relationships can be established between atmospheric processes occurring at disparate temporal or spatial scales, and these relationships will necessarily be transferable. Therefore, the future-climate simulations are transformed using the same regression relations as developed for the historical period. Future projections are then averaged for three time periods (2010-39, 2040-69, and 2070-99) to produce early, middle, and late century projections of precipitation in eastern China, respectively.
 | Figure 1 Spatial distribution of annual mean precipitation in eastern China (20-45°N, 110-125°E) (units: mm yr-1): (a) historical gridded station observations from 1981 to 2005; (b) FGOALS-s2 historical simulation from 1981 to 2005; (c) statistically downscaled model results from 1981 to 2005; (d-f) the same as (a-c) but for the period 1971-80; (g) seasonal variation of observed, original the second spectral version of the Flexible Global Ocean-Atmosphere-Land System (FGOALS-s2) simulated, and statistically downscaled eastern China mean precipitation (1971-80). |
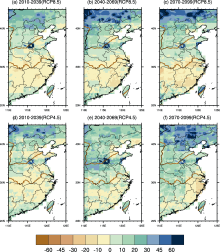
Figure 2 presents the average percentage changes of statistically downscaled annual mean precipitation in eastern China for the early, middle, and late periods under the different RCP scenarios relative to 1976-2005. Projected changes in regional precipitation in response to warming over the 21st century are not uniform. The precipitation changes during the early and middle century show similar spatial patterns to those towards the end of the century under one RCP scenario, but with smaller magnitude. The area situated to the north of 32°N is likely to experience an increase over the next few decades towards the end of the 21st century under RCP8.5. For some regions north of latitude 42°N, this increase shows a possible tendency as high as 60% in the middle and late century. In most areas between 23°N and 32°N, mean precipitation is projected to decrease slightly over the century under RCP8.5.
 | Figure 2 Average percentage change in statistically downscaled annual mean precipitation (units: %) under RCP8.5 for (a) 2010-39, (b) 2040-69, and (c) 2070-99; and under RCP4.5 for (d) 2010-39, (e) 2040-69, and (f) 2070-99 relative to 1976-2005. |
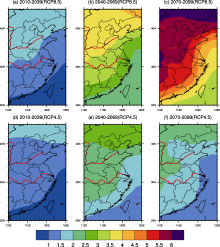
To understand the projected precipitation changes, we show the surface temperature ( Ts) change in Fig. 3. The Ts increases globally in the 21st century under both RCPs, but the warming is also not uniform. The patterns in winter and summer (not shown) are similar to the annual one. The warming is stronger in the mid-high latitudes than in the tropics, and stronger over continental Asia than the western Pacific under both scenarios. Compared to the current climate, the Ts change presents stronger land-sea thermal contrast in summer, but a weaker one in winter in eastern Asia. This change agrees with the summer projections in CMIP3 and CMIP5 multi-model results ( Li et al., 2012; Wang et al., 2013). Meanwhile, the temperature gradient is largest in the late century (Figs. 3c and 3f), indicating the strongest land-sea thermal contrast. As a result, southeasterly flow is enhanced and is the strongest in the late century (refer to the moisture flux in Fig. 4). In Asia, the summer monsoon precipitation dominates the annual rainfall amount. Thus, the annual patterns presented in this paper mainly illustrate summertime information.
Atmospheric water vapor transport plays an important role in the variability of precipitation in the Asian monsoon ( Wei et al., 2005 , Zhou and Yu, 2005). We calculate the change of the vertically integrated water vapor flux and its divergence (div Q) (Fig. 4). Since both original (not shown) and downscaled FGOALS-s2 data estimate a similar change in precipitation spatial pattern, for simplicity we use the original FGOALS-s2 wind and specific humidity data for the water vapor flux calculation.
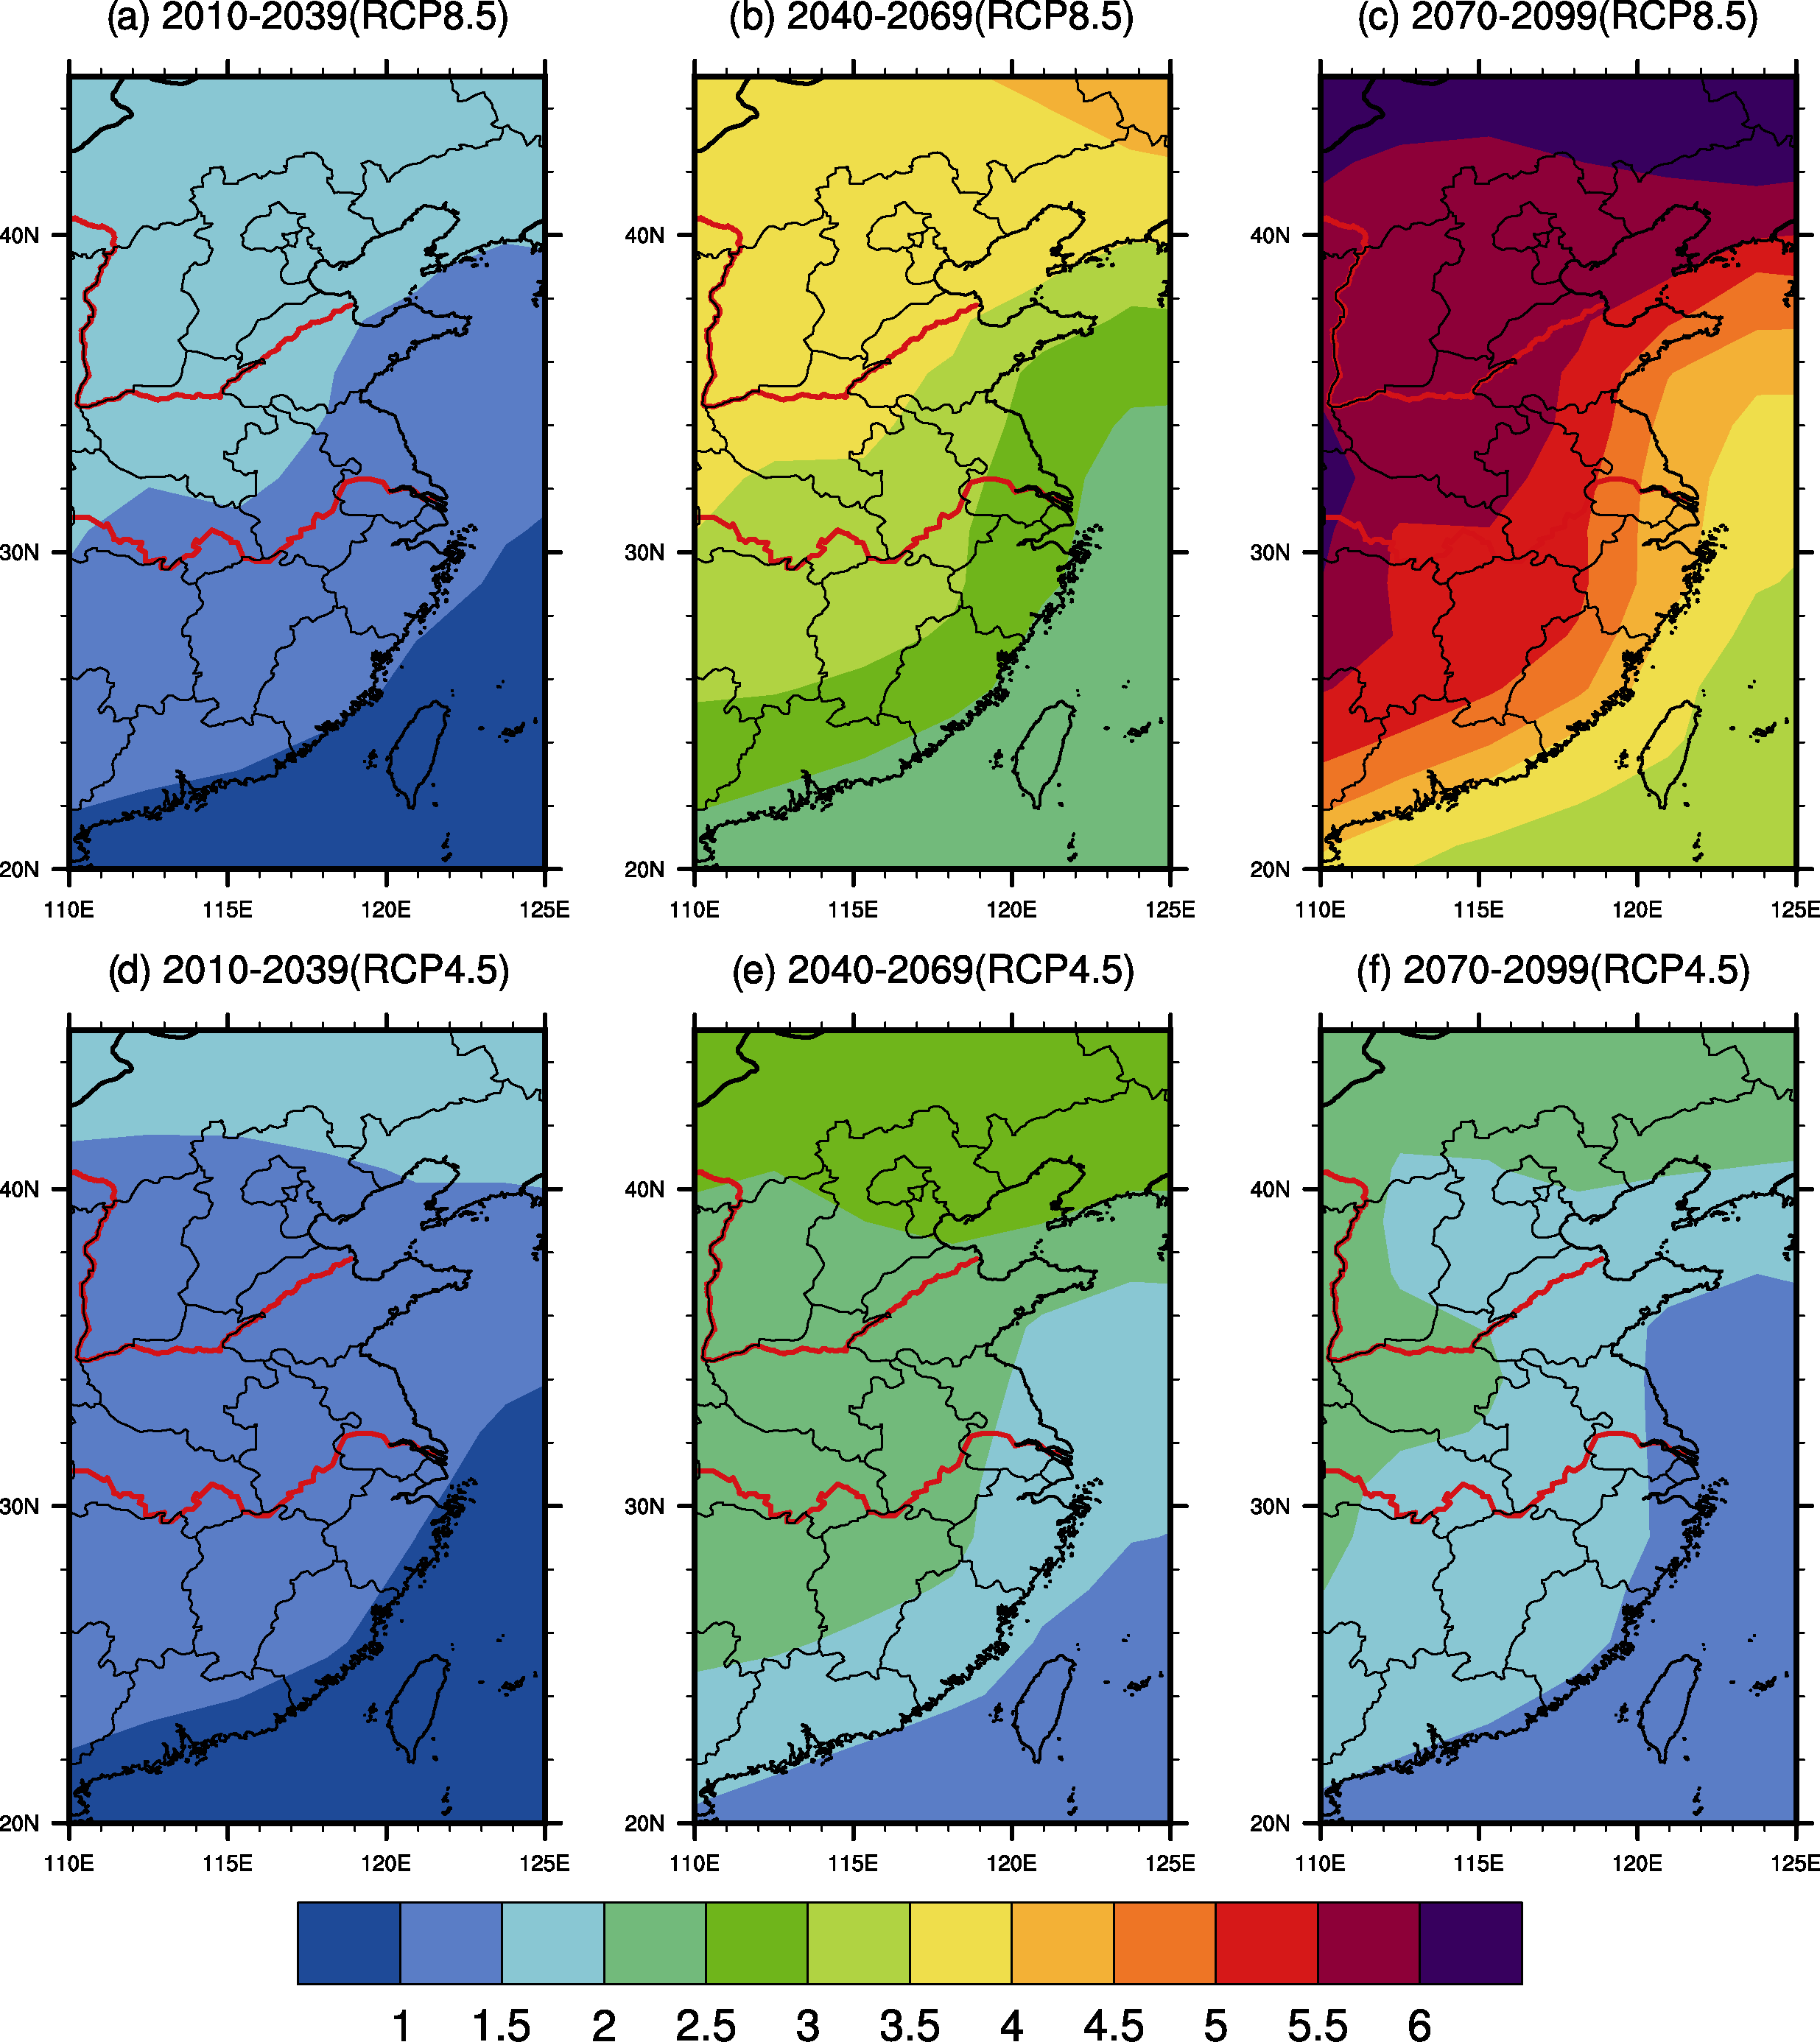
Under the RCP8.5 scenario, because the Ts meridional gradient at high latitudes is larger (Fig. 3c) in the late century than in the earlier period (Figs. 3a and 3b), the westerly anomalies are stronger (Fig. 4c). Meanwhile, the southwesterly flow changes in the lower latitudes are increased due to the simultaneous Ts zonal gradient increase. Thus, a negative divergence (div Q) can be found in the area north of latitude 35°N, with a minimum value of less than -1.2×10⁻⁵ kg m-2 s-1, indicating a convergence of water vapor in this area. This causes a precipitation increase from the early century towards the late century. In contrast, there is an anomalous positive div Q in most of the areas situated south of 35°N (Figs. 4a-c), indicating an anomalous divergence of water vapor in this area, which is consistent with the decrease of precipitation over the century (Figs. 2a-c).
 | Figure 3 The anomalies of FGOALS-s2 simulated surface air temperature ( Ts) (units: °C) under RCP8.5 for (a) 2010-39, (b) 2040-69, and (c) 2070-99; and under RCP4.5 for (d) 2010-39, (e) 2040-69, and (f) 2070-99 relative to 1976-2005. |
Most of these findings are consistent with the Intergovernmental Panel on Climate Change Fifth Assessment Report's (IPCC AR5) estimation of the projected changes in the water cycle with multiple GCM ensembles ( IPCC, 2013). The ensemble demonstrates that the "warm land-cool ocean'' is conducive to a complete Asian monsoon precipitation increase and a strong Asian summer monsoon by generation of an east-west asymmetry ( Wang et al., 2012). However, instead of a slight decrease (5%-15%), a likely increase (0%-10%) of mean precipitation is estimated in the IPCC AR5 report by the end of this century under the RCP8.5 scenario for southeastern China. However, IPCC AR5 also indicates that less than 90% of models agree on the sign of change in this region. In fact, the projected change for this region remains controversial because, for example, some regional models simulate a pronounced reduction of precipitation (10%-25%) over south of the Yangtze River in their long-term projections ( Gao et al., 2008; Zou and Zhou, 2013).
The rainfall projection difference between the high emission scenario and moderate emission scenario mainly exists in the middle and late century periods (Figs. 2-4). Again, we find that the warming is heavier under RCP8.5 than under RCP4.5 in the same period, and the warming reaches a maximum in the late century, as expected (Fig. 3). Since the moisture amount is large in the lower troposphere, generally the wind change in the lower troposphere is consistent with that of the moisture flux.
The change in Ts horizontal gradient is greater under the high emission scenario, indicating a stronger land-sea thermal contrast in summer (Figs. 3b and 3e, and Figs. 3c and 3f). Thus, the increase in the westerlies and southwesterlies are more pronounced in eastern Asia in the lower troposphere under RCP8.5 than under RCP4.5 (Figs. 4b and 4e, and Figs. 4c and 4f). The subtropical anticyclone anomaly over the western Pacific and stronger moisture fluxes occur in the higher latitudes (Figs. 4b and 4e, and Figs. 4c and 4f). As a result, the east Asian summer monsoon is stronger and precipitation increases more at latitudes to the north of 42°N (Figs. 2b and 2e, and Figs. 2c and 2f), from Mongolia to northeast China under RCP8.5. Correspondingly, for the region south of 32°N as a whole, mean precipitation is projected to increase slightly by 0.7% under RCP4.5, but decrease by 4.4% under RCP8.5 in the late century.
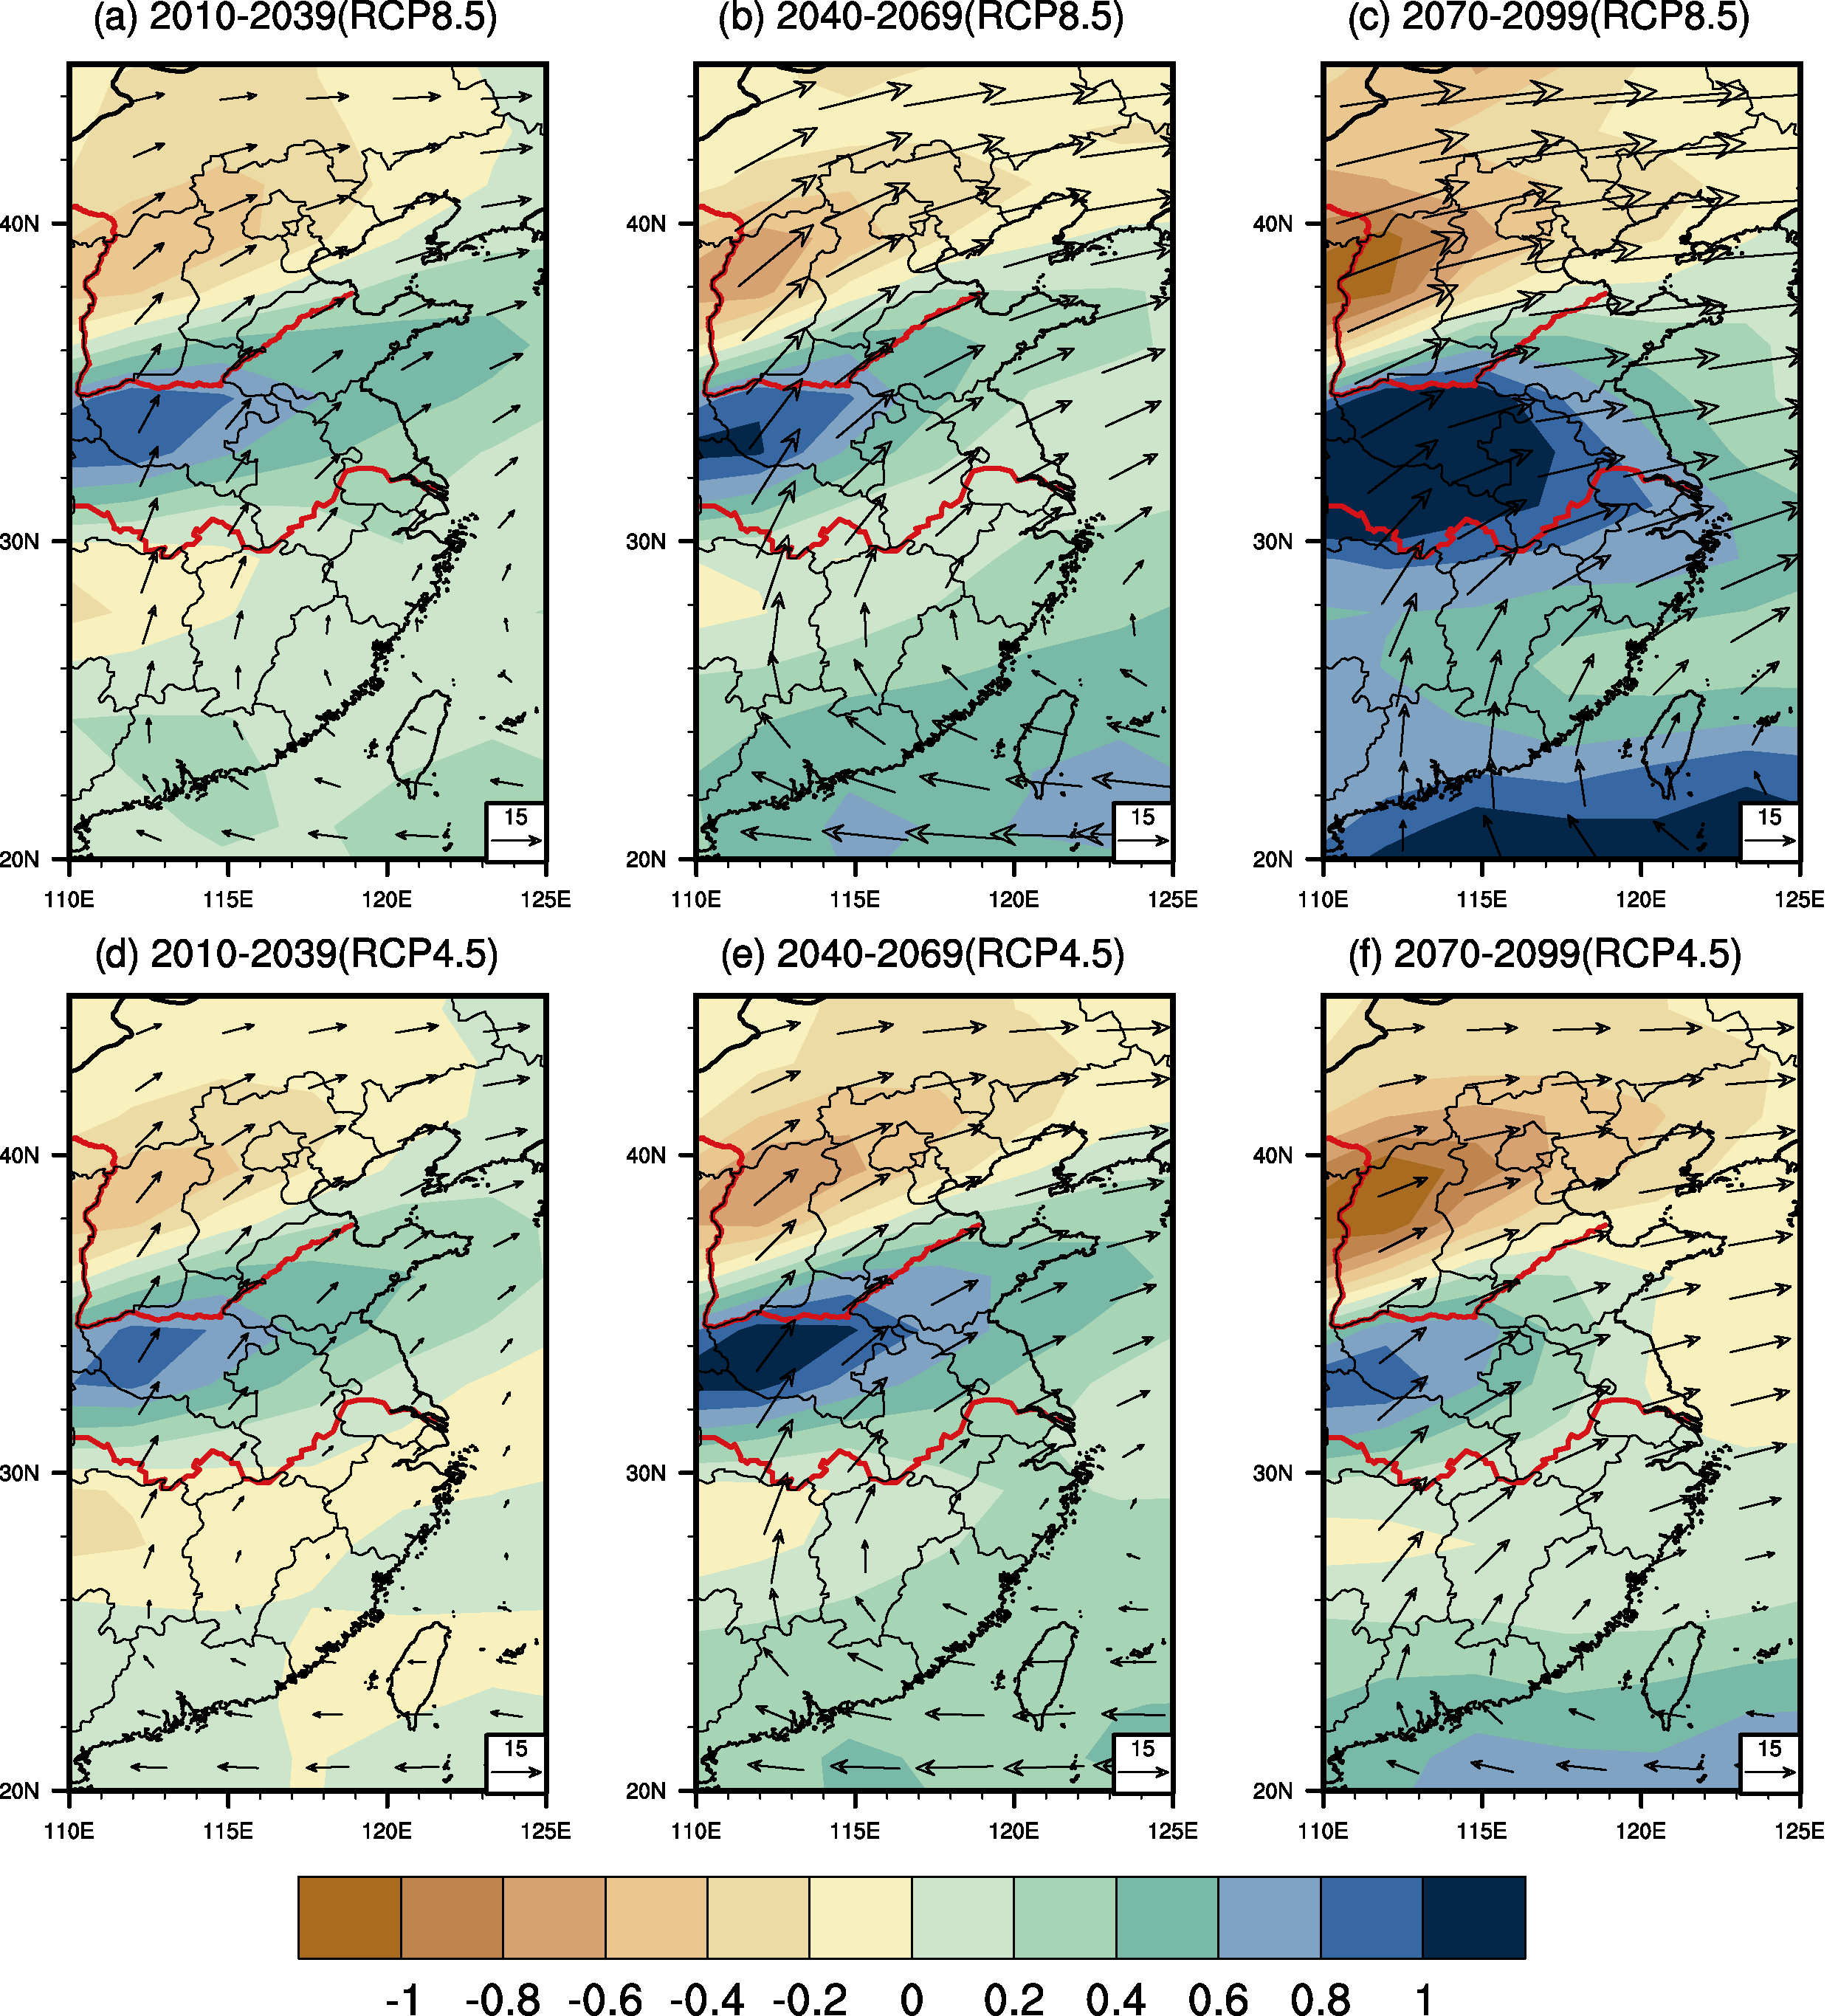 | Figure 4 The anomalies of FGOALS-s2 simulated vertically integrated (1000-300 hPa) water vapor flux (arrows; units: kg m-1 s-1) and div Q (water vapor divergence) (shading; units: 10-5kg m-2 s-1) under RCP8.5 for (a) 2010-39, (b) 2040-69, and (c) 2070-99; and under RCP4.5 for (d) 2010-39, (e) 2040-69, and (f) 2070-99 relative to 1976-2005. |
In general, compared with the IPCC AR5 report, which gives a general estimation of changes in the global water cycle, our statistically downscaled results regarding changes in the projected annual mean precipitation are consistent with those results, and also have the advantage of being at high resolution and capable of application in regional and site-specific hydrological studies.
Downscaled FGOALS-s2 simulations of present-day and future precipitation are presented in this paper. Our findings indicate that the eastern China region will not experience uniform precipitation changes over the remainder of the century. Changes in precipitation during the early and middle century show similar spatial patterns to those towards the end of the century under one RCP scenario, but with smaller magnitude. The northern part of the region (north of 32°N) is likely to experience an increase in annual mean precipitation, with the strongest increase possibly being as high as 60% in the regions north of 42°N in the middle and late century under RCP8.5, while for the southern part of the region (23-32°N), mean precipitation is projected to decrease slightly over this century under RCP8.5.
The future changes based on statistically downscaled data under the high and moderate emissions scenarios are different, mainly in the middle and late periods of the century. As the land-sea thermal contrast intensifies in summer and the east Asian monsoon flow strengthens, precipitation increases more in the higher latitudes under RCP8.5 than under RCP4.5 in the area north of 42°N. Meanwhile, for the region south of 32°N in eastern China, mean precipitation is projected to increase slightly under RCP4.5 but decrease under RCP8.5 in the late century. Although a contentious estimation on the sign of precipitation change exists in the south part of eastern China compared with the IPCC AR5 report, our statistically downscaled results regarding changes in projected precipitation are consistent to some regional model results and stand out for their ability to be adjusted for small-scale hydrological studies due to the high resolution.
It is important to note that it is impossible to make definitive climate predictions for decades ahead because the future climate is strongly influenced by inherently uncertain factors. Precipitation downscaling in particular is very challenging and is more prone to uncertainty issues than other climatological variables. However, climate projections can be made with uncertainty considered. The uncertainty in the future evolution of greenhouse gas emissions is addressed by considering different RCP scenarios. Statistical downscaling is another way to reduce the uncertainty in the regional and local climatic response to global warming, although it may also bring new uncertainties due to the assumptions made. Our statistical downscaling results show that: (1) The spatial pattern correlation between downscaled simulated annual mean precipitation and observations is remarkably improved compared to between the original simulation and observations. (2) The downscaled monthly precipitation is quantitatively much closer to the observation than the original simulation in terms of seasonal variation. (3) The projected precipitation change can be reasonably explained by large-scale circulation. Moreover, there is still uncertainty in how much the global average surface temperature will respond to increases in atmospheric greenhouse gas concentrations and emissions. Multi-model ensemble results could reduce model biases and therefore reduce this uncertainty. In this respect, our results should be used with caution because they are derived from a single model. This limits the precipitation change pattern because it depends on regional forcings and how the model simulates local and remote effects, despite the ensemble technique. IPCC AR5 runs from other models will be used to deduce the uncertainty in further statistical downscaling projections and dynamical diagnostic studies.
Acknowledgments. This work was financed by the National Basic Research Program of China (Grant No. 2010CB428502) and the National Natural Science Foundation of China (Grant No. 40925015).
| 1 |
|
| 2 |
|
| 3 |
|
| 4 |
|
| 5 |
|
| 6 |
|
| 7 |
|
| 8 |
|
| 9 |
|
| 10 |
|
| 11 |
|
| 12 |
|
| 13 |
|
| 14 |
|
| 15 |
|
| 16 |
|
| 17 |
|
| 18 |
|
| 19 |
|
| 20 |
|
| 21 |
|
| 22 |
|