The Spatial Patterns of Initial Errors Related to the ¡°Winter Predictability Barrier¡± of the Indian Ocean Dipole
FENG Rong1, 2 , DUAN Wan-Suo1, * 
The Spatial Patterns of Initial Errors Related to the ¡°Winter Predictability Barrier¡± of the Indian Ocean Dipole |
|
FENG Rong
|
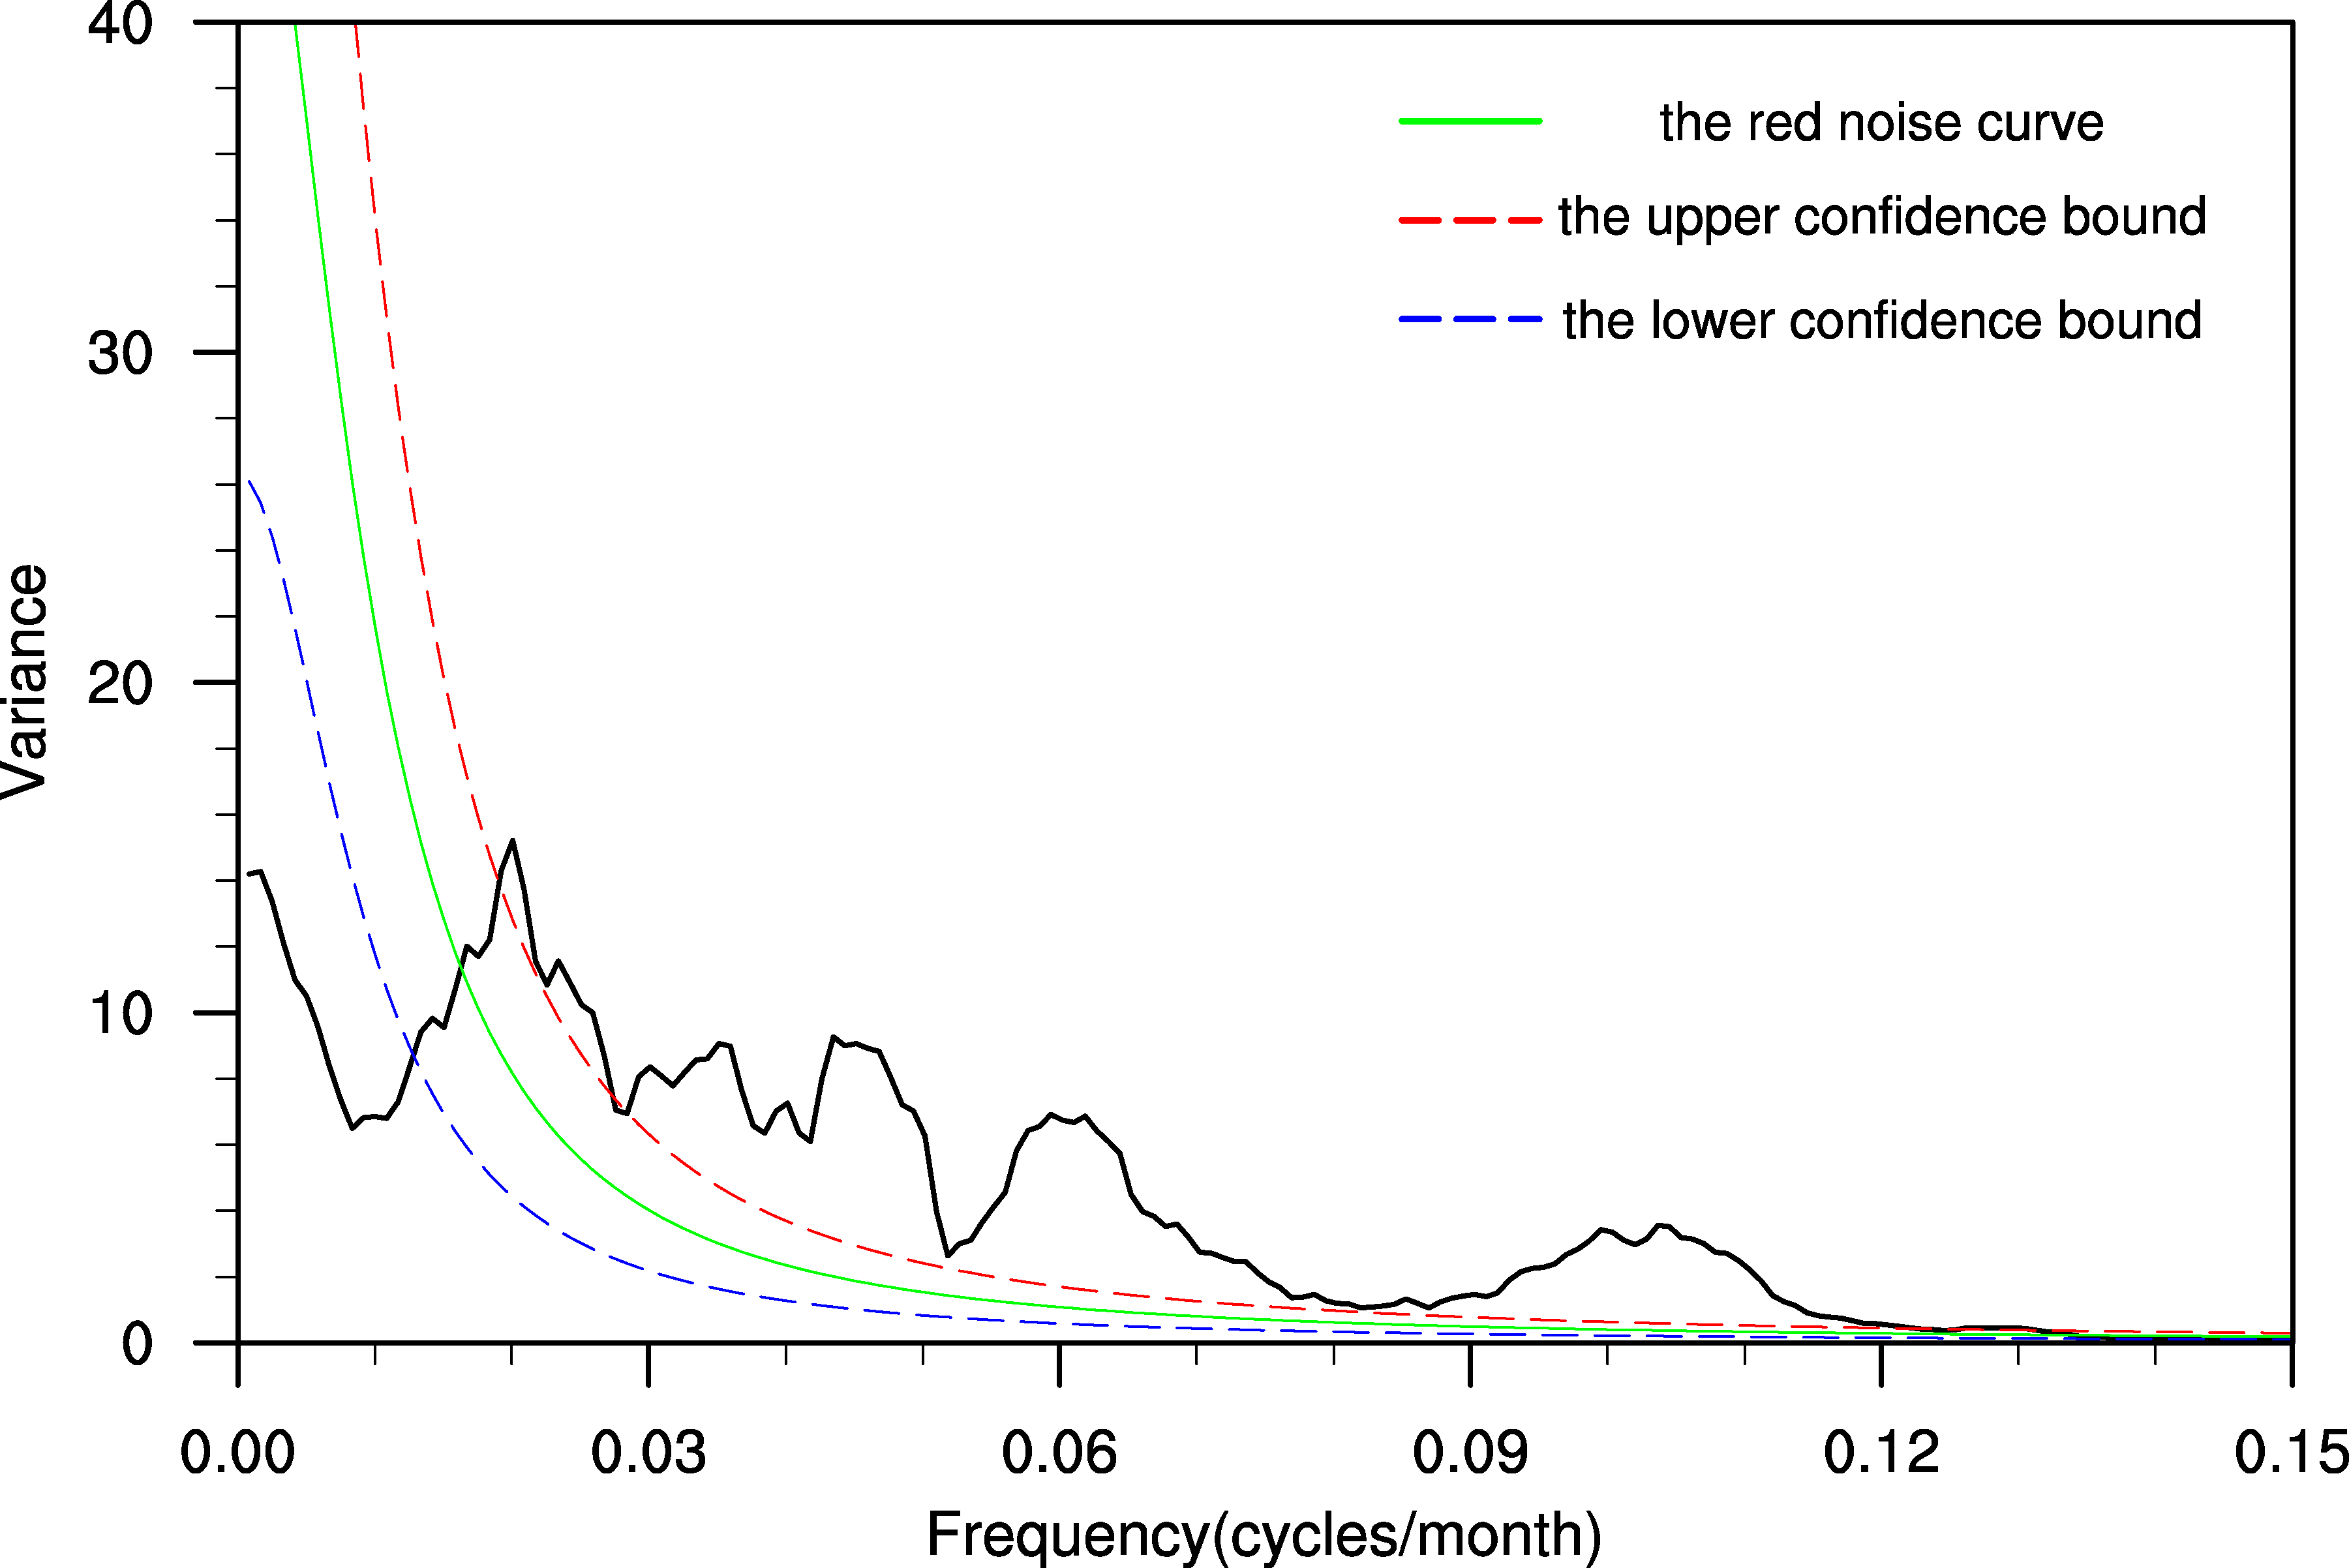
| Figure 2 Power spectrum of IOD index from 100-yr model data. The red and blue lines depict the significant intervals at the 0.05 level. |
| |