Sensitivity of Climate Changes to CO2 Emissions in China
Sensitivity of Climate Changes to CO2 Emissions in China |
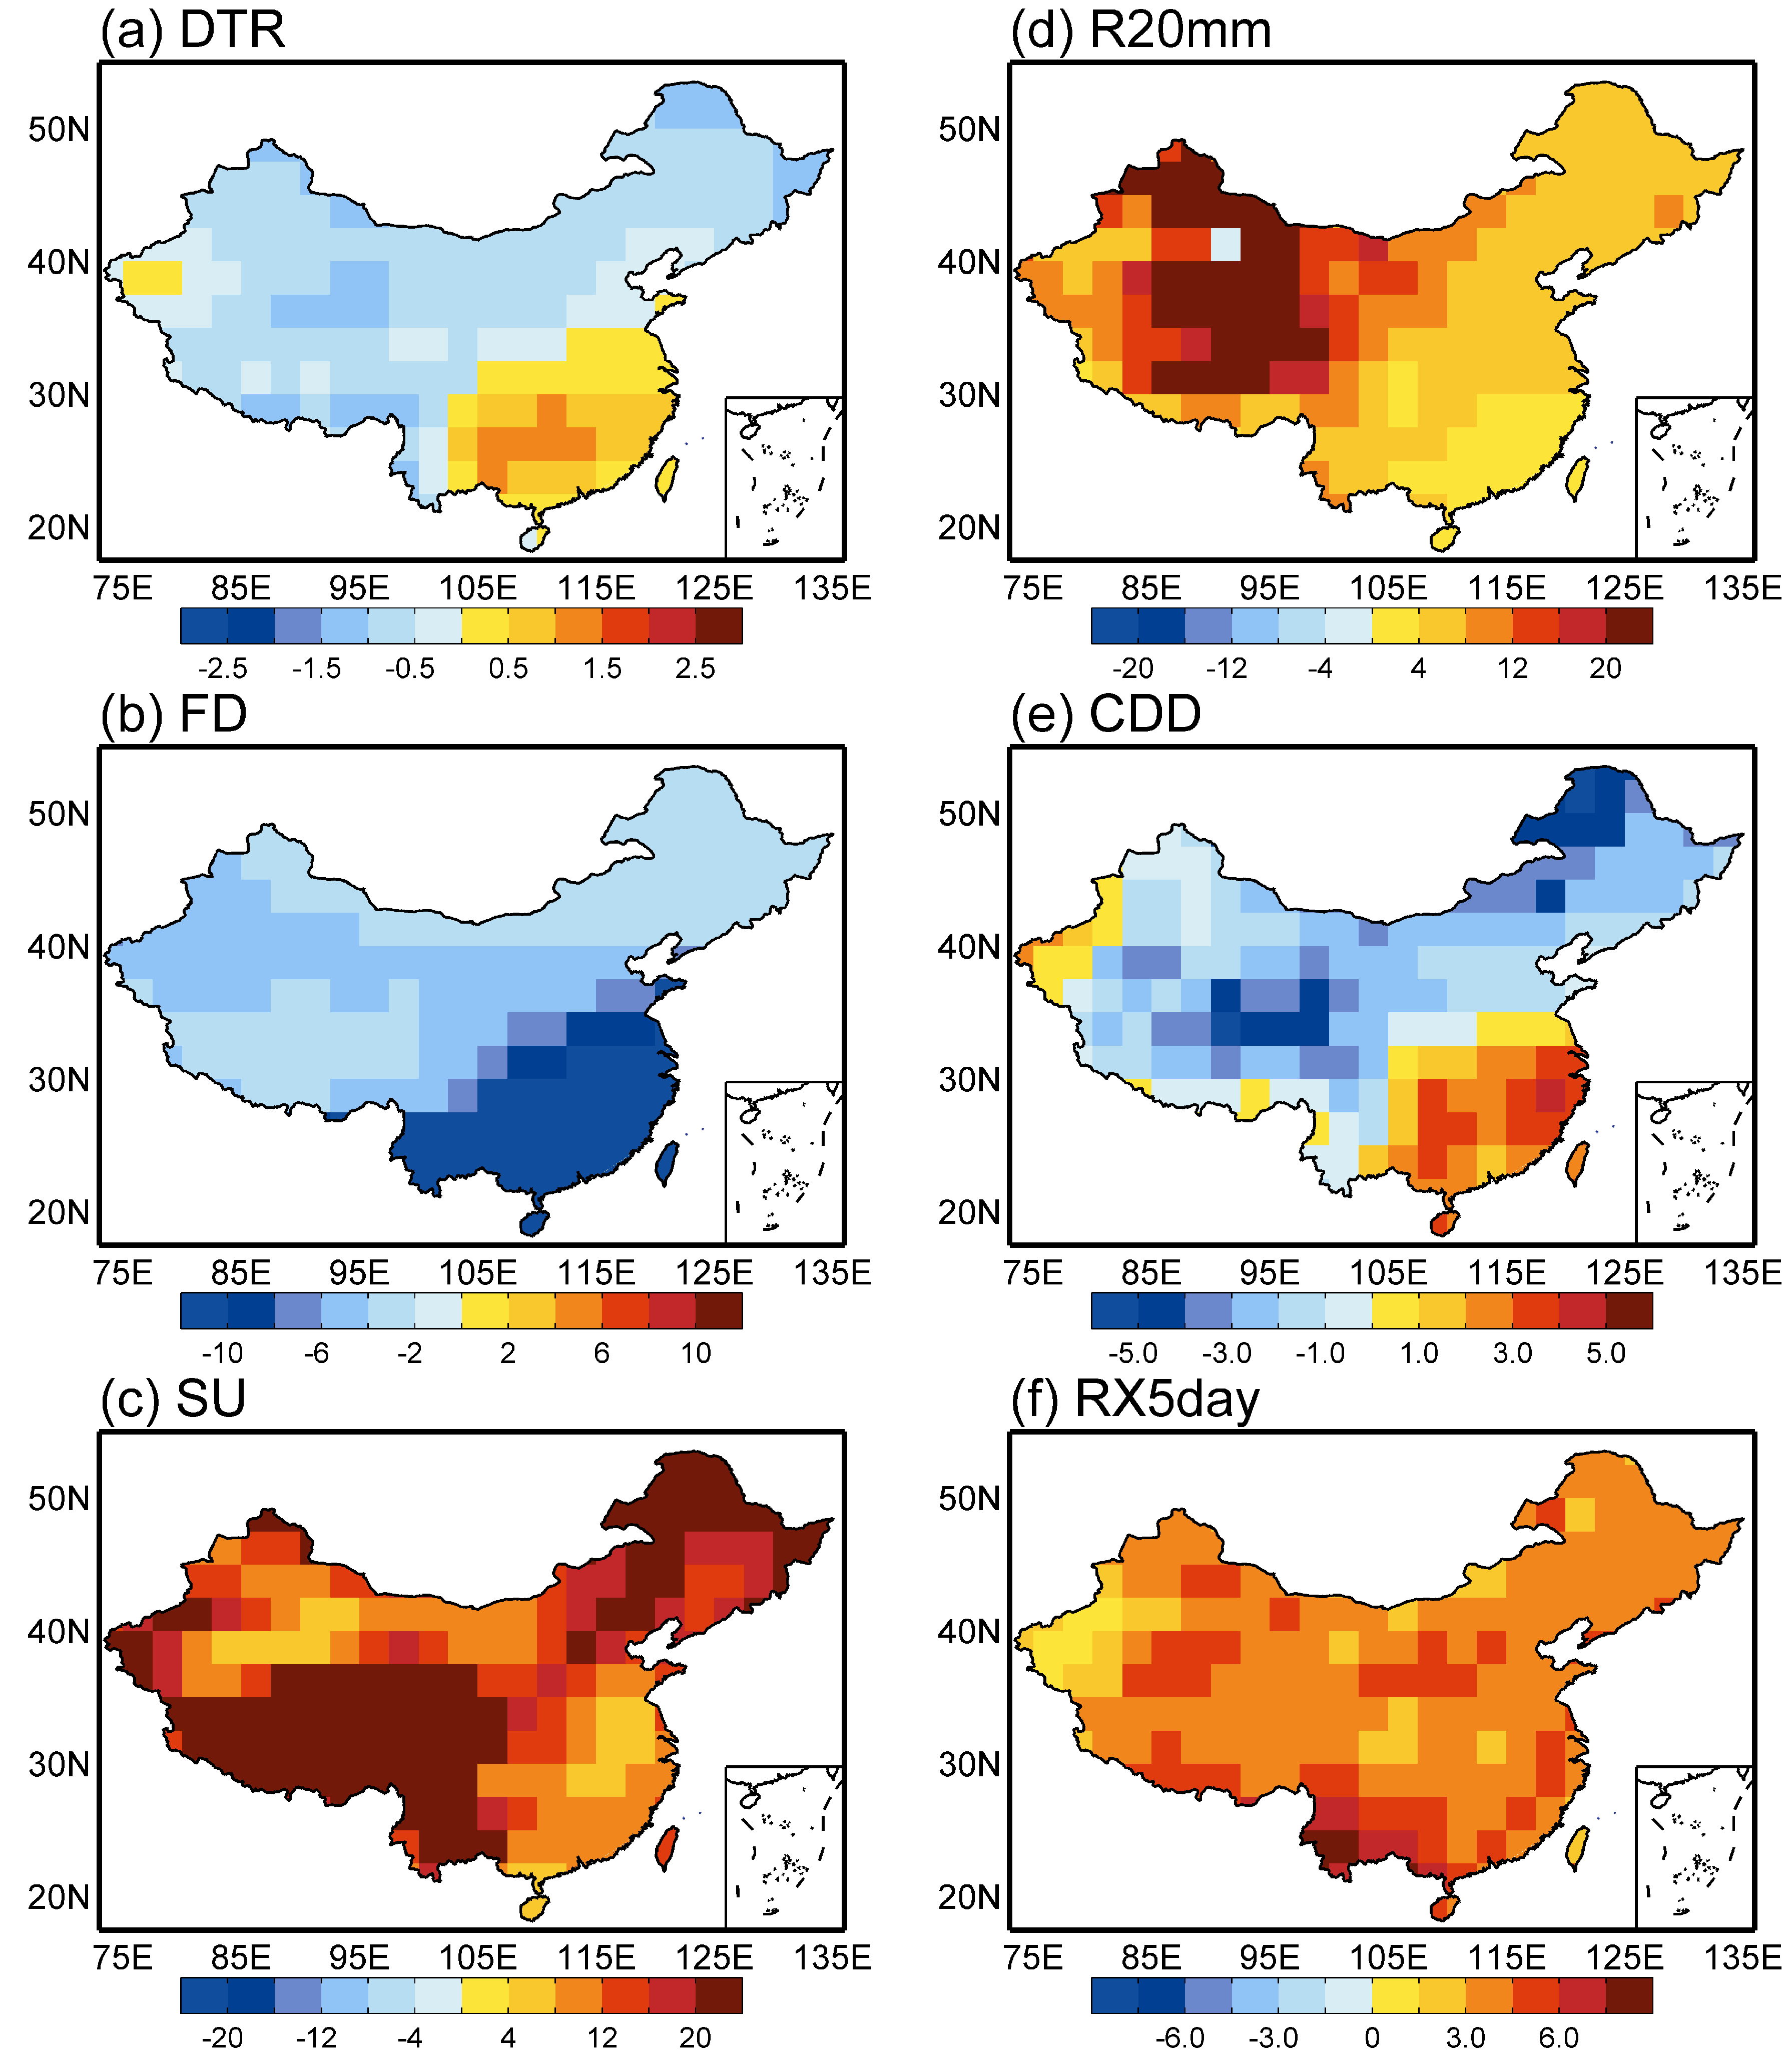
| Figure 2 Geographic distribution of the MME mean response in climate extreme indices to increased CO 2 induced warming in China for DCO 2 . The panels in the left column show the sensitivities of temperature-related extremes for a DTR, b FD, and c SU; and the panels in the right column show the sensitivities of precipitation-related extremes for d R20mm, e CDD, and f RX5day. Units: %#cod#x000b0;C. ples Figs. 2b and 2c, stronger negative sensitivity for decreasing FD is dominant over southern China, and relatively weaker in other regions; while a positive sensitivity for increasing SU covers the whole of China, with stronger sensitivity in Tibet, Northeast China, and some parts of North China, and weaker sensitivity in southern China and the arid regions of Northwest China. |
| |