Simulated Impacts of Sulfate and Nitrate Aerosol Formation on Surface-Layer Ozone Concentrations in China
[YANG Yang1, 2 , LIAO Hong1, *  , LOU Si-Jia
1, 2 ]
, LOU Si-Jia|
|


The authors quantify the impacts of sulfate and nitrate aerosol formation on surface-layer O3 concentrations over China using the one-way nested-grid capability of the global three-dimensional Goddard Earth Observing System chemical transport model (GEOS-Chem). Chemical reactions associated with sulfate formation are simulated to generally increase O3 concentrations in China. Over the North China Plain (NCP) and the Sichuan Basin (SCB), where simulated sulfate concentrations are the largest, ozone concentrations show maximum increases in spring by 1.8 ppbv (3.2%) in the NCP and by 2.6 ppbv (3.7%) in the SCB. On the contrary, nitrate formation is simulated to reduce O3 concentrations by up to 1.0 ppbv in eastern China, with the largest reductions of 1.0 ppbv (1.4%) in summer over the NCP. Accounting for the formation of both sulfate and nitrate, the surface-layer O3 concentrations over a large fraction of eastern China are simulated to increase in winter, spring, and autumn, dominated by the impact of sulfate formation, but to decrease in summer because of the dominant contribution from nitrate formation.
Tropospheric O3 and aerosols are major air pollutants that affect human health, crops, plants, and global climate change ( Wang et al., 2009; Intergovernmental Panel on Climate Change (IPCC), 2013). Concentrations of tropospheric O3 and aerosols are coupled through the formation and growth of aerosols, heterogeneous reactions, and aer-osol-induced changes in photolysis rates. Numerous global and regional modeling studies have examined the impacts of aerosols on O3 concentrations through heterogeneous reactions and changes in photolysis rates ( Tang et al., 2004; Liao and Seinfeld, 2005; Tie et al., 2005; Pozzoli et al., 2008; Kanaya et al., 2009; Li et al., 2011; Xu et al., 2012; Lou et al., 2014), which report that simulated O3 concentrations decrease by about 10%-20% over eastern China by these two processes. However, few studies have isolated and quantified the influence of sulfate and nitrate formation on O3 concentrations in China.
Tropospheric O3 is formed during the oxidation of CO, CH4, and Volatile Organic Compounds (VOCs) in the presence of NO x. Sulfate aerosol forms in the gas phase by reaction of SO2 with hydroxyl radical (OH), and in the aqueous phase by reactions of SO2 with hydrogen peroxide (H2O2) and O3 ( Unger et al., 2006). The formation of nitrate aerosol depends on gas-aerosol partitioning of nitric acid ( Seinfeld and Pandis, 2006), which forms mainly from NO x during daytime and from N2O5, NO2, and NO3 through heterogeneous reactions during nighttime ( Pye et al., 2009). Hence, the changes in concentrations of OH, H2O2, and NO x resulting from the formation of sulfate and nitrate are expected to influence concentrations of tropospheric O3.
The goal of this study is to isolate the impact of sulfate and nitrate formation on O3 concentrations in China using a global three-dimensional Goddard Earth Observing System (GEOS) chemical transport model (GEOS-Chem) driven by the assimilated meteorological fields. We pay special attention to the spatial and temporal distributions of the changes in OH, HO2, NO x, and O3 through the formation of sulfate and nitrate.
We simulate concentrations of O3 and aerosols using the nested grid version of the global chemical transport model GEOS-Chem (version 9.1.2, http://acmg.seas.harvard. edu/geos/) driven by the assimilated meteorological fields from the Goddard Earth Observing System (GEOS-5) of the National Aeronautics and Space Administration (NASA) Global Modeling and Assimilation Office (GMAO). The nested area for Asia (10-55°N, 70-150°E) has a horizontal resolution of 0.5° × 0.667° (latitude by longitude) and 47 vertical layers up to 0.01 hPa. The global GEOS-Chem simulation at a horizontal resolution of 4° × 5° provides the tracer concentrations at the lateral boundaries, which are updated in the nested-grid model every three hours ( Chen et al., 2009).
The GEOS-Chem model includes fully coupled O3-NO x- hydrocarbon chemistry and aerosols, including sulfate/ nitrate/ammonium ( Park et al., 2004; Pye et al., 2009), black carbon (BC), organic carbon (OC) ( Park et al., 2003), sea salt ( Alexander et al., 2005), and mineral dust ( Fairlie et al., 2007). About 80 species and over 300 chemical reactions are considered for the simulation of tropospheric O3 ( Bey et al., 2001). The partitioning of nitric acid and ammonia between aerosol and gas phases is calculated by ISORROPIA II ( Fountoukis and Nenes, 2007). Secondary organic aerosol simulation considers the oxidation of isoprene, monoterpenes, other reactive VOCs (ORVOCs), and aromatics ( Henze and Seinfeld, 2006; Liao et al., 2007; Henze et al., 2008).
The global emissions of O3 precursors, aerosol precursors, and aerosols generally follow Park et al. (2003, 2004). The anthropogenic emissions of CO, NO x, SO2, and Non- Methane Volatile Organic Compounds (NMVOCs) in the Asian domain are taken from the David Streets' 2006 emi-ssion inventory (http://mic.greenresource.cn/intex-b2006). Emissions of NH3 are taken from Streets et al. (2003) but are scaled to have a total NH3 emission of 9.8 Tg yr-1 in China, following the study of Huang et al. (2012), instead of the estimate of 13.5 Tg yr-1 in Streets et al. (2003). The annual emissions of NO x, CO, NMVOCs, SO2, and NH3 in eastern China (20-50°N, 110-126°E) are shown in Table 1. The seasonal variations of SO2, NO x, and NH3 emissions follow those in Lou et al. (2014).
| Table 1 Annual emissions of precursors of ozone, sulfate and nitrate in eastern China (20-50°N, 110-126°E). |
We simulate year the 2006 tropospheric O3 concentrations in the following GEOS-Chem simulations to examine the impacts of sulfate and nitrate formation on O3 concentrations in China:(1) Control (CTRL): The control simulation of tropospheric O3 for the year 2006. Heterogeneous reactions and the effect of aerosols on photolysis rates are turned off to isolate the impacts of sulfate and nitrate formation on O3 concentrations.
(2) NS: The same as the CTRL simulation, but without the formation of sulfate aerosol. The global anthropogenic and natural emissions of sulfur are set to zero.
(3) NN: The same as the CTRL simulation, but without the formation of nitrate aerosol. The aerosol thermodynamic module, ISOROPIA II, is switched off to produce no conversion of nitric acid and ammonia to aerosol phases.
(4) NSNN: The same as the CTRL simulation, but without the formation of sulfate and nitrate.
The impacts of sulfate and nitrate formation on O3 concentrations can be quantified by the differences between CTRL and NS (NN), (CTRL-NS and CTRL-NN), respectively. All simulations are integrated for the period of 1 January to 31 December 2006 after a six-month model spin up.
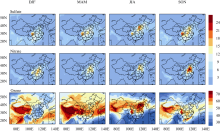
Figure 1 shows the simulated seasonal mean surface- layer concentrations of sulfate, nitrate, and O3 in China from the CTRL simulation. Sulfate concentrations of 15-21 μg m-3 are simulated over the Sichuan Basin (SCB) throughout the year and over the North China Plain (NCP) in June-July-August (JJA) and September-October-Nove-mber (SON). High nitrate concentrations of 12-21 μg m-3 are simulated in eastern China, which have a seasonal trend of higher concentrations in December-January-Febr-uary (DJF) and SON than in March-April-May (MAM) and JJA, because the low temperatures in DJF and SON favor ammonium nitrate formation. The simulated seasonal mean surface-layer concentrations of O3 in the CTRL simulation are also shown in Fig. 1. Over eastern China, simulated O3 concentrations are in the ranges of 50-65 ppbv and 45-60 ppbv in MAM and SON, respectively, and exhibit maximum values of 60-75 ppbv in JJA. Due to the transport of O3 from the stratosphere to the troposphere, high O3 concentrations exceeding 75 ppbv are simulated over the Tibetan Plateau in MAM ( Wild and Akimoto, 2001).
The simulated concentrations of surface-layer sulfate, nitrate, and O3 in China using the one-way nested-grid capability of the GEOS-Chem have been evaluated in previous studies ( Wang et al., 2011, 2013). Wang et al.
 | Figure 1 Simulated seasonal mean surface-layer concentrations of sulfate, nitrate, and O3 in the CTRL simulation. Units are μg m-3 for aerosols and ppbv for O3. |
(2013) found that the simulated concentrations of sulfate are underestimated by about 10%, and the simulated nitrate aerosol concentrations are overestimated by 31%. The magnitude and seasonal variation of surface-layer O3 concentrations are captured well by the GEOS-Chem model ( Lou et al., 2014).
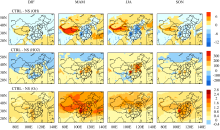
The impacts of sulfate formation on surface-layer O3concentrations can be examined by looking at the differences in concentrations of OH, HO2, and O3 between CTRL and NS (CTRL-NS) (Fig. 2). Relative to NS simulation, the formation of sulfate in CTRL is simulated to reduce OH concentrations over polluted areas in eastern China. For example, the simulated changes in surface-layer OH concentrations exhibit the largest decreases of 6×10⁴-15×104 molecules cm-3 in JJA and of 3×10⁴- 9×10⁴ molecules cm-3 in MAM and SON over the NCP and SCB areas. The decreases in OH in polluted areas can be explained by the depletion of OH during sulfate formation, by reaction of SO2 with OH in the gas phase, and by reactions of SO2 with H2O2 and O3 in the aqueous phase. The latter reactions reduce OH concentrations via photol--ysis reactions of H2O2
concentrations exhibit increases in relatively clean western China, which result from the increases in O3 (discussed below) and then the production of OH through O3
 | Figure 2 Simulated impacts of sulfate formation (CTRL-NS) on concentrations of seasonal mean surface-layer OH (104 molecules cm-3), HO2 (pptv), and O3 (ppbv). |
The loss of OH via oxidation of SO2 leads to formation of HO2 in polluted eastern China by the reaction of SO2+ OH+M→SO4+HO2, which can be seen clearly in Fig. 2. Such increases in HO2 concentrations accelerate conversion of NO to NO2, leading to increases in O3 concentrations over places with high sulfate concentrations in the CTRL simulation. Over the SCB, the maximum seasonal mean increases in O3 by sulfate formation are simulated to be 1.2 ppbv (2.7%), 2.6 ppbv (3.7%), 1.4 ppbv (2.0%), and 2.3 ppbv (3.5%) in DJF, MAM, JJA, and SON, respectively. In the NCP, the largest increases in O3 concentrations are simulated to be 0.7 ppbv (1.7%), 1.8 ppbv (3.2%), 1.7 ppbv (2.4%), and 1.4 ppbv (2.8%) in DJF, MAM, JJA, and SON, respectively. Sulfate formation leads to general increases in O3 in mid-to-high latitudes in the Northern Hemisphere (including western China) during MAM and JJA, as a result of the relatively long lifetime of O3 of about three weeks ( Liao et al., 2006).
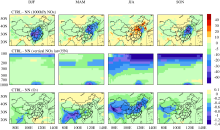
To understand the impacts of nitrate formation on surface-layer O3 concentrations, we first examine the impacts of nitrate formation on NO x concentrations (Fig. 3). Relative to NN, the consideration of nitrate formation in the CTRL simulation leads to general decreases in NO x concentrations over areas with high nitrate concentrations (Figs. 1 and 3), from the surface to the middle and upper troposphere (Fig. 3). One exception is that the surface- layer NO x is simulated to increase over the NCP in JJA as a result of nitrate formation, which can be explained by the large depletion of OH associated with the simulated decreases in O3 in this area. The lifetime of NO x increases via the weakened reaction of NO2+OH.
As a result of nitrate formation, surface-layer O3 con-centrations are simulated to decrease by less than 1 ppbv in eastern China in all seasons. The largest decrease in O3 concentration of 1.0 ppbv (1.4%) is simulated over the NCP in JJA. In the CTRL simulation, O3 formation is found to be VOCs-limited in a large fraction of eastern China in winter, and NO x-limited in other seasons in eastern China, except for the polluted regions of the NCP and Yangtze River Delta, which agrees with Liu et al. (2010). No matter whether O3 formation is NO x- or VOCs-limited at the ground level, it is always NO x-limited from about 850 hPa to the middle troposphere over China. As a result, in JJA, although the surface-layer NO x concentrations are simulated to increase in the NCP, NO x levels above 975 hPa and in its surrounding areas exhibit reductions (Fig. 3), leading to the large decreases in surface-layer O3 over the NCP by chemical transport.
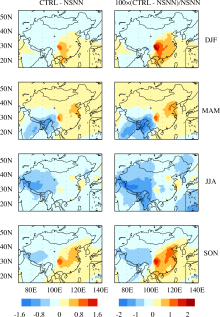
The impacts of the formation of sulfate and nitrate on surface-layer O3 concentrations are obtained by examining the differences in O3 between the CTRL and NSNN simulations (CTRL-NSNN) (Fig. 4). Relative to NSNN, the O3 concentrations in CTRL are simulated to increase in polluted areas, with seasonal mean maximum increases of 1.1 ppbv (2.3%), 0.9 ppbv (1.2%), 0.3 ppbv (0.4%), and 1.2 ppbv (1.8%) over the SCB, as well as 0.4 ppbv (0.9%), 0.6 ppbv (1.2%), 0.4 ppbv (0.6%), and 0.7 ppbv (1.5%) over the Beijing-Tianjin-Tangshan (BTT) region, in DJF, MAM, JJA, and SON, respectively. The surface- layer O3 concentrations over a large fraction of eastern China are simulated to increase in winter, spring, and autumn, dominated by the impact of sulfate formation, but to decrease in summer because of the dominant contribution from nitrate formation.
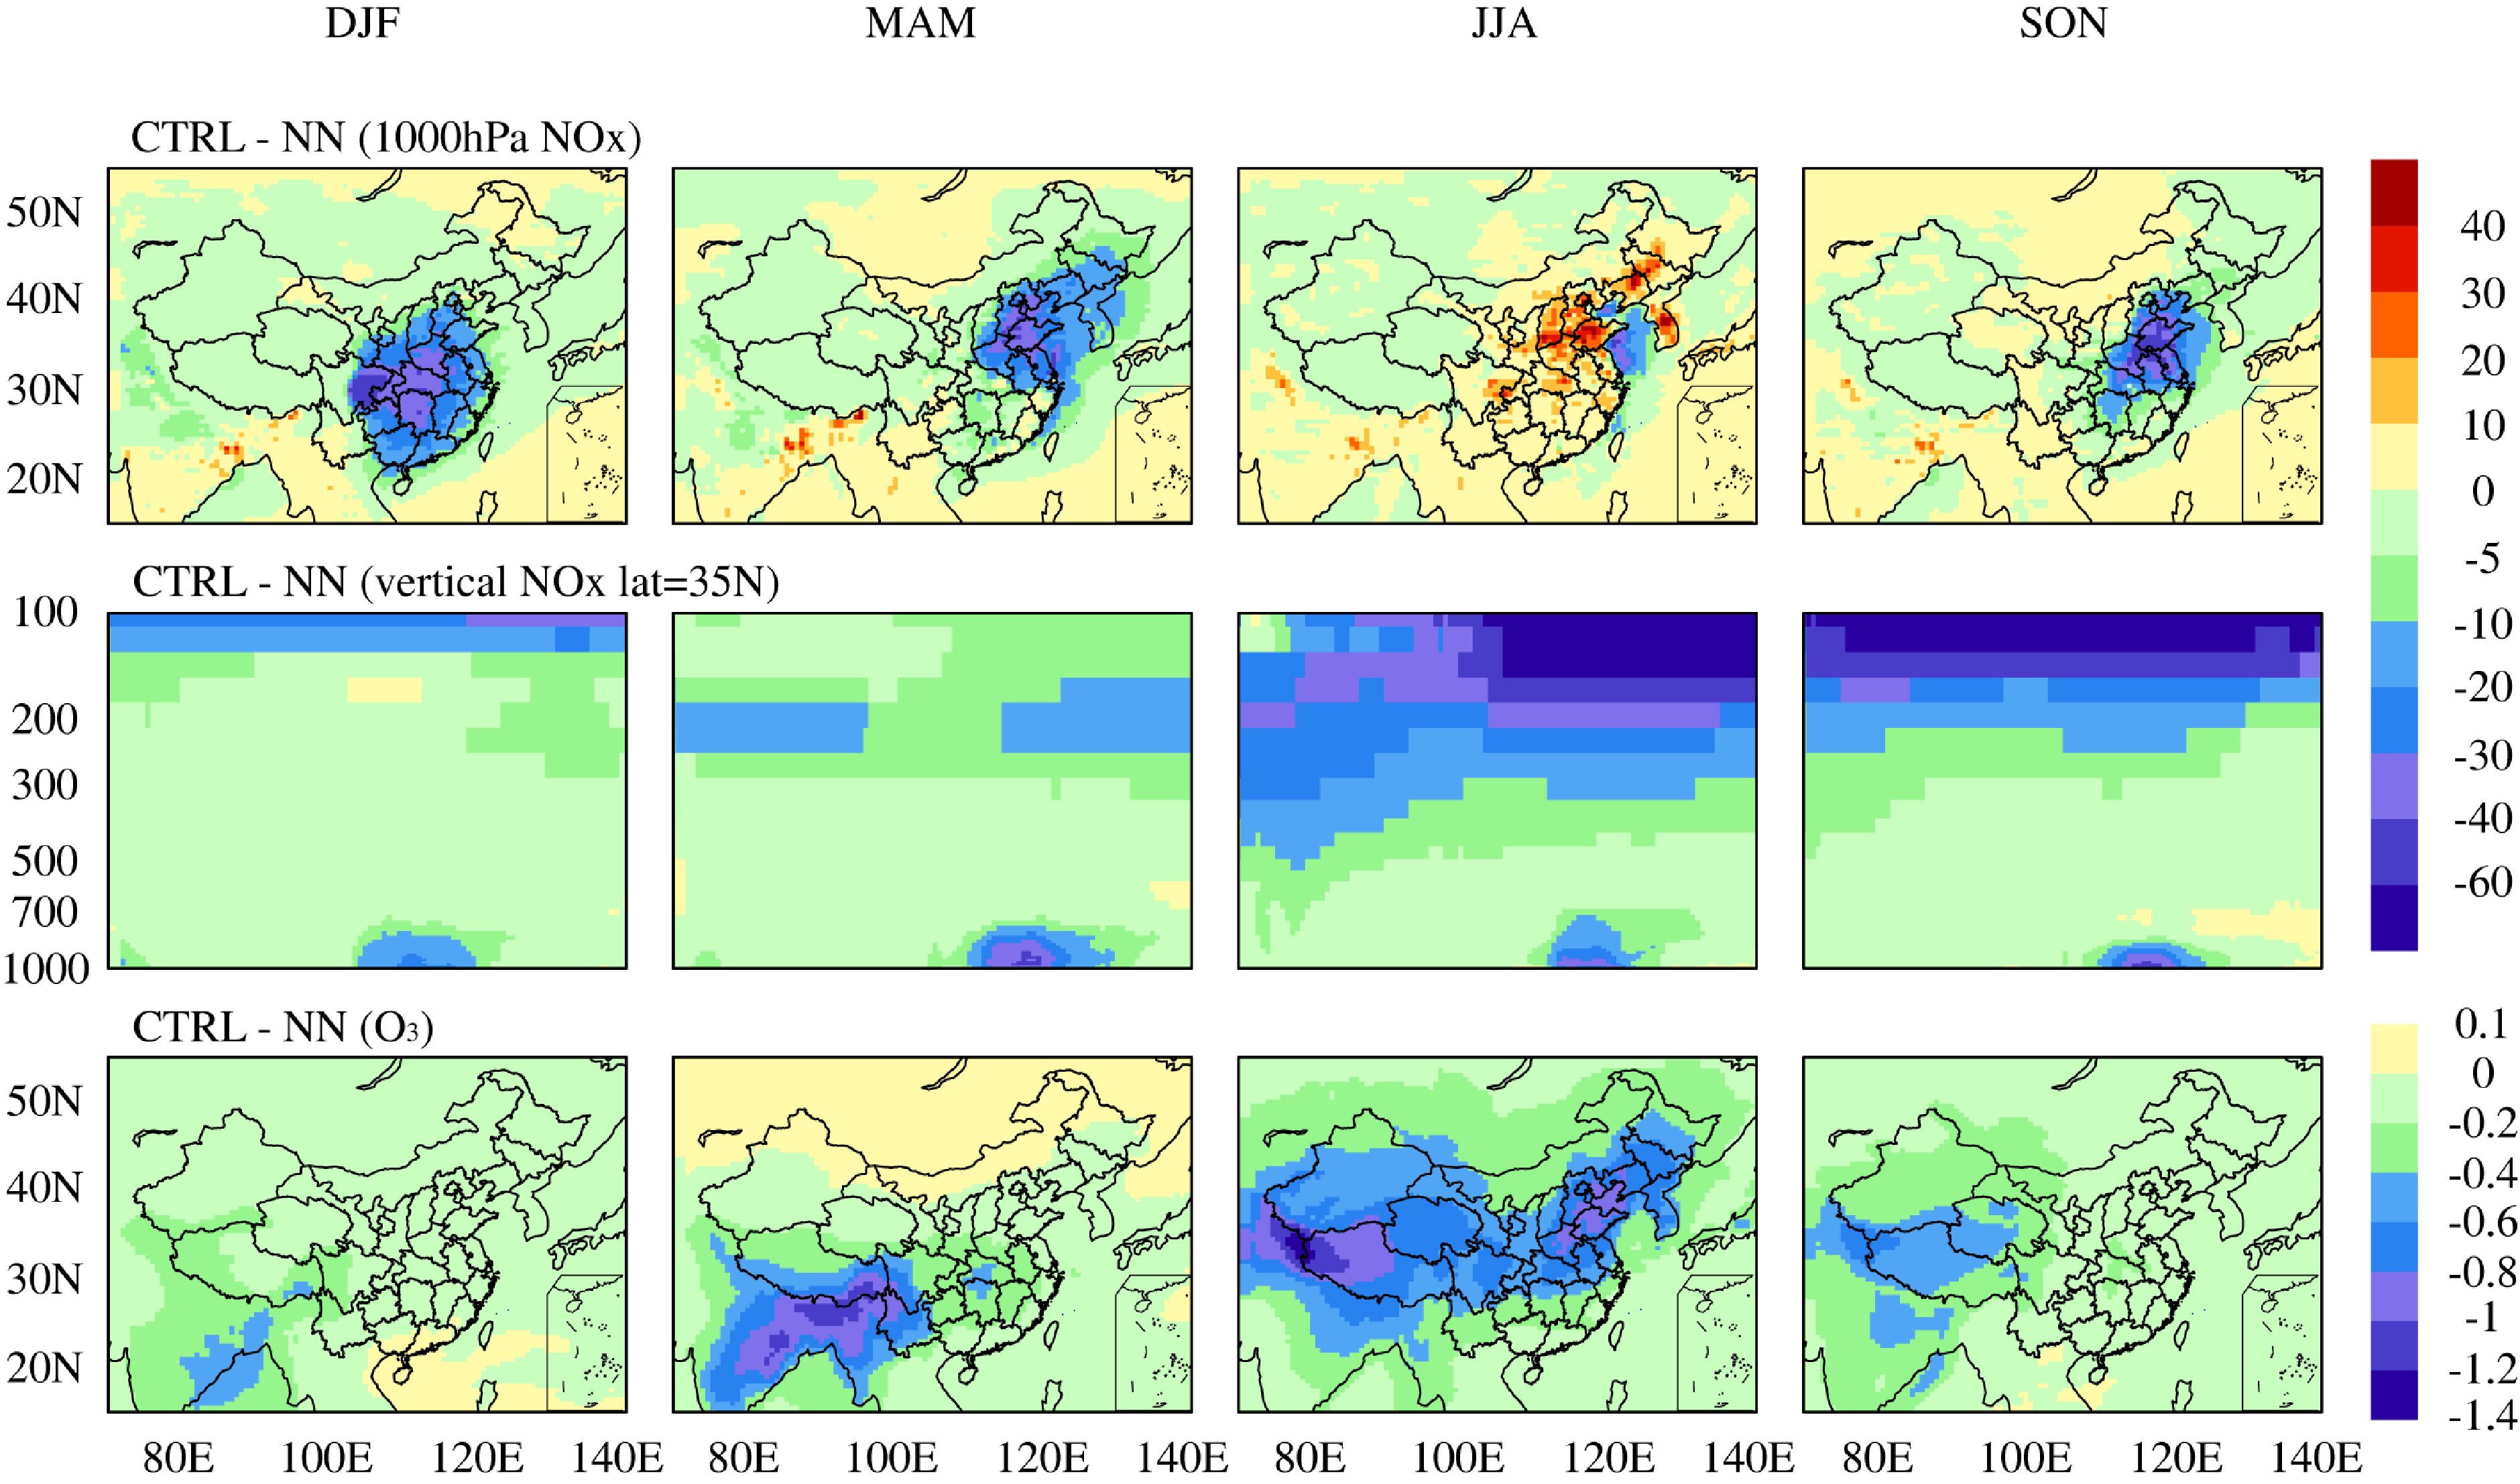 | Figure 3 Simulated impacts of nitrate formation (CTRL-NN) on concentrations of seasonal mean NO x at the surface-layer (the top panels) and at the latitudinal plane along 35°N from 70°E to 140°E (middle panels; vertical axis is atmospheric pressure in hPa). The bottom panels are the simulated impacts of nitrate formation on surface-layer O3. Units are pptv for NO x and ppbv for O3. |
 | Figure 4 Simulated changes in seasonal mean surface-layer O3 concentrations by the formation of sulfate and nitrate aerosols (CTRL- NSNN). The left column shows changes in ppbv and the right column shows percentage changes in the CTRL simulation relative to NSNN. |
We use the global chemical transport model GEOS-Chem to quantify the impacts of sulfate and nitrate formation on surface-layer O3 concentrations. As a result of sulfate formation, the decreases in OH concentrations and increases in HO2 concentrations over polluted regions are simulated to increase O3 concentrations, with maximum seasonal mean increases by 1.2 ppbv (2.7%), 2.6 ppbv (3.7%), 1.4 ppbv (2.0%), and 2.3 ppbv (3.5%) over the SCB, as well as by 0.7 ppbv (1.7%), 1.8 ppbv (3.2%), 1.7 ppbv (2.4%), and 1.4 ppbv (2.8%) over the NCP, in DJF, MAM, JJA, and SON, respectively. The surface-layer O3 concentrations are simulated to decrease over the whole of China because of nitrate formation, with the largest reductions of 1.0 ppbv (1.4%) over the NCP in JJA. Accounting for the formation of both sulfate and nitrate aerosols, seasonal mean O3 concentrations are simulated to increase in polluted areas; the largest increases in O3 are approximately 0.3-1.1 ppbv (0.4%-2.3%) over the NCP and SCB. The surface-layer O3 concentrations over a large fraction of eastern China are simulated to increase in winter, spring, and autumn, dominated by the impact of sulfate formation, but to decrease in summer because of the dominant contribution from nitrate formation.
The impacts of sulfate and nitrate formation on O3 concentrations found in this study are much smaller than the simulated impacts by heterogeneous reactions on aerosols reported in previous studies. Liao and Seinfeld (2005) found that the simulated annual mean surface- layer O3 concentrations were reduced by 25%-30% over eastern China due to the heterogeneous reactions on aerosols. Pozzoli et al. (2008) showed that surface-layer O3 concentrations were reduced by 18%-23% over the Transport and Chemical Evolution over the Pacific (TRACE-P) region in March of 2001, as the heterogeneous reactions were considered. Lou et al. (2014) quantified the impacts of aerosols on O3 concentrations through heterogeneous reactions by using the same version of GEOS-Chem as in this study, and found that simulated sur-face-layer O3 concentrations in eastern China were red-uced by 10%-18% on an annual mean basis. The simulated largest increases in O3 due to formation of sulfate and nitrate aerosols are approximately 0.3-1.1 ppbv (0.4%-2.3%) in this study, which are similar in magnitude to the reported 2%-4% changes in surface-layer O3 concentrations through the radiative effects of aerosols on gas-phase photolysis rates ( Tie et al., 2005; Real and Sartelet, 2011; Lou et al., 2014).
We conclude that the simulated impacts on O3 by sulfate and nitrate formation should not be neglected, especially when they are compared with changes in O3 concentrations by biogenic volatile organic carbon (BVOC) emissions. For example, Qu et al. (2013) found that surface-layer O3 concentrations from the contributions of BVOCs were less than 1 ppbv in eastern China, except for contributions of 1-5 ppbv in the Yangtze River Delta and NCP in summer. Situ et al. (2013) suggested that emissions of BVOCs increased surface O3 concentrations by up to 3 ppbv during 1300-1700 (local time) over the Pearl River Delta region in autumn.
Acknowledgments. This work was supported by the National Basic Research Program of China (973 program, Grant No. 2014CB441202) and the Strategic Priority Research Program of the Chinese Academy of Sciences (Grant No. XDA05100503).
| 1 |
|
| 2 |
|
| 3 |
|
| 4 |
|
| 5 |
|
| 6 |
|
| 7 |
|
| 8 |
|
| 9 |
|
| 10 |
|
| 11 |
|
| 12 |
|
| 13 |
|
| 14 |
|
| 15 |
|
| 16 |
|
| 17 |
|
| 18 |
|
| 19 |
|
| 20 |
|
| 21 |
|
| 22 |
|
| 23 |
|
| 24 |
|
| 25 |
|
| 26 |
|
| 27 |
|
| 28 |
|
| 29 |
|
| 30 |
|
| 31 |
|
| 32 |
|
| 33 |
|
| 34 |
|