ENSO Variability Simulated by a Coupled General Circulation Model: ECHAM5/MPI-OM
ZHENG Fei
ENSO Variability Simulated by a Coupled General Circulation Model: ECHAM5/MPI-OM |
|
ZHENG Fei
|
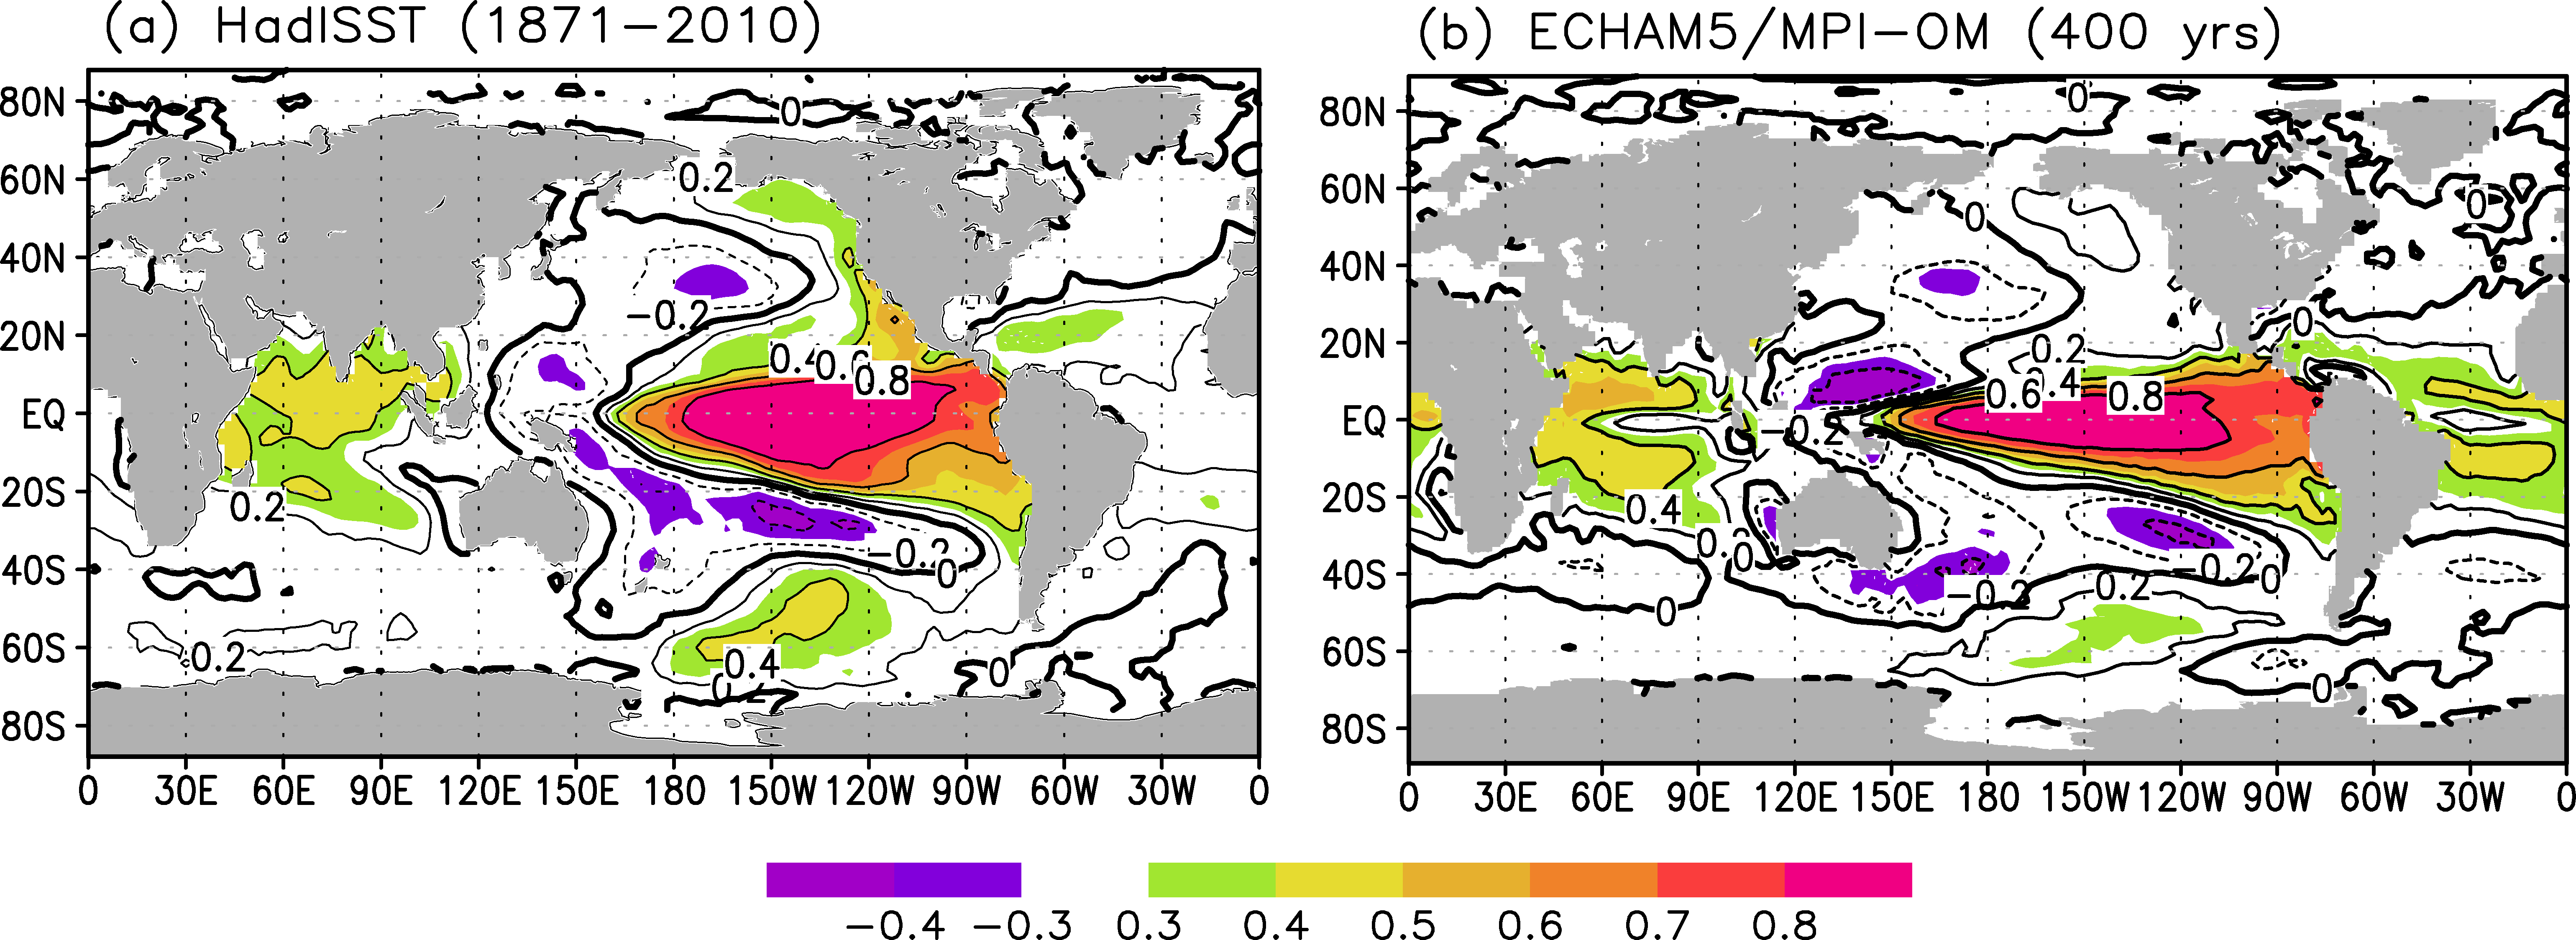
| Figure 1 Correlations between the SST averaged over the Ni#cod#x000f1;o3.4 region and the global SST for a the HadISST data and b the ECHAM5MPI-OM simulation. Regions where the correlation exceeds 0.3 or -0.3 are shaded in color. |
| |