ENSO Variability Simulated by a Coupled General Circulation Model: ECHAM5/MPI-OM
ZHENG Fei
ENSO Variability Simulated by a Coupled General Circulation Model: ECHAM5/MPI-OM |
|
ZHENG Fei
|
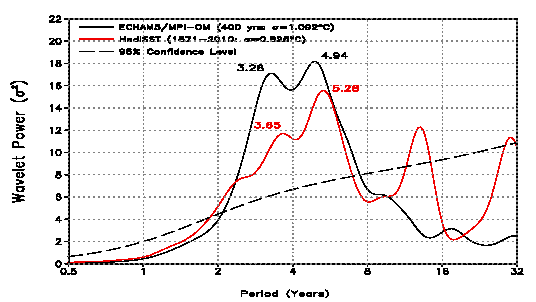
| Figure 3 Power spectra from observed and simulated Ni#cod#x000f1;o 3.4 SST anomalies. Observations are from HadISST for the period 1871 to 2010. Simulated data are from the total 400-yr period. All data are detrended and normalized by their standard deviation. |
| |