ENSO Variability Simulated by a Coupled General Circulation Model: ECHAM5/MPI-OM
ZHENG Fei
ENSO Variability Simulated by a Coupled General Circulation Model: ECHAM5/MPI-OM |
|
ZHENG Fei
|
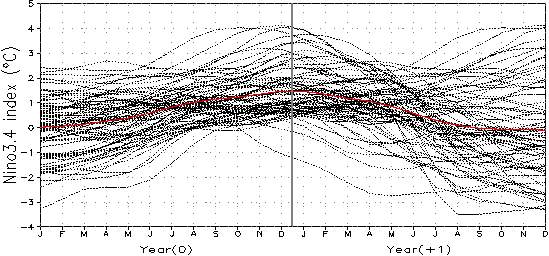
| Figure 5 Ni#cod#x000f1;o3.4 indices of SST anomaly for the ECHAM5MPI-OM simulation results, and 78 consecutive model El Ni#cod#x000f1;o events from a total 400-yr simulation are included here. Dashed black curves are aligned based on the year of the peak warm phase, and the thick red curve represents the average of these warm events. Warm events are selected according to the criteria that warm amplitudes of three consecutive months centered on the month of maximum warming exceeds 0.5#cod#x000b0;C. |
| |