A Fourteen-Year Climatology of the Southwest Vortex in Summer
FU Shen-Ming1, 2  , ZHANG Jing-Ping
3 , SUN Jian-Hua4, 5 , SHEN Xin-Yong3
, ZHANG Jing-Ping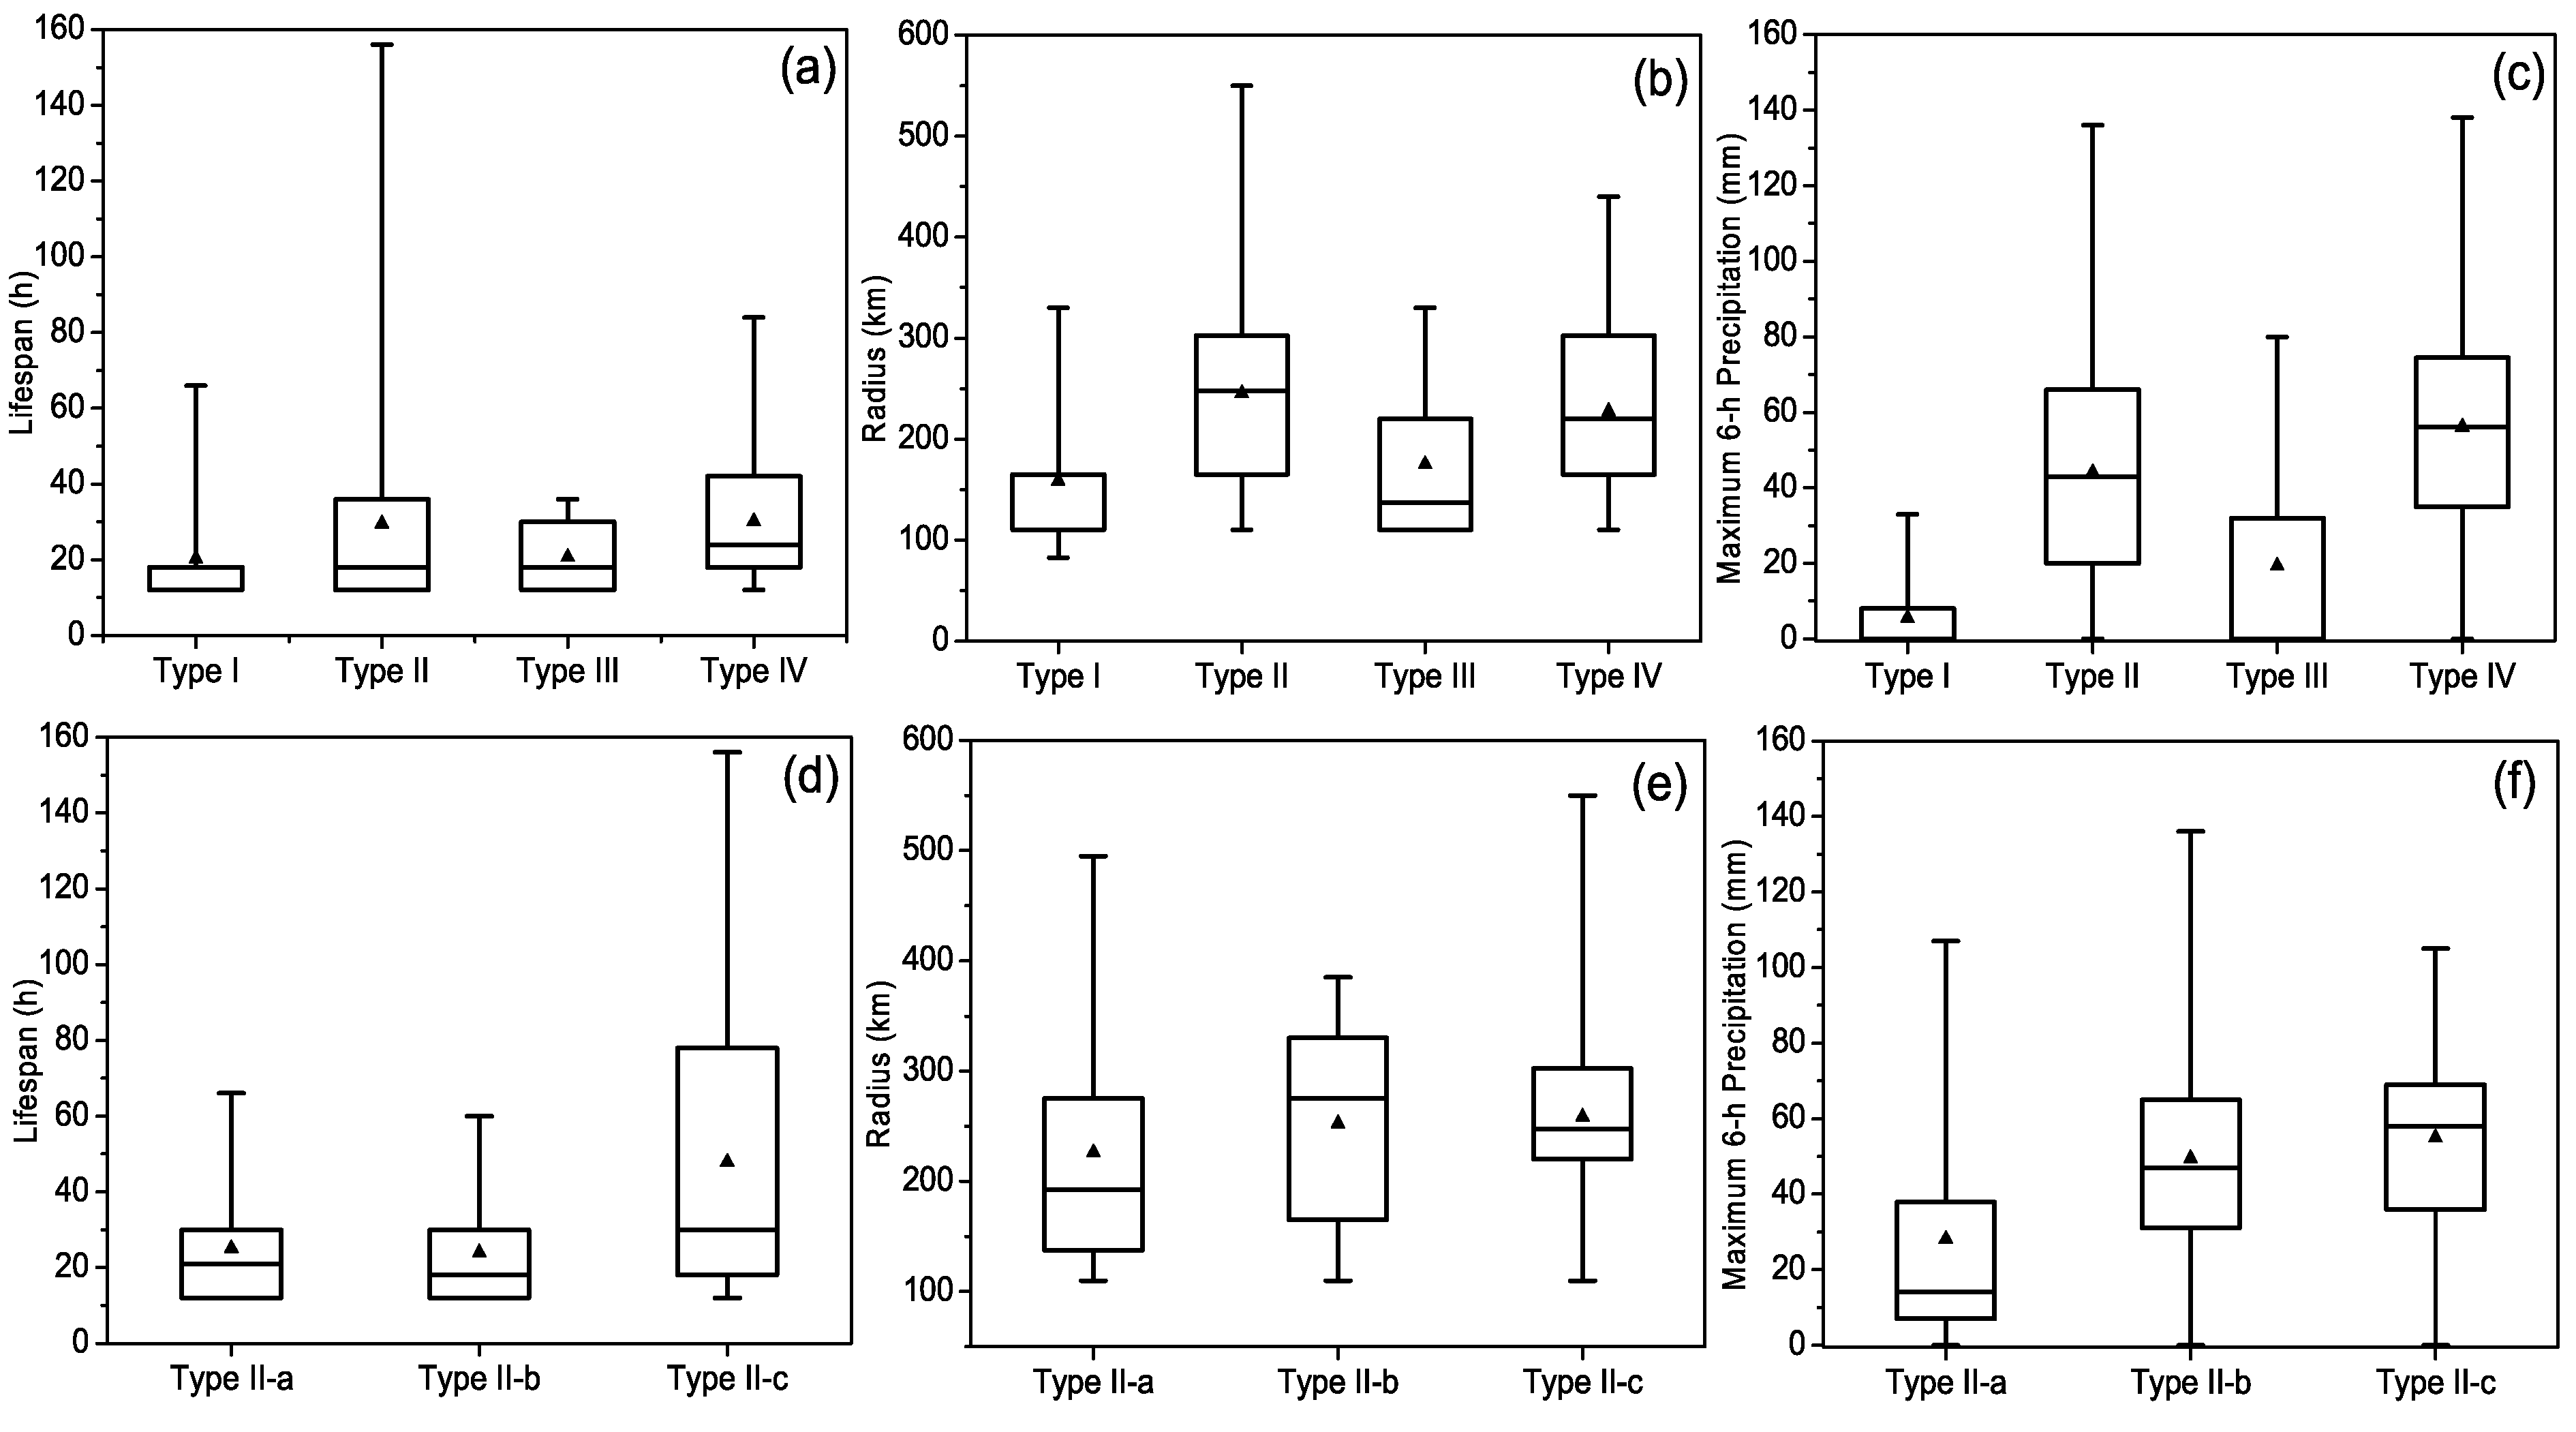
A Fourteen-Year Climatology of the Southwest Vortex in Summer |
|
FU Shen-Ming
, ZHANG Jing-Ping |
| Figure 2 Upper row: Classification of SWVs that lasted for more than 12 h averages are marked by triangles; maximums and minimums are marked by segments: a lifespan; b radius; c maximum 6-h precipitation. Lower row: Classification of type II SWVs based on the intensity of precipitation 0-20 mm, 20-50 mm, and #cod#x02265;#cod#x003b2;50 mm before the initiation of the SWV averages are marked by triangles; maximums and minimums are marked by segments: d lifespan; e radius; f maximum 6-h precipitation. |
| |