Interdecadal and Interannnual Variabilities of the Antarctic Oscillation Simulated by CAM3
XUE Feng1  , SUN Dan
2, 3 , ZHOU Tian-Jun2
, SUN Dan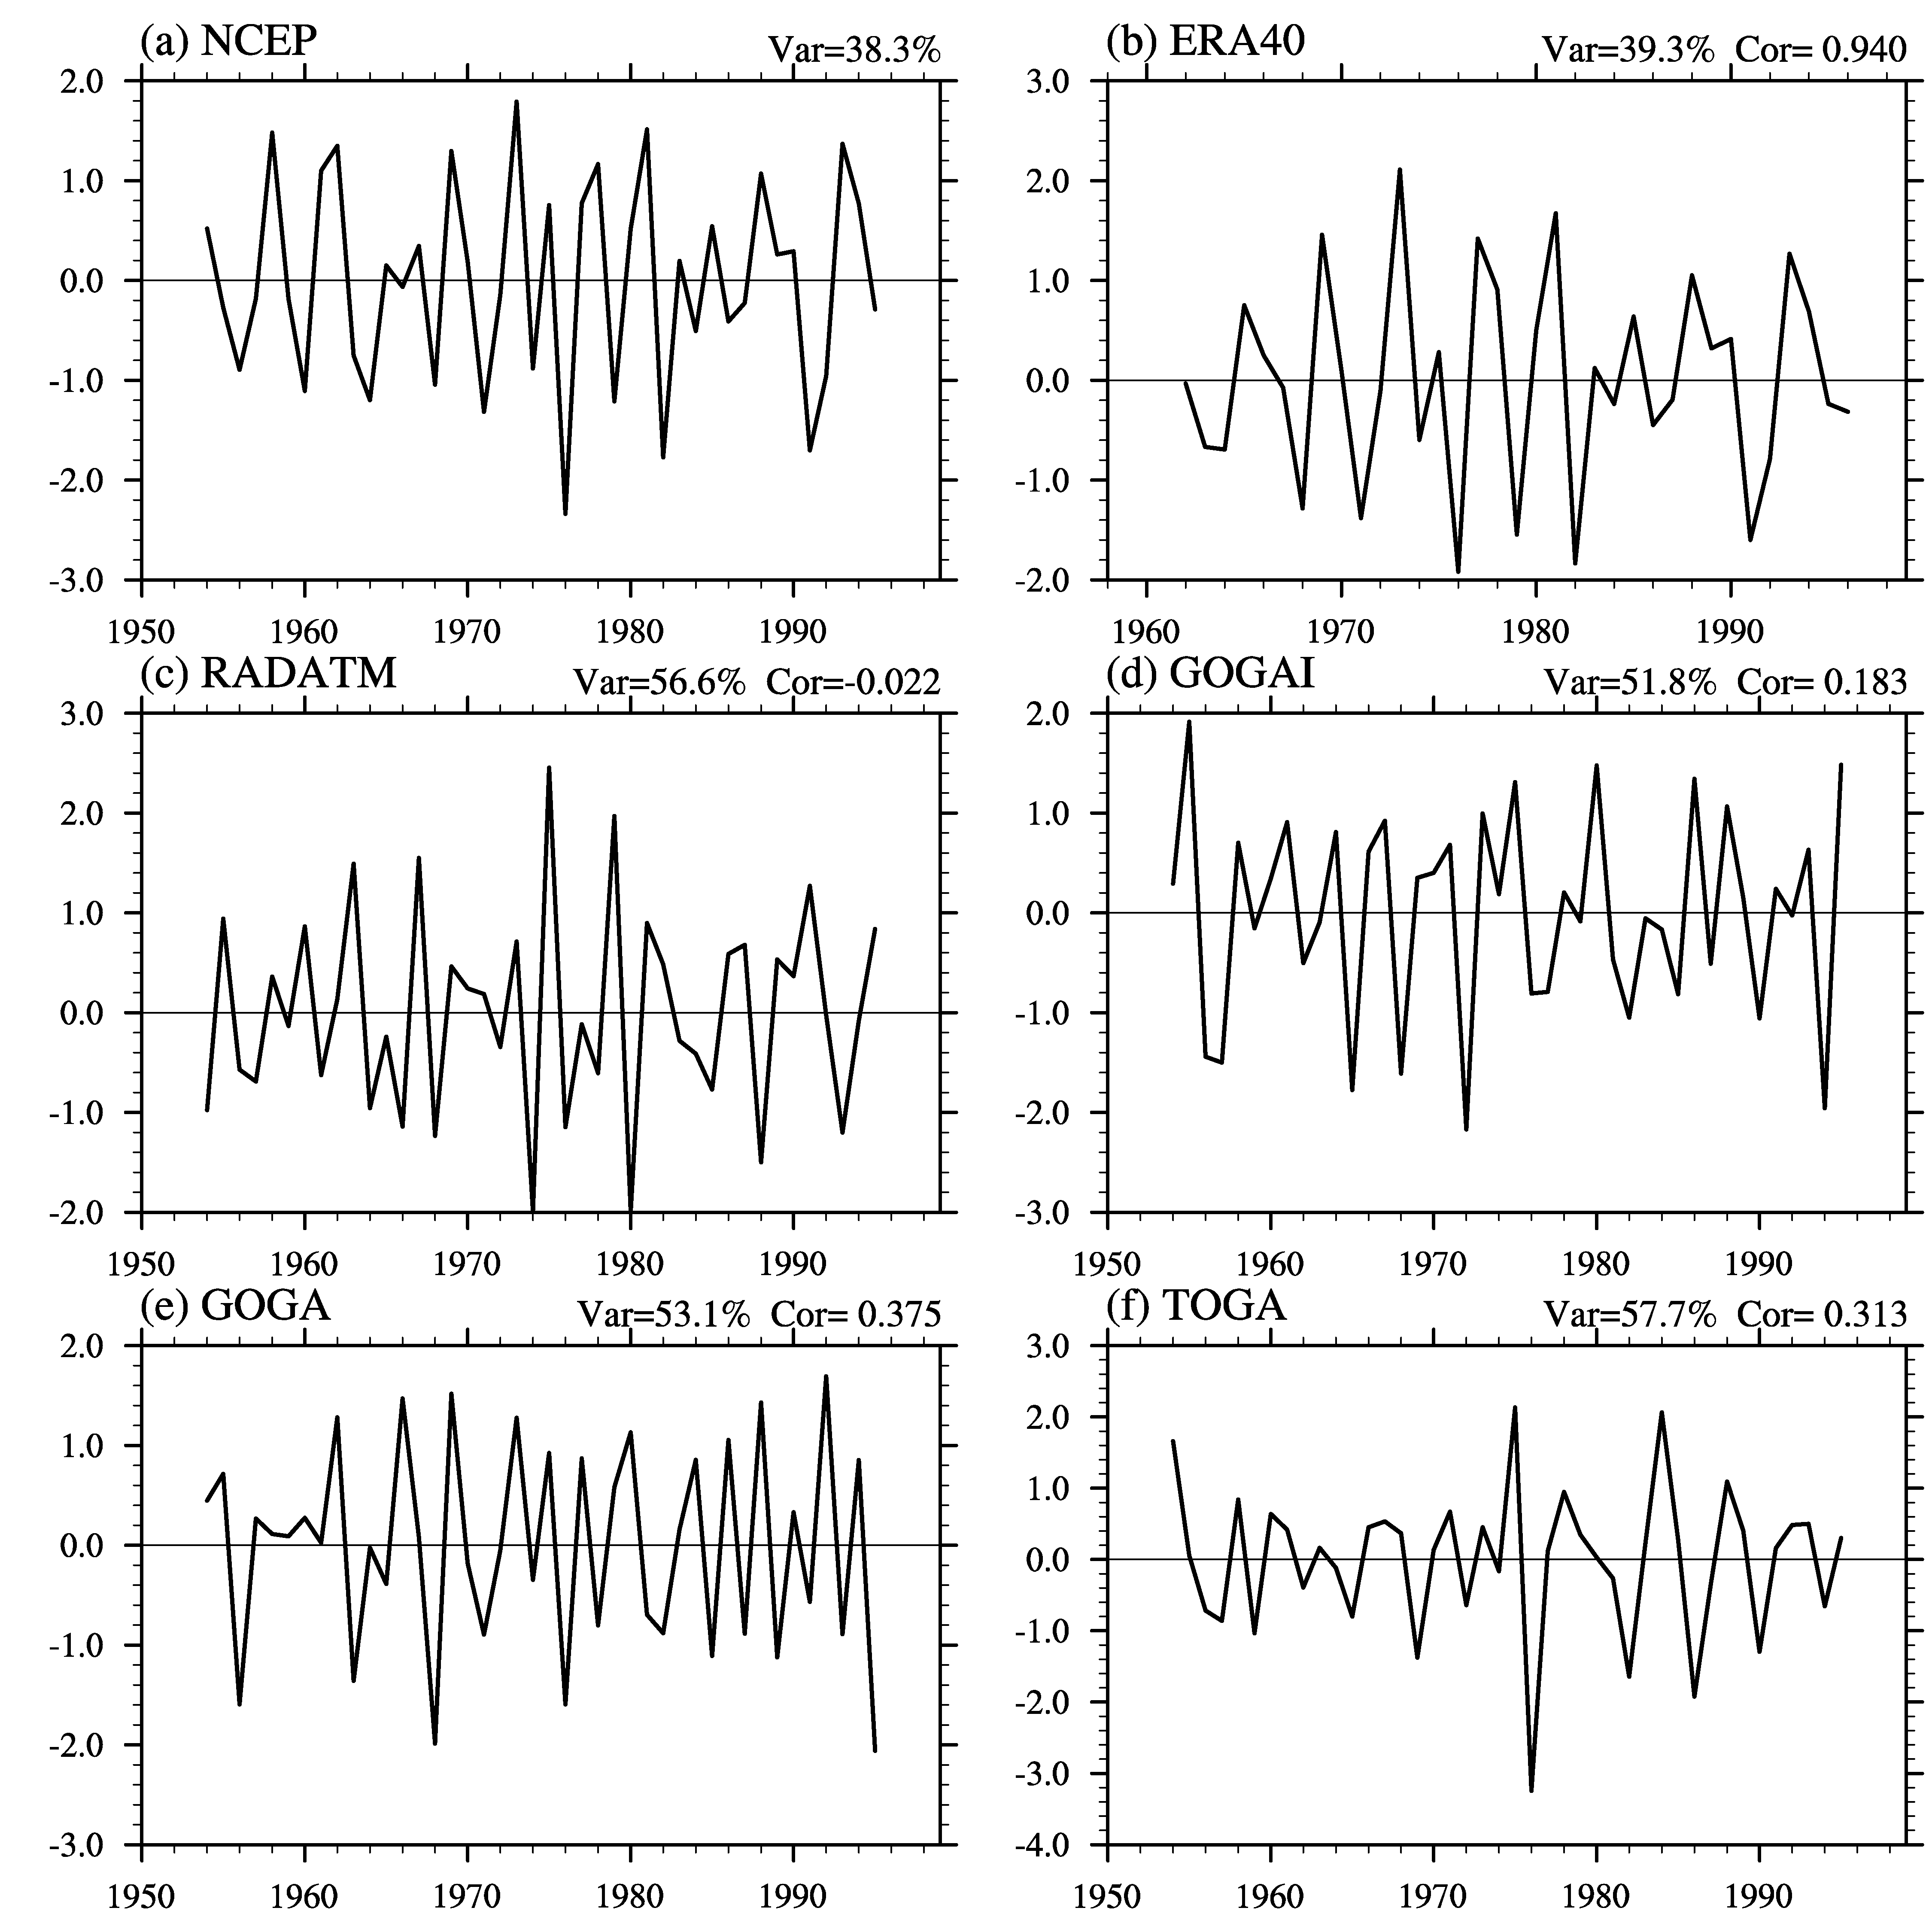
Interdecadal and Interannnual Variabilities of the Antarctic Oscillation Simulated by CAM3 |
|
XUE Feng
, SUN Dan |
| Figure 5 The corresponding time series of EOF1 in Fig. 4. The values above each subfigure indicate the variance explained by EOF1 and the correlation coefficient with a NCEP data. |
| |