Interdecadal and Interannnual Variabilities of the Antarctic Oscillation Simulated by CAM3
XUE Feng1  , SUN Dan
2, 3 , ZHOU Tian-Jun2
, SUN Dan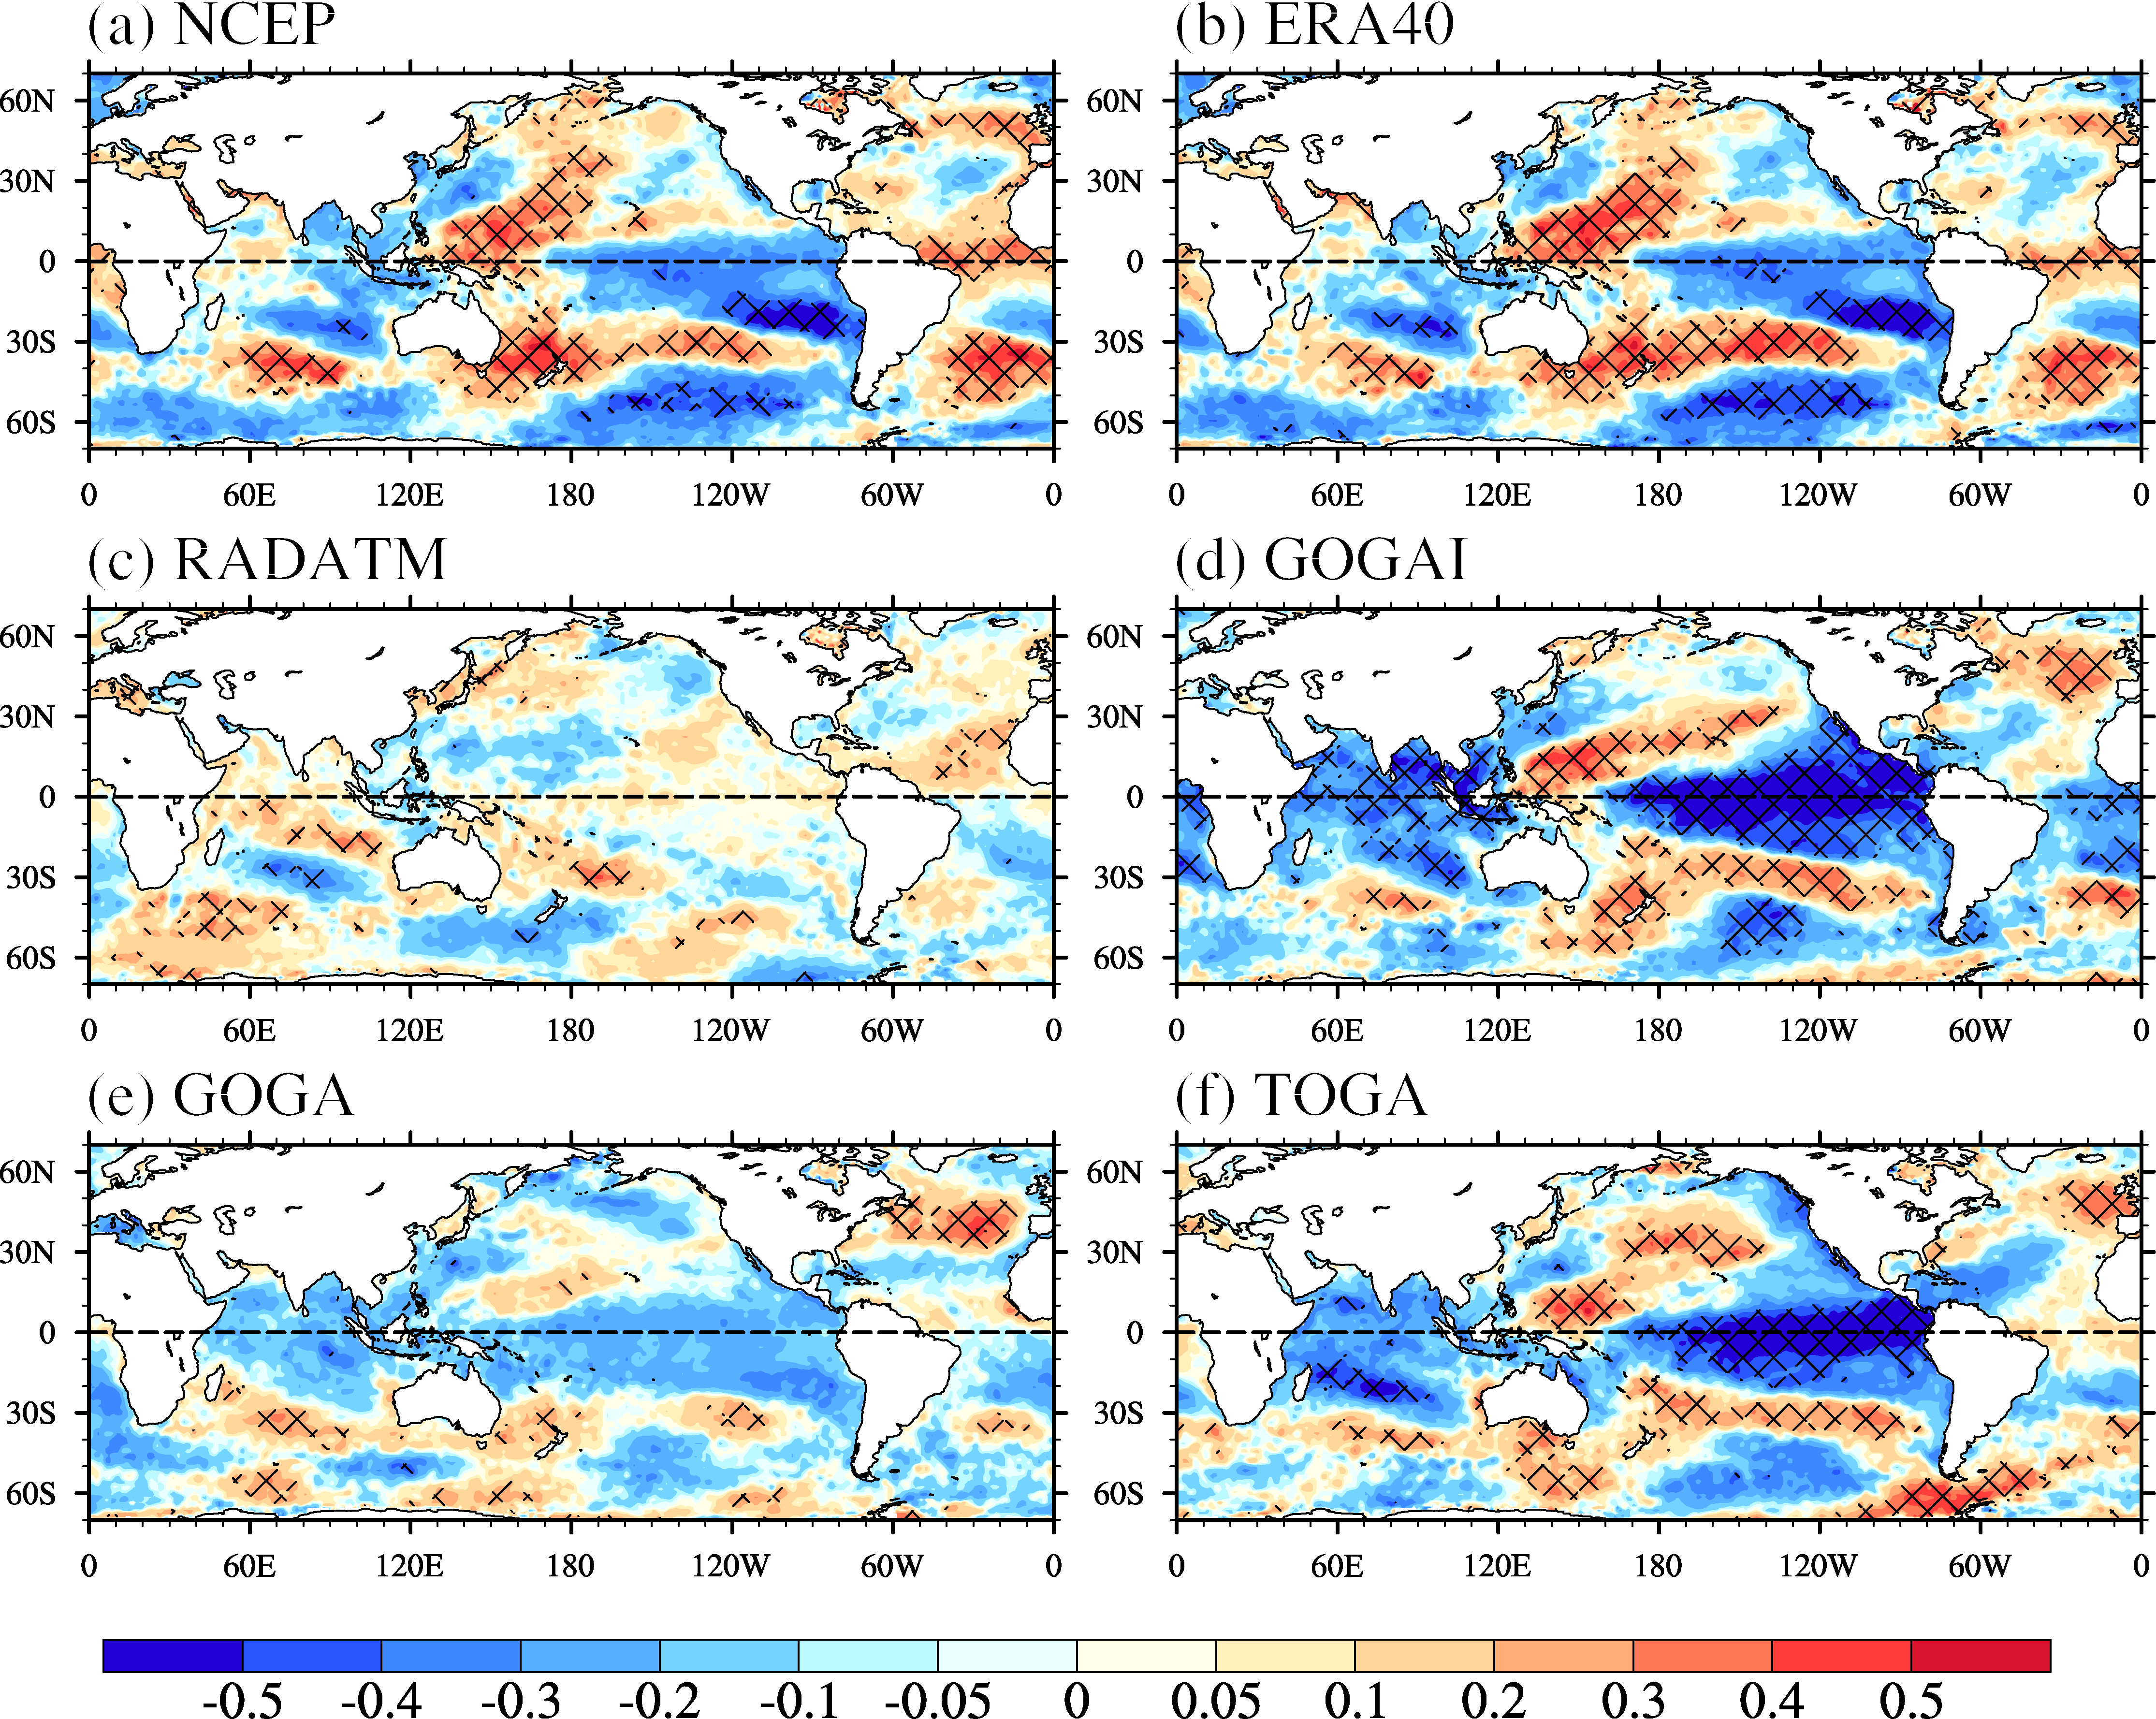
Interdecadal and Interannnual Variabilities of the Antarctic Oscillation Simulated by CAM3 |
|
XUE Feng
, SUN Dan |
| Figure 6 The correlation coefficient between the time series in Fig. 5 and SST in December-January-February. Regions above the 95% confidence level are marked with crosses. |
| |