Simulation of the Microphysical Processes and Effect of Latent Heat on a Heavy Rainfall Event in Beijing
[GUO Chun-Wei1, 2 , XIAO Hui1, *  , YANG Hui-Ling
1 , TANG Qi1, 2 ]
, YANG Hui-Ling|
|


An extraordinary rainstorm that occurred in Beijing on 21 July 2012 was simulated using the Weather Research and Forecasting model. The results showed that: (1) The two precipitation phases were based on a combination of cold cloud processes and warm cloud processes. The accumulated conversion amount and conversion rate of microphysical processes in the warm-area phase were all much larger than those in the cold front phase. (2) 72.6% of rainwater was from the warm-area phase. Rainwater mainly came from the melting of graupel and the melting of snow, while the accretion of cloud water by rain ranked second. (3) The net heating rate with height appeared as an overall warming with two strong heating centers in the lower and middle layers of the troposphere and a minimum heating center around the melting layer. The net heating effect in the warm-area phase was stronger than that in the cold front phase. (4) Warm cloud processes contributed most to latent heat release, and the thermal effect of cold cloud processes on the storm in the cold front phase was enhanced compared to that in the warm-area phase. (5) The melting of graupel and snow contributed most to latent heat absorption, and the effect of the evaporation of rainwater was significantly reduced in the cold front phase.
Microphysical processes play a very important role in cloud formation and development, thermal and dynamical processes, precipitation forms, and the surrounding large-scale circulation ( Yang and Houze, 1995; Zhu and Zhang, 2006). Therefore, it is of great significance to research these microphysical processes, in order to gain a better understanding of cloud and precipitation formation, and also improve the ability of precipitation prediction ( Cotton and Anthes, 1989; Huang and Xu, 1999; Straka, 2009). Research on precipitation microphysical processes began in the 1960s and 1970s ( Gu, 1980). Some studies have described how cold cloud processes, such as the melting of graupel and snow, are very important for the formation of precipitation ( Brown and Swann, 1997; Colle and Zeng, 2004). However, other research has also indicated that warm cloud processes, such as the autoconversion of cloud water into rain, could be the most important microphysical processes ( Li et al., 2002; Farley et al., 2004). Furthermore, cold and warm cloud processes have both been shown to play very important roles in precipitation in some studies ( Wang and Carey, 2007; Huang et al., 2014).
Latent heat produced during microphysical processes provides the cloud and precipitation with a significant heat source, and also affects the thermal and dynamical structure of cloud and precipitation distribution. Guo et al. (1999) simulated a strong storm occurred in Japan using a 3D cloud model and found that the formation of microbursts in the strong storm was the result of the cooling effect of the melting of graupel and evaporation of rain. Wang (2002) and Zhu and Zhang (2006) also found such a cooling effect influenced the rainbelt and downdraft in a hurricane. Wang et al. (2010) reported that greater latent heat release is unable to extend the lifespan of a storm. Li et al. (2013) found that, in typhoon ‘Hagupit’, the main heat release processes were condensation of water vapor into cloud water, and deposition of water vapor into snow and cloud ice. McGee and van den Heever (2014) focused on the effect of mixing of latent heat and air on tropical deep convection. Zheng and Chen (2014) discussed the effect of microphysical parameters on strong convective storms.
Beijing and its surrounding areas experienced a heavy rain event from 21 to 22 July 2012. A total of 79 people were killed and 1.9 million people across the city were affected. During this process, the mean rainfall amount was 170 mm, and the maximum rainfall amount reached up to 460 mm (from a hydrological station record) in Hebei Town in Fangshan district of Beijing city, which is the largest recorded amount in the last 61 years. The rainbelt had a southwest-northeast orientation and the precipitation process could be divided into two phases. The first phase, which we refer to as the warm-area precipitation phase, occurring ahead of the cold front, was characterized by convective precipitation with short-term heavy rain and significant volatility. The second phase was the cold front precipitation phase. There has been much research (both large- and meso-scale studies) conducted on this rainstorm ( Sun et al., 2012, 2013), but little attention has been paid to the microphysical processes and latent heat effect in the two precipitation phases. The present reported study used Weather Research and Forecasting (WRF) model simulations to address this knowledge gap.
This study employed the mesoscale WRF (Version 3.3.1) numerical model with the Betts-Miller-Janjic (BMJ) cumulus parameterization scheme and the Double-Moment 6-class (WDM6) microphysical scheme ( Lim and Hong, 2010). The simulation centered on Beijing (39.9°N, 116.38°E) with a running time from 2000 BST (Beijing Standard Time) 20 to 2000 BST 22 July 2012. The initial and boundary field data were all obtained from National Centers for Environmental Prediction (NCEP) 1° × 1° six-hourly data, with three layers of a two-way nested grid used. The parameters and related settings employed in the model are shown in Table 1.
| Table 1 Experimental design in the Weather Research and Forecasting model. |
WDM6 is a double-moment microphysical scheme and has a very detailed microphysical process. In order to gain a better understanding of the microphysical processes in this rainstorm, we enhanced the WRF model by adding the output of conversion amounts in the microphysical processes. In this way, evaporation, condensation, melting, sublimation, coagulation, and autoconversion processes could be easily analyzed. A detailed description of the microphysical processes can be found in the appendix.
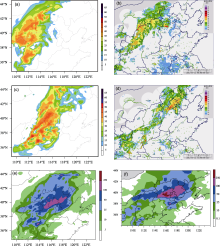
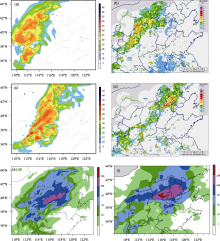
Figures 1a and 1b show a comparison of radar echo intensity between the simulation and observation at 1800 BST 21 July. Although the simulation results are a little larger than observations in terms of range and intensity, the location, shape, trend, and occurrence time of the radar echo structure between the simulation and observation are quite consistent. The pattern of simulated 24 h accumulated rainfall amount distribution also agreed well with the observation, both in shape and location of the rainbelt(Figs. 1c and 1d). Meanwhile, the simulated weather pattern field, relative humidity field, and mean surface temperature field were all similar to the observations. Overall, the simulations were in accordance with observations, indicating the simulation results were trustworthy and accurate.
 | Figure 1 Comparison of radar echoes at (a, b) 0800 and (c, d) 1800 BST 21 July (units: dBz) in the (a, c) simulation and (b, d) observation, and accumulated rainfall amount at 0800 21 July to 0800 BST 22 July (units: mm) in the (e) simulation and (f) observation. |
A region in the southwest part of Beijing (39.5-40°N, 115.5-116.2°E) where it rained most was chosen as the object of study. Cloud water and rain were mainly distributed in the middle-lower layers, while graupel, snow, and cloud ice were distributed in the middle-upper layers. Therefore, we were interested in how one type of hydrometeor converted into another type, which process was the most important, and what the formation mechanism of rainwater was in this precipitation process. We used the simulation results to analyze each of these problems.
The accumulated vertically integrated hydrometeor conversion amount was calculated and the results are shown in Table 2. The main microphysical processes in the two phases were the melting of graupel (gmlt), accretion of rain by graupel (gacr), accretion of snow by rain (racs), accretion of cloud water by rain (racw), condensation of water vapor into cloud water (cond), and the melting of snow (smlt). The two precipitation phases were based on a combination of cold cloud microphysical processes and warm cloud processes. The accumulated conversion amount (ACA) and conversion rate (ACR) of the main microphysical processes in the warm-area phase were much larger than those in the cold front phase, albeit to different degrees. For example, in the warm-area phase, the ACA of the melting of graupel (gmlt) was 3480.00 × 109 kg and the corresponding ACR was 348.00 × 10⁹ kg h-1. Meanwhile, those in the cold front phase were 1320.00 × 109 kg and 165.00 × 10⁹ kg h-1, which were 37.93% and 47.41% of those in the warm-area phase respectively.
| Table 2 Accumulated vertically integrated hydrometeor conversion amount contribution, and accumulated latent heat amount; contribution in the two phases (abbreviated name can be seen in Appendix). |
The results in Table 2 can also be used to analyze the sources of rainwater. The main sources of rain were the melting of graupel and snow (gmlt, smlt) and the accretion of cloud water by rain (racw). The total ACA of the melting of graupel (gmlt) accounted for around 71% of the total rainwater source amount, while that of the accretion of cloud water by rain (racw) and the melting of snow (smlt) both accounted for 13%, and other processes accounted for 3%. The total ACA into rain and the total ACA of warm cloud precipitation processes in the cold front precipitation phase were only 37.78% and 35.43% of those in the warm-area phase respectively, which indicated the importance of warm cloud processes decreased in the cold front phase. In general, cold cloud processes contributed the most to rainwater production in the two phases in the southwest part of Beijing, with a contribution of 87%-88%. Further calculation indicated that 72.6% of the total rainwater came from the warm-area phase and 27.4% from the cold front phase.
In order to gain a clear idea of the diabatic effect in the precipitation process, microphysical processes were divided into two categories, with and without phase changes. The processes with phase changes included latent heat release processes (warming processes), which warm the air, and latent heat absorption processes (cooling processes), which cool the air. Warming processes included condensation, accretion, freezing, desublimation, and nucleation. Cooling processes included evaporation, melting, and sublimation. According to the model results, the diabatic warming, cooling, and net heating rate ( Rw, Rc, Rt) were calculated using the method described in Hjelmfelt et al. (1989) and Guo et al. (1999), as follows: Rw = ( Lv/ Cp) × ( pcond(+) + prevp(+)) + ( Lf/ Cp) × ( pihmf
+ pihtf + pgfrz + pgacr + psacr + piacr + pgacw + psacw)
+ ( Ls/ Cp) × ( pgdep(+) + psdep(+) + pidep(+) + pigen) , Rc = ( Lv/ Cp) × ( pcond(-) + prevp(-) + pgevp + psevp)
+ ( Lf/ Cp) × ( psmlt + pgmlt + pimlt + pseml + pgeml)
+ ( Ls/ Cp) × ( pgdep(-) + psdep(-) + pidep(-)) , Rt = Rw + Rc .
The variables Lv, Lf , and Ls represent the latent heat constant of evaporation, melting, and sublimation, respectively. Cp represents wet air specific heat at constant pre-ssure. The conversion rate of each microphysical process is represented by p followed by the abbreviated name (i.e., pcond, prevp, etc.) (units: kg kg-1 s-1).
Figures 2a and 2b show the vertical structure of the latent heating rate during the two phases. In the warm-area phase (Fig. 2a), the warming effect (“warm” curve)
 | Figure 2 Regional average vertical structure of latent heating rate (units: °C h-1) in the (a) warm-area phase and (b) cold front phase. |
appeared throughout the troposphere, with a maximum warming rate of 2.6°C h-1 and 2.8°C h-1 at the height of 3 km and 4.5 km respectively. The processes of condensation of water vapor into cloud water (cond) and accretion of rain by graupel (gacr) contributed most to the warming effect. The condensation of water vapor into cloud water (cond) presented a similar trend as the “warm” curve, and the accretion of rain by graupel (gacr) appeared at only around 4-6 km (melting layer). In the middle-upper layers, the warming effect mainly came from the desublimation of water vapor into graupel and snow (gdep, sdep) and the nucleation of water vapor into cloud ice in the deposition nucleus (igen). The cooling effect appeared under 6 km, with a maximum cooling rate of -2.8°C h-1 at the height of 4.5 km (“cool” curve). Figure 2a also shows that the two major contributors to the cooling effect were the melting of graupel and snow (gmlt, smlt), and that they had a consistent trend with the “cool” curve. Under the cloud in the lower layers, the cooling effect of evaporation of rainwater (revp) dominated. Overall, it presented a net warming (“total” curve) throughout the whole layer. Two net heating centers were at 2.5 km and 6 km, with a net heating rate of 2.2°C h-1 and 1.4°C h-1 respectively. The melting of ice particles around the melting layer decreased the warming effect.
Figure 2b shows that the net heating curve ("total" curve) in the cold front phase was similar to that in the warm-area phase. Two net heating centers were apparent at 3 km and 6 km, with net heating rates of 1.3°C h-1 and 1.2°C h-1respectively. A weak cooling effect apparent around the melting layer was the result of the melting of ice particles. The evaporation of rainwater was not obvious this time because the previous heavy precipitation increased the relative humidity in the lower layers and weakened evaporation.
In conclusion, the warming and cooling rate in the two phases possessed similar trends of change. The latent heat effect in the warm-area phase was more obvious than that in the cold front phase. This vertical structure of latent heat was conducive to the maintenance of updraft and the development of cloud, and thus the development of convective cloud was stronger in the warm-area phase than in the cold front phase.
| Table Appendix-Description of microphysical processes |
3.3.1 Latent heat release
Table 2 shows the accumulated vertically integrated latent heat release amount and contribution of each process in the two phases. In the warm-area phase, the condensation of water vapor into cloud water (cond) and the accretion of rain by graupel (gacr) were the two processes able to release the most heat. The corresponding accumulated latent heat release amounts (ALHRA) were 16.53 × 10¹⁷J and 2.86 × 10¹⁷J (corresponding latent heat release rates: 1.65 × 10¹⁷ J h-1 and 0.29 × 10¹⁷ J h-1). Analyses indicated that, although the ACA of the condensation of water vapor into cloud water (cond) accounted for 35.66% of the total ACA of the heat releasing processes, the corresponding ALHRA accounted for 77.35% of the total ALHRA. Although the ACA of the accretion of rain by graupel (gacr) accounted for 46.12% of the total ACA of the latent heat releasing processes, the corresponding ALHRA accounted for 13.37%. The other cold cloud processes accounted for 19.22% of the total ACA but only 9.28% of the total ALHRA. These results indicate that, in the warm-area phase, the major contributor to latent heat release was warm cloud processes, with only 35.66% of the total ACA but 77.35% of the total ALHRA. Cold cloud processes accounted for 64.34% of the total ACA but only 22.65% of the total ALHRA.
In the cold front phase, the condensation of water vapor into cloud water (cond) and the accretion of rain by graupel (gacr) were still the two processes able to release the most heat. Their ALHRAs were 5.33 × 10¹⁷J and 1.58 × 10¹⁷J (corresponding latent heat release rates: 0.67 × 10¹⁷J h-1and 0.20 × 10¹⁷ J h-1) respectively. Although the ACA of the condensation of water vapor into cloud water (cond) accounted for 24.65% of the total ACA of the heat releasing process, the corresponding ALHRA accounted for 66.56%. Although the ACA of the accretion of rain by graupel (gacr) accounted for 54.85% of the total ACA of the heat releasing processes, the corresponding ALHRA accounted for 19.79%. These results indicate that, in the cold front phase, warm cloud processes were still the major latent heat release processes, accounting for 66.56% of the total ALHRA. Compared to the results for the warm-area phase, the heat release contribution of warm cloud processes was about 11% less, but that of cold cloud processes was 11% more in the cold front phase. The increase of latent heat release in the cold cloud processes indicates the importance of thermal effects of cold cloud processes on the development of rainstorm cloud was enhanced.
3.3.2 Latent heat absorption
Table 2 also shows that the most important latent heat absorption process was the melting of graupel (gmlt). The melting of snow (smlt) ranked second. The ACAs of the above two processes were 3480.00 × 109kg and 600.00 × 10⁹ kg respectively (83.95% and 14.51% respectively of the total ACA of the latent heat absorption processes). The corresponding accumulated latent heat absorption amounts (ALHAA) were 11.62 × 10¹⁷J and 2.00 × 10¹⁷J respectively (79.07% and 13.87% respectively of the total ALHAA). The evaporation of rain led to a 32.00 × 10⁹ kg reduction of rain (0.77% of the total ACA of the latent heat absorption processes), and the corresponding ALHAA was 0.80 × 10¹⁷J (5.44% of the total amount). On the whole, in the warm-area phase, cold cloud processes were the main processes of latent heat absorption, with the melting of graupel and snow (gmlt, smlt) the most obvious, and the contribution of warm cloud processes accounted for only 5.44% of the total ALHAA.
In the cold front phase, cold cloud processes were still the main processes of latent heat absorption, with melting of graupel and snow the most obvious. The ALHAA of the evaporation of rain accounted for only 0.61% of the total amount, indicating the contribution of warm cloud microphysical processes was markedly reduced compared to that in the warm-area phase.
This study used the WRF model to simulate a heavy rainstorm that occurred on 21 July 2012 in Beijing. The key conclusions can be summarized as follows:(1) The main microphysical processes in the two phases were cold cloud processes, while warm cloud processes were supplemental. The accumulated conversion amount and conversion rate in the warm-area phase were much larger than those in the cold front phase.
(2) In the whole precipitation process, 72.4% of the total rainwater came from the warm-area phase and only 27.6% from the cold front phase. Rainwater mainly came from cold cloud processes and little contribution was made by warm cloud processes. The main source of rainwater was the melting of graupel (gmlt) (73% of the total rainwater source amount). The accretion of cloud water by rain (racw) and the melting of snow (smlt) ranked second, both accounting for 13%.
(3) The warming and cooling rate in the two phases possessed similar trends of change, with two net heating centers at around 3 km and 6 km height and a minimum net warming rate around the melting layer for the melting of ice particles. The vertical structure of latent heat was conducive to the maintenance of updraft and the development of cloud. The latent heat effect in the warm-area phase was more obvious than that in the cold front phase.
(4) In the two phases, the major contributors to latent heat release were warm cloud processes. In the warm-area phase, warm cloud processes contributed 77.35% to the total accumulated latent heat release amount, while the contribution in the cold phase was 66.56%. The increase of latent heat release in the cold cloud processes (from 22.65% to 33.44%) indicated that the importance of thermal development of cloud contributed by cold cloud was enhanced.
(5) Cold cloud processes were the main processes of latent heat absorption, with the melting of graupel and snow (gmlt, smlt) the most obvious in the two phases. The latent heat absorption contribution of warm cloud processes was very small and mainly came from the evaporation of rainwater. However, the latent heat effect of the evaporation of rainwater (revp) was significantly reduced in the cold front phase compared to the warm-area phase.
Acknowledgements. This work was partially supported by the National Basic Research Program of China (973 Program, Grant Nos. 2013CB430105 and 2014CB441403), the National Natural Science Foundation of China (Grant No. 41205099), Guizhou Province Scientific Research Joint Project (Grant No. G[2013]4001), and the Special Scientific Research Project of Meteorological Public Welfare Profession of China (Grant No. GYHY201006031).
| 1 |
|
| 2 |
|
| 3 |
|
| 4 |
|
| 5 |
|
| 6 |
|
| 7 |
|
| 8 |
|
| 9 |
|
| 10 |
|
| 11 |
|
| 12 |
|
| 13 |
|
| 14 |
|
| 15 |
|
| 16 |
|
| 17 |
|
| 18 |
|
| 19 |
|
| 20 |
|
| 21 |
|
| 22 |
|