A Case Study of Impact of FY-2C Satellite Data in Cloud Analysis to Improve Short-Range Precipitation Forecast
[LIU Rui-Xia1  , CHEN Hong-Bin
2 , CHEN De-Hui3 , XU Guo-Qiang3 ]
, CHEN Hong-Bin|
|


Chinese FengYun-2C (FY-2C) satellite data were combined into the Local Analysis and Prediction System (LAPS) model to obtain three-dimensional cloud parameters and rain content. These parameters analyzed by LAPS were used to initialize the Global/Regional Assimilation and Prediction System model (GRAPES) in China to predict precipitation in a rainstorm case in the country. Three prediction experiments were conducted and were used to investigate the impacts of FY-2C satellite data on cloud analysis of LAPS and on short range precipitation forecasts. In the first experiment, the initial cloud fields was zero value. In the second, the initial cloud fields were cloud liquid water, cloud ice, and rain content derived from LAPS without combining the satellite data. In the third experiment, the initial cloud fields were cloud liquid water, cloud ice, and rain content derived from LAPS including satellite data. The results indicated that the FY-2C satellite data combination in LAPS can show more realistic cloud distributions, and the model simulation for precipitation in 1-6 h had certain improvements over that when satellite data and complex cloud analysis were not applied.
It is well known that absence or improper initialization of clouds, humidity, and precipitation in addition to related thermodynamical and dynamical features in the initial condition of the Numerical Weather Prediction (NWP) model will cause the spin-up problem, which shows as a significant delay in the development of clouds and precipitation at the early stage of a model forecast ( Chang et al., 2000).
Diabatic and physical initializations by using satellite observations were developed to eliminate the spin-up problem ( Krishnamurti et al., 1984, 1991; Turpeinen et al., 1990; Raymond et al., 1995; Harms et al., 1993; Yucel and Shuttle, 2000).
In the 1980s, the Earth System Research Laboratory of National Oceanic and Atmospheric Administration (NOAA ESRL) developed a three-dimensional (3D) analysis system known as the Local Analysis and Prediction System (LAPS) for NWP initialization to eliminate the spin-up problem of the NWP model. LAPS is an integrated system that ingests and analyzes meteorological data from different observational sources to derive the surface and 3D fields of cloud, temperature, pressure, humidity, and wind. Other analysis systems such as Gridpoint Statistical Interpolation (GSI) and Advanced Regional Prediction System (ARPS) were later developed. Diabatic initialization research of the NWP model based on these 3D analysis systems proved that diabatic initialization can provide significant improvement in convective-scale precipitation forecasts over the cold start method ( Hu and Xue, 2007; Zhang, 1999; Yan et al., 2006; Sheng et al., 2006; Etherton and Santos, 2005; Jian et al., 2003; Shaw et al., 2003; Alberoni et al., 2000; Christopher, 2006).
In this research, Chinese FengYun-2C (FY-2C) satellite data was combined into LAPS to create 3D cloud analysis, which was used to create diabatic initialization grids for initialization of the Global/Regional Assimilation and Prediction System (GRAPES) model by using a case of 2008 heavy rain in China. Section 2 describes the models, case selection, data, and numerical experiments. Section 3 describes the results, and conclusion is given in section 4.
The analysis system used in this paper is LAPS, which was developed by NOAA ESRL ( Albers et al., 1996) to provide the capability for initializing mesoscale numerical weather prediction models with clouds and precipitation present in the initial conditions to eliminate spin-up problem. It is a diagnostic tool and can combine various data including conventional observation, radar, satellite, and airplane to produce high-resolution 3D analyses of the atmosphere and clouds centered on a domain of the user's choosing.
We used GRAPES prediction model, which was developed by the China Meteorological Administration ( Chen et al., 2008; Zhang and Shen, 2008). This model is a new-generation unified global and regional multiscale numerical model with horizontal resolution of 100 km to 1 km that combines weather and air quality forecast models. The version used in this study is GRAPES version 3, which has resolutions of 15 km horizontally and 32 layers vertically. We used the National Centers for Environmental Prediction (NCEP) Global Forecast System (GFS) data as background. The NCEP-5 class microphysics scheme, Betts-Miller-Janjic convection parameterization scheme, medium-range forecast (MRF) boundary layer scheme, Dudhia shortwave radiation scheme, rapid radiative transfer model (RRTM) longwave radiation scheme, and slab land-surface process options were used.
We conducted a numerical analysis of a rainstorm that occurred over southeastern China during 12-14 June 2008. This rainstorm affected more than 10 provinces including Yunnan, Guangxi, Hunan, Jiangxi, and Guangdong provinces, and property damage was extensive. More than 250 mm of precipitation was recorded, which fell mainly during 12-13 June. In this study, our domain covered 15-33°N, 105-128°E, which includes approximately 13 provinces.
LAPS Cloud Analysis used the NCEP GFS forecast data as background which is recorded four times daily with a forecast intervals of 3 h and a space resolution of 1° × 1°. The surface observations are from conventional meteorological stations with observation intervals of 3 h. The sounding data, which is from the China Meteorological Administration, is observed twice a day at 0000 and 1200 UTC with 11 vertical levels. With a focus on the storm-affected areas in southeastern China in 2008, this study employed 12 Doppler weather radar raw datasets in the study domain, with an observation frequency of 6 min. The processing of the radar and the conventional and sounding data in this study has been previously reported by Li et al. (2008).
In this study, Chinese FY-2C satellite data was combined with the LAPS model. The FY-2C satellite is the first operational geosynchronous meteorological satellite in China and is located at 105°E. Its visible infrared spin scan radiometer (VISSR) instrument is a five-channel device with a visible channel (0.55-1.05 µm), infrared (IR) channels (10.5-12.5 µm; 11.5-12.5 μm), a water vapor channel (6.3-7.6 µm), and a near-infrared channel (3.5-4.0 μm). The spatial resolution at the sub-point of the image is 1.25 km for the visible channel and 5 km for the infrared and water vapor channels. The brightness temperature of IR and near-infrared channels and the albedo from the visible channel were used in this study. Because the data previously used by the LAPS was from the Geostationary Operational Environmental Satellite (GOES), and the format and the calibration/navigation method differ significantly from those of the China FY-2C satellite, mod-ifications were made to the combined satellite channel data.
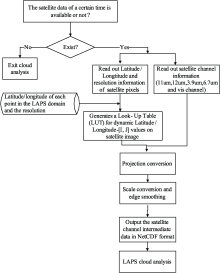
The FY-2C satellite data used was operationally preprocessed for calibration and navigation at the National Satellite Meteorological Center (NSMC) with strict quality control. Figure 1 shows the processing flow of satellite data in LAPS.
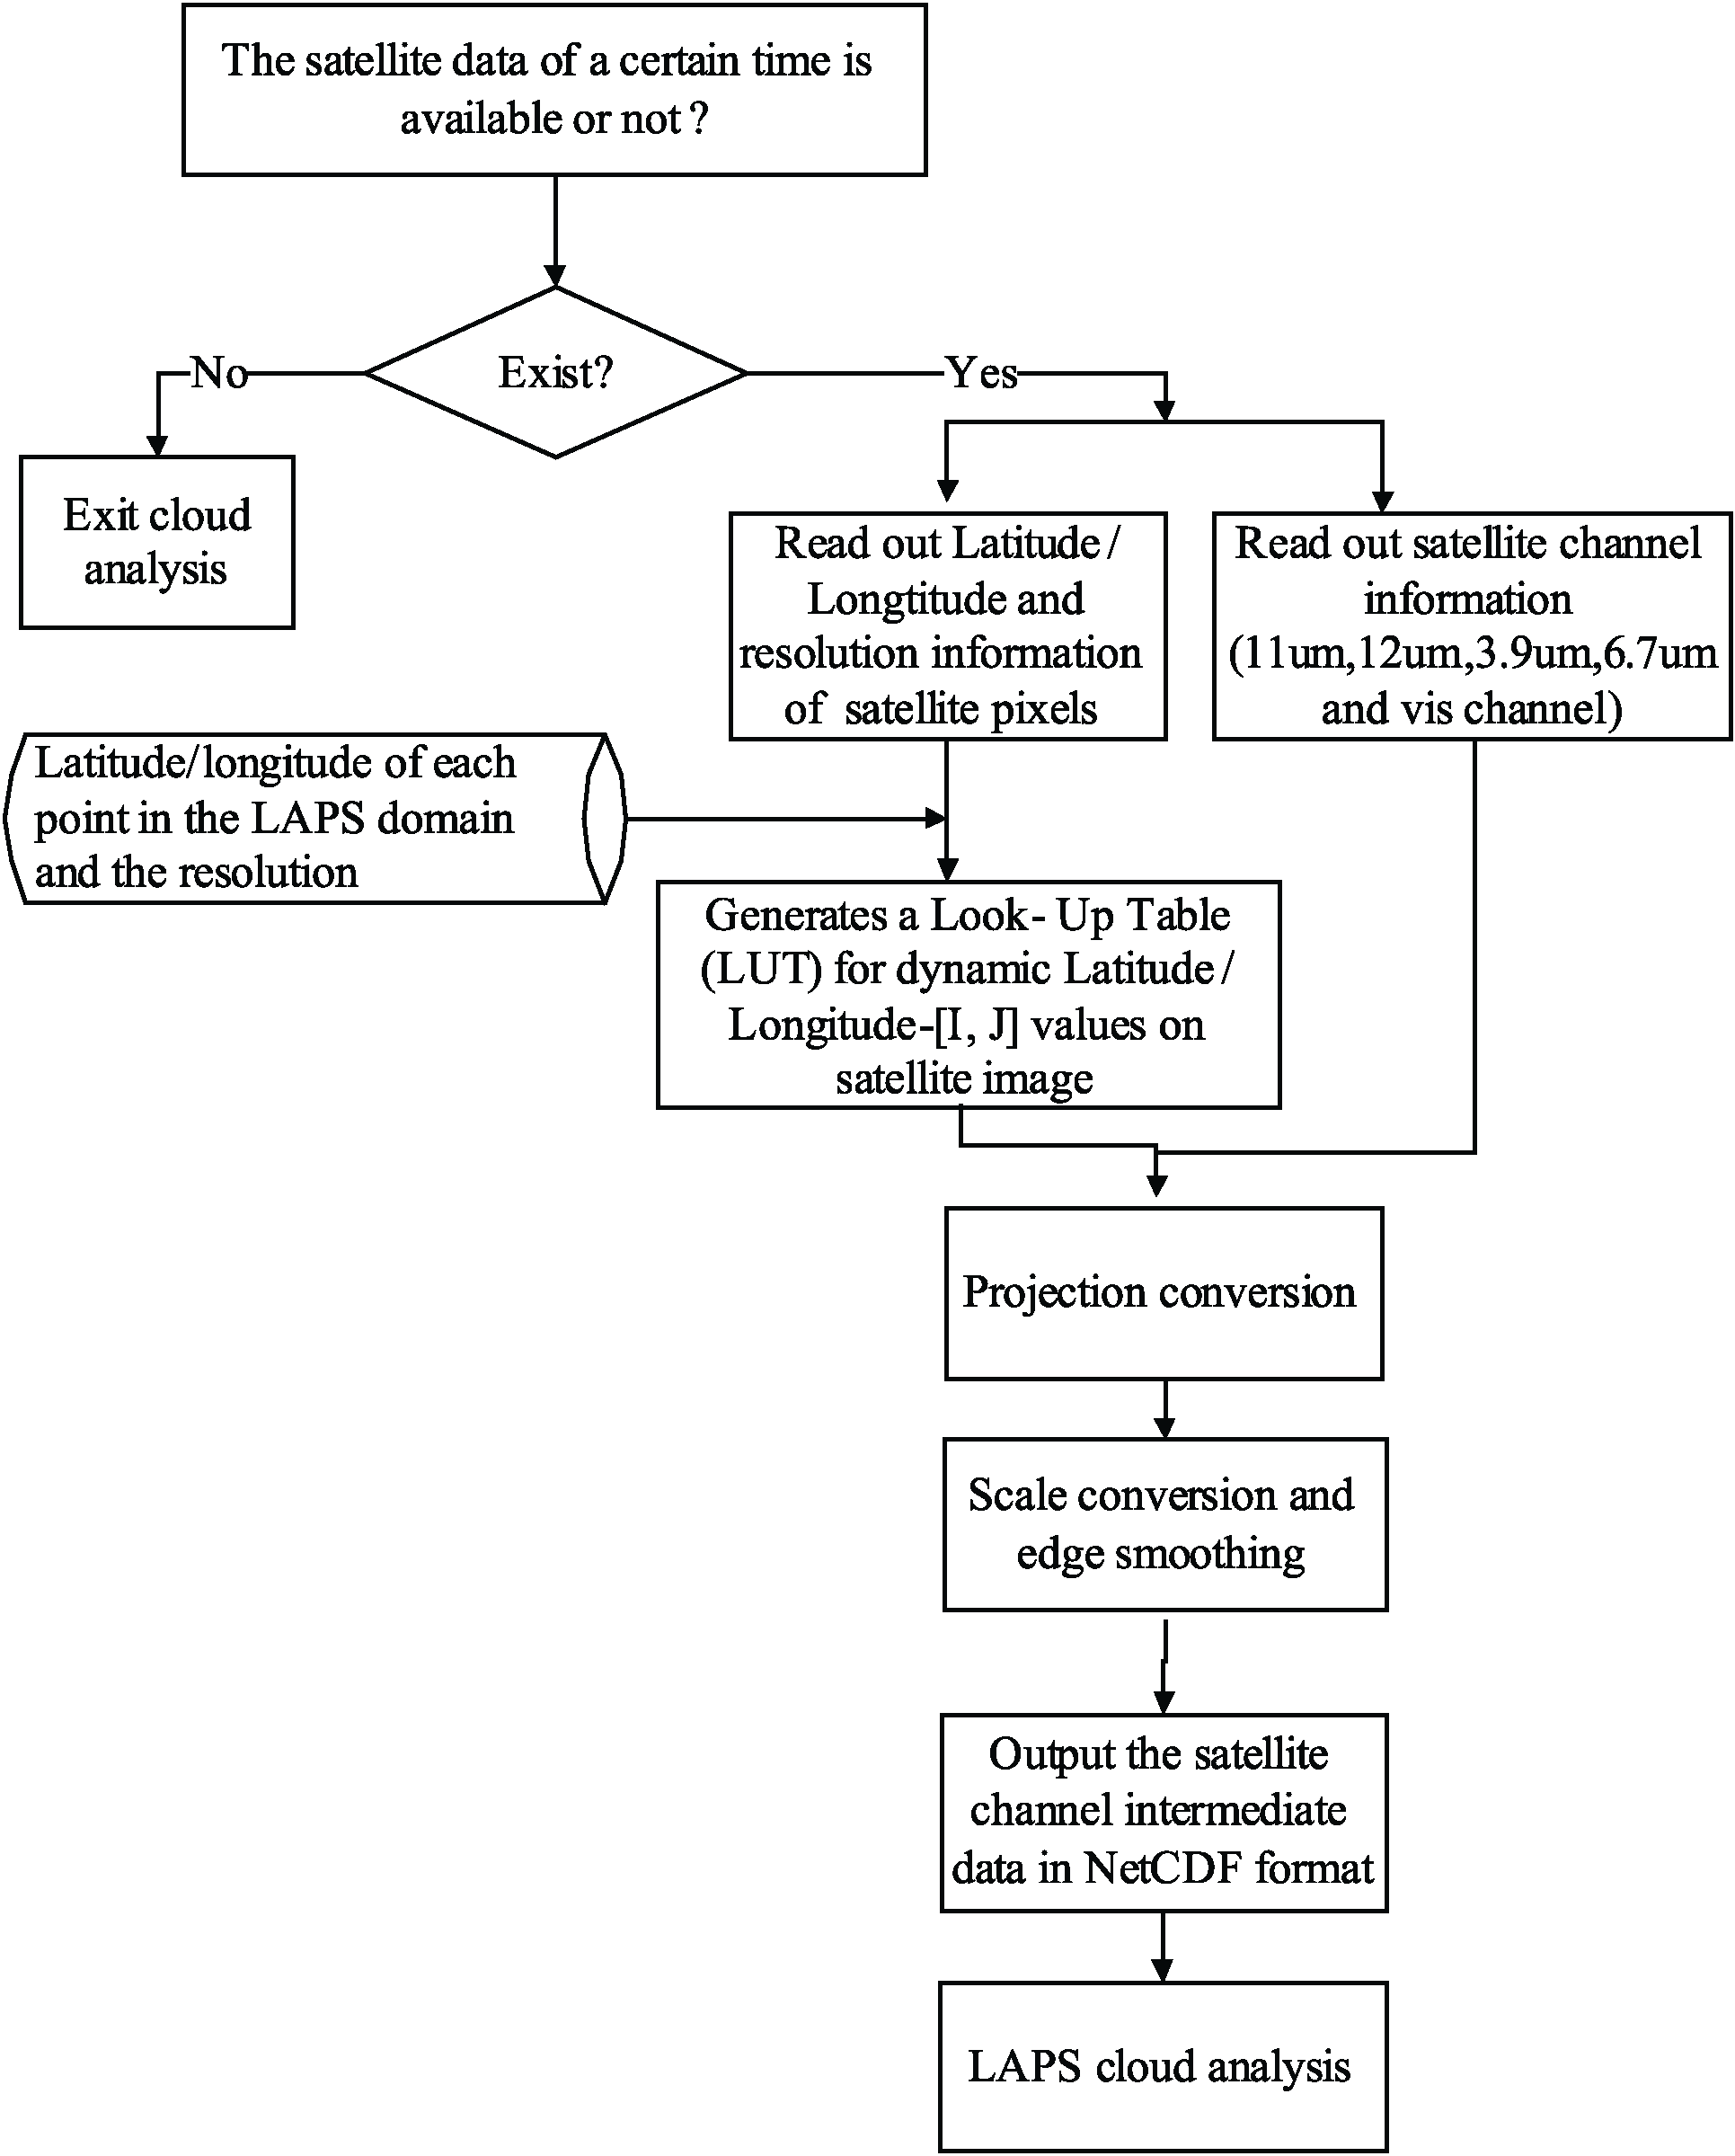 | Figure 1 Processing flow of satellite data in the Local Analysis and Prediction System (LAPS). |
The process is outlined as follows: First, determine whether the satellite data of a certain time is available. If it is not available, then exit the satellite data combination module; otherwise, enter the satellite data processing flow. The satellite channel data and geographic information are then processed for localization and projection conversion for the domain in the study. Based on the latitude/longitude of each point in the LAPS domain and the resolution, the localization and projection conversion process calculates its corresponding position on satellite images (known as ( I, J) values), and generates a look-up table (LUT) for dynamic latitude/longitude and ( I, J) values on the satellite image. The data from all channels of FY-2C are then projected on the LAPS grid based on LUT. Scale conversion and edge smoothing are then processed, and the satellite channel intermediate data in NetCDF format is output for cloud analysis in LAPS.
Two cloud analysis schemes of LAPS were first applied to obtain 3D cloud ice, cloud liquid water, and rain content. The two schemes include Scheme 1, which combines FY-2C satellite data, and Scheme 2, which does not combine FY-2C satellite data.
Then 3D cloud ice, cloud liquid water, and rain content obtained from LAPS analysis were used as the initial field of the GRAPES model to simulate precipitation by using the nudging method. Three forecast experiments were performed to estimate the role of FY-2C data in forecas-ting, the parameters of which are shown in Table 1.
| Table 1 Forecast experiments. |
The three experiments are outlined as follows:Cold Experiment: Zero initial values of cloud and rain parameters in the GRAPES model.
Hot-nosat Experiment: Data of cloud liquid water, cloud ice, and rain content analyzed by LAPS used as the initial field for the GRAPES numerical model, within which LAPS was not combined with FY-2C satellite data.
Hot-sat Experiment: Data of cloud liquid water, cloud ice, and rain content analyzed by LAPS used as the initial field for GRAPES, within which LAPS was combined with FY-2C satellite data.
All experiments were performed over 24 h and began at 0000 UTC 13 June 2008. The forecast interval was 1 h.
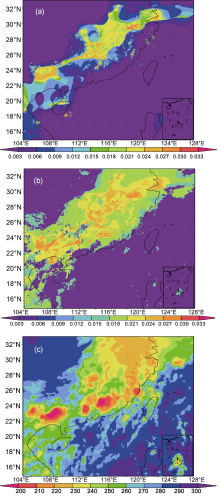
Figures 2a-b show the distribution of integrated cloud liquid water, cloud ice, and rain content at 0000 UTC 13 June 2008, obtained from LAPS cloud analysis. Figure 2a shows the case in which FY-2C data was not included (analysis Scheme 2); Figure 2b shows that including FY-2C data (analysis Scheme 1). Figure 2c is satellite infrared image obtained at the same time.
 | Figure 2 Distribution of integrated cloud liquid water, cloud ice, and rain content from LAPS analysis and a satellite infrared image obtained at 0000 UTC 13 June 2008: (a) No FY-2C data was used; (b) FY-2C data was included; (c) satellite infrared image. |
Figure 2 shows a region of high cloud coverage and rain content along the southwest-northeast direction over southern China. When satellite data was not combined with LAPS, this region was relatively narrow (Fig. 2a) and is distributed near Guangxi, Hunan, Jiangxi, and Zhejiang after ingestion of FY-2C data (Fig. 2b), the entire region of southeastern China, including Guangxi, Guangdong, Hunan, Jiangxi, Fujian, and Zhejiang, was covered by clouds. The cloud distributions over southeastern China are more consistent with the satellite observations (Fig. 2c); therefore, FY-2C satellite data combined with LAPS can provide more realistic cloud distribution.
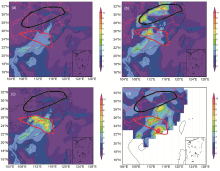
Figure 3 shows a 1 h precipitation distribution in sou-theastern China, where Fig. 3a is from the GRAPES cold start experiment, Fig. 3b is from the Hot-nosat experiment with no satellite data in the initial field of the GRAPES model, Fig. 3c is from the Hot-sat experiment in which combined satellite data is used as the initial field of the GRAPES model, and Fig. 3d is rain gauge observation. The rain gauge data is from hourly observations of the China Meteorological Administration that includes 2684stations within the study domain. Figures for other times were omitted.
 | Figure 3 One-hour precipitation distribution from three numerical experiments at 0000 UTC 13 June 2008: (a) Cold start experiment; (b) Hot-nosat experiment; (c) Hot-sat experiment; (d) rain gauge observation. |
Figure 3a shows that 1 h precipitation simulated in the cold start experiment mainly occurred in south Guangxi, Guangdong, south Hunan, and Jiangxi with an intensity of less than 5 mm, which is remarkably weaker than the actual observations results of the gauges (Fig. 3d). In the hot start experiments (Figs. 3b-c), intense precipitation appeared at the early stage of model integration. In the Hot-sat experiment, the precipitation was also simulated in the areas of south Guangxi, Guangdong, south Hunan, and south Jiangxi. A high precipitation value area appeared in south Hunan, south Jiangxi, and north Guangdong with precipitation over 10 mm (red outline in the figures). This area of high precipitation value was actually shown by rain gauge observation (Fig. 3d); therefore, the precipitation distribution obtained by the Hot-sat experiment is more consistent with that in the actual observations than that in the cold start experiment. The Hot-nosat experiment results also show precipitation in south Guangxi, Guangdong, south Hunan, and south Jiangxi, which is consistent with the results of the actual rain gauge observation and the Hot-sat experiment. However, an additional area of intense precipitation appeared in north Hunan, south Hubei, and northwest Anhui (black outline in the figures) with maximum precipitation of 8 mm, which was not shown in Hot-sat experiment and rain gauge observation. Therefore, the precipitation in this area is remarkably excessive by the Hot-nosat experiment. In addition, an area of high precipitation centered on eastern Guangdong in actual observation was remarkably weak in the Hot-nosat experiment but was shown in the Hot-sat experiment.
There was a rain center in the north of Jiangxi province in real observations (Fig. 3d), but the 1-h simulations in all these three experiments do not show this rain center due to prediction error of the model.
So, GRAPES simulated less precipitation in 1 h in the cold start experiment. With the Hot-nosat experiment GRAPES overestimated the 1 h precipitation extent in Hubei and Anhui and showed less rainfall in eastern Guangdong, and the precipitation area was larger than that in actual real observation. With the Hot-sat experiment, the precipitation intensity and location were more consistent with those in rain gauge observation. Compared with the 1 h forecast of Hot-nosat experiment, the Hot-sat experiment improved in northeast Guangdong with precipitation intensity and in northern Hunan, southern Hubei, and northwestern Anhui with precipitation location. To summarize, the hot start of the GRAPES model can generate more precipitation at an early stage of model integration, which can eliminate the spin-up problem of the model. Satellite data increased the accuracy in forecasting precipitation intensity and location over that with the cold start and that when satellite data were not applied.
Compared with the 1 h forecast, the forecast of 2 h precipitation increased in all three experiments, particularly in the cold start experiment. In that experiment, precipitation was mainly located in the Jiangxi and Hunan areas which is still less than that in actual observation because of the spin-up problem of the NWP model. In the Hot-sat experiment, precipitation covered south Hunan, Jiangxi, Guangdong, and southern Guangxi, and the intensity and location of precipitation were more consistent with those in actual gauge observation. In the Hot-nosat experiment, the precipitation area extended to Hubei and Anhui, which is more extensive than that in actual observation.
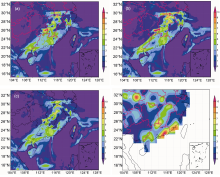
From 3 h to 6 h, the intensity and location of precipitation in the three experiments became closer over time. In 6 h (Fig. 4), all these three experiments simulated the precipitation in Guangdong, Jiangxi, southern Guangxi, and southern Hunan, but didn't show the rain center in the east of Shaanxi (Fig. 4d). The precipitation in southern Hunan is more with cold start and Hot-nosat experiment than Hot-sat experiment. From 7 h to 24 h, the spatial distribution of precipitation was almost the same.
 | Figure 4 Six-hour precipitation distribution from three numerical experiments at 0000 UTC 13 June 2008: (a) Cold start experiment; (b) Hot-nosat experiment; (c) Hot-sat experiment; (d) Rain gauge observation. |
Therefore, the period mainly that affected by the hot start is the first 6 h of the forecast. This period matches with the model integration time in the cold start experi-ment. Therefore, hot start is an effective method for eliminating the spin-up problem of the model and for improving the precipitation forecast in 0-6 h. The satellite data combination reduced the spin-up problem of the cold start experiment and resolved the precipitation overestimation of Hot-nosat experiment in this case.
The wet process of the model includes the transformation of water vapor, clouds, and rain; therefore, increasing clouds and rain in the initial field of the model will affect the distribution and transformation of the model forecast parameters such as water vapor, cloud liquid water, cloud ice, and rain and snowcontent, which will in turn affect the precipitation forecast.
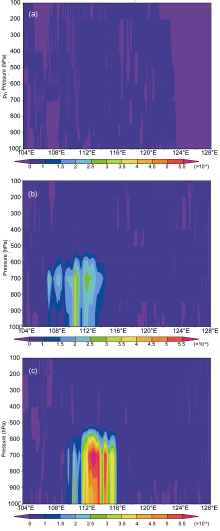
From the cross section of the 1 h forecast of rain content (Fig. 5), increasing cloud liquid water, cloud ice, and rain content in the initial state of the GRAPES model has a significant impact on model forecast of rain content. Along 25°N, in cold start experiment, the rain-content was close to zero due to the spin-up problem, whereas in both Hot-sat and Hot-nosat experiments, the forecast of rain content was significantly more than that in cold start experiment between 106°E and 112°E, and the Hot-sat experiment showed more rain content than the Hot-nosat experiment.
 | Figure 5 Cross section along 25°N of 1 h rain content from the three experiments at 0000 UTC 13 June 2008: (a) Cold start experiment; (b) Hot-nosat experiment; (c) Hot-sat experiment. |
Similarly, a high value area occurred with cloud liquid water, cloud ice, and snow in the 1 h forecast (figures omitted); however, in the cold start experiment coverage as well as intensity, the high-value area was significantly weaker than that in hot start experiments. Therefore, with cloud and rain information in the initial field of the forecast model, the model generates more hydrometeors at the early stage of integration and causes the precipitation changes in 1-6 h.
In this study, Chinese FY-2C satellite data was combined with LAPS cloud analysis to obtain cloud liquid water, cloud ice, and rain content. These cloud and rain parameters were used as the initial filed of the GRAPES forecast model. A rainstorm case in southeastern China was simulated to evaluate the effects of satellite data on cloud analysis and precipitation forecasts. The results are summarized in the following points:1) FY-2C satellite data combined with LAPS can show more realistic cloud distributions.
2) The model simulation for precipitation in 1-6 h had certain improvements than that when satellite data and complex cloud analysis were not applied.
3) The hot start experiment excluding satellite data overestimated the precipitation; therefore, satellite data can eliminate precipitation overestimation phenomenon to some extent.
There has recently been a stronger dependence on satellite data in the NWP model. In our case study, FY-2C satellite data shows good performance in cloud analysis and precipitation forecasts.
Acknowledgments. This work was jointly supported by the National Natural Science Foundation of China (41375025, 41275114, and 41275039), the National High Technology Research and Development Program of China (863 Program, 2012AA120903), the Public Benefit Research Foundation of the China Meteorological Administration (GYHY201106044 and GYHY201406001), and the China Meteorological Administration Torrential Flood Project.
| 1 |
|
| 2 |
|
| 3 |
|
| 4 |
|
| 5 |
|
| 6 |
|
| 7 |
|
| 8 |
|
| 9 |
|
| 10 |
|
| 11 |
|
| 12 |
|
| 13 |
|
| 14 |
|
| 15 |
|
| 16 |
|
| 17 |
|
| 18 |
|
| 19 |
|
| 20 |
|