Statistical Characteristics of ENSO Events in CMIP5 Models
RAO Jian1, 2 , REN Rong-Cai1, * 
Statistical Characteristics of ENSO Events in CMIP5 Models |
|
RAO Jian
|
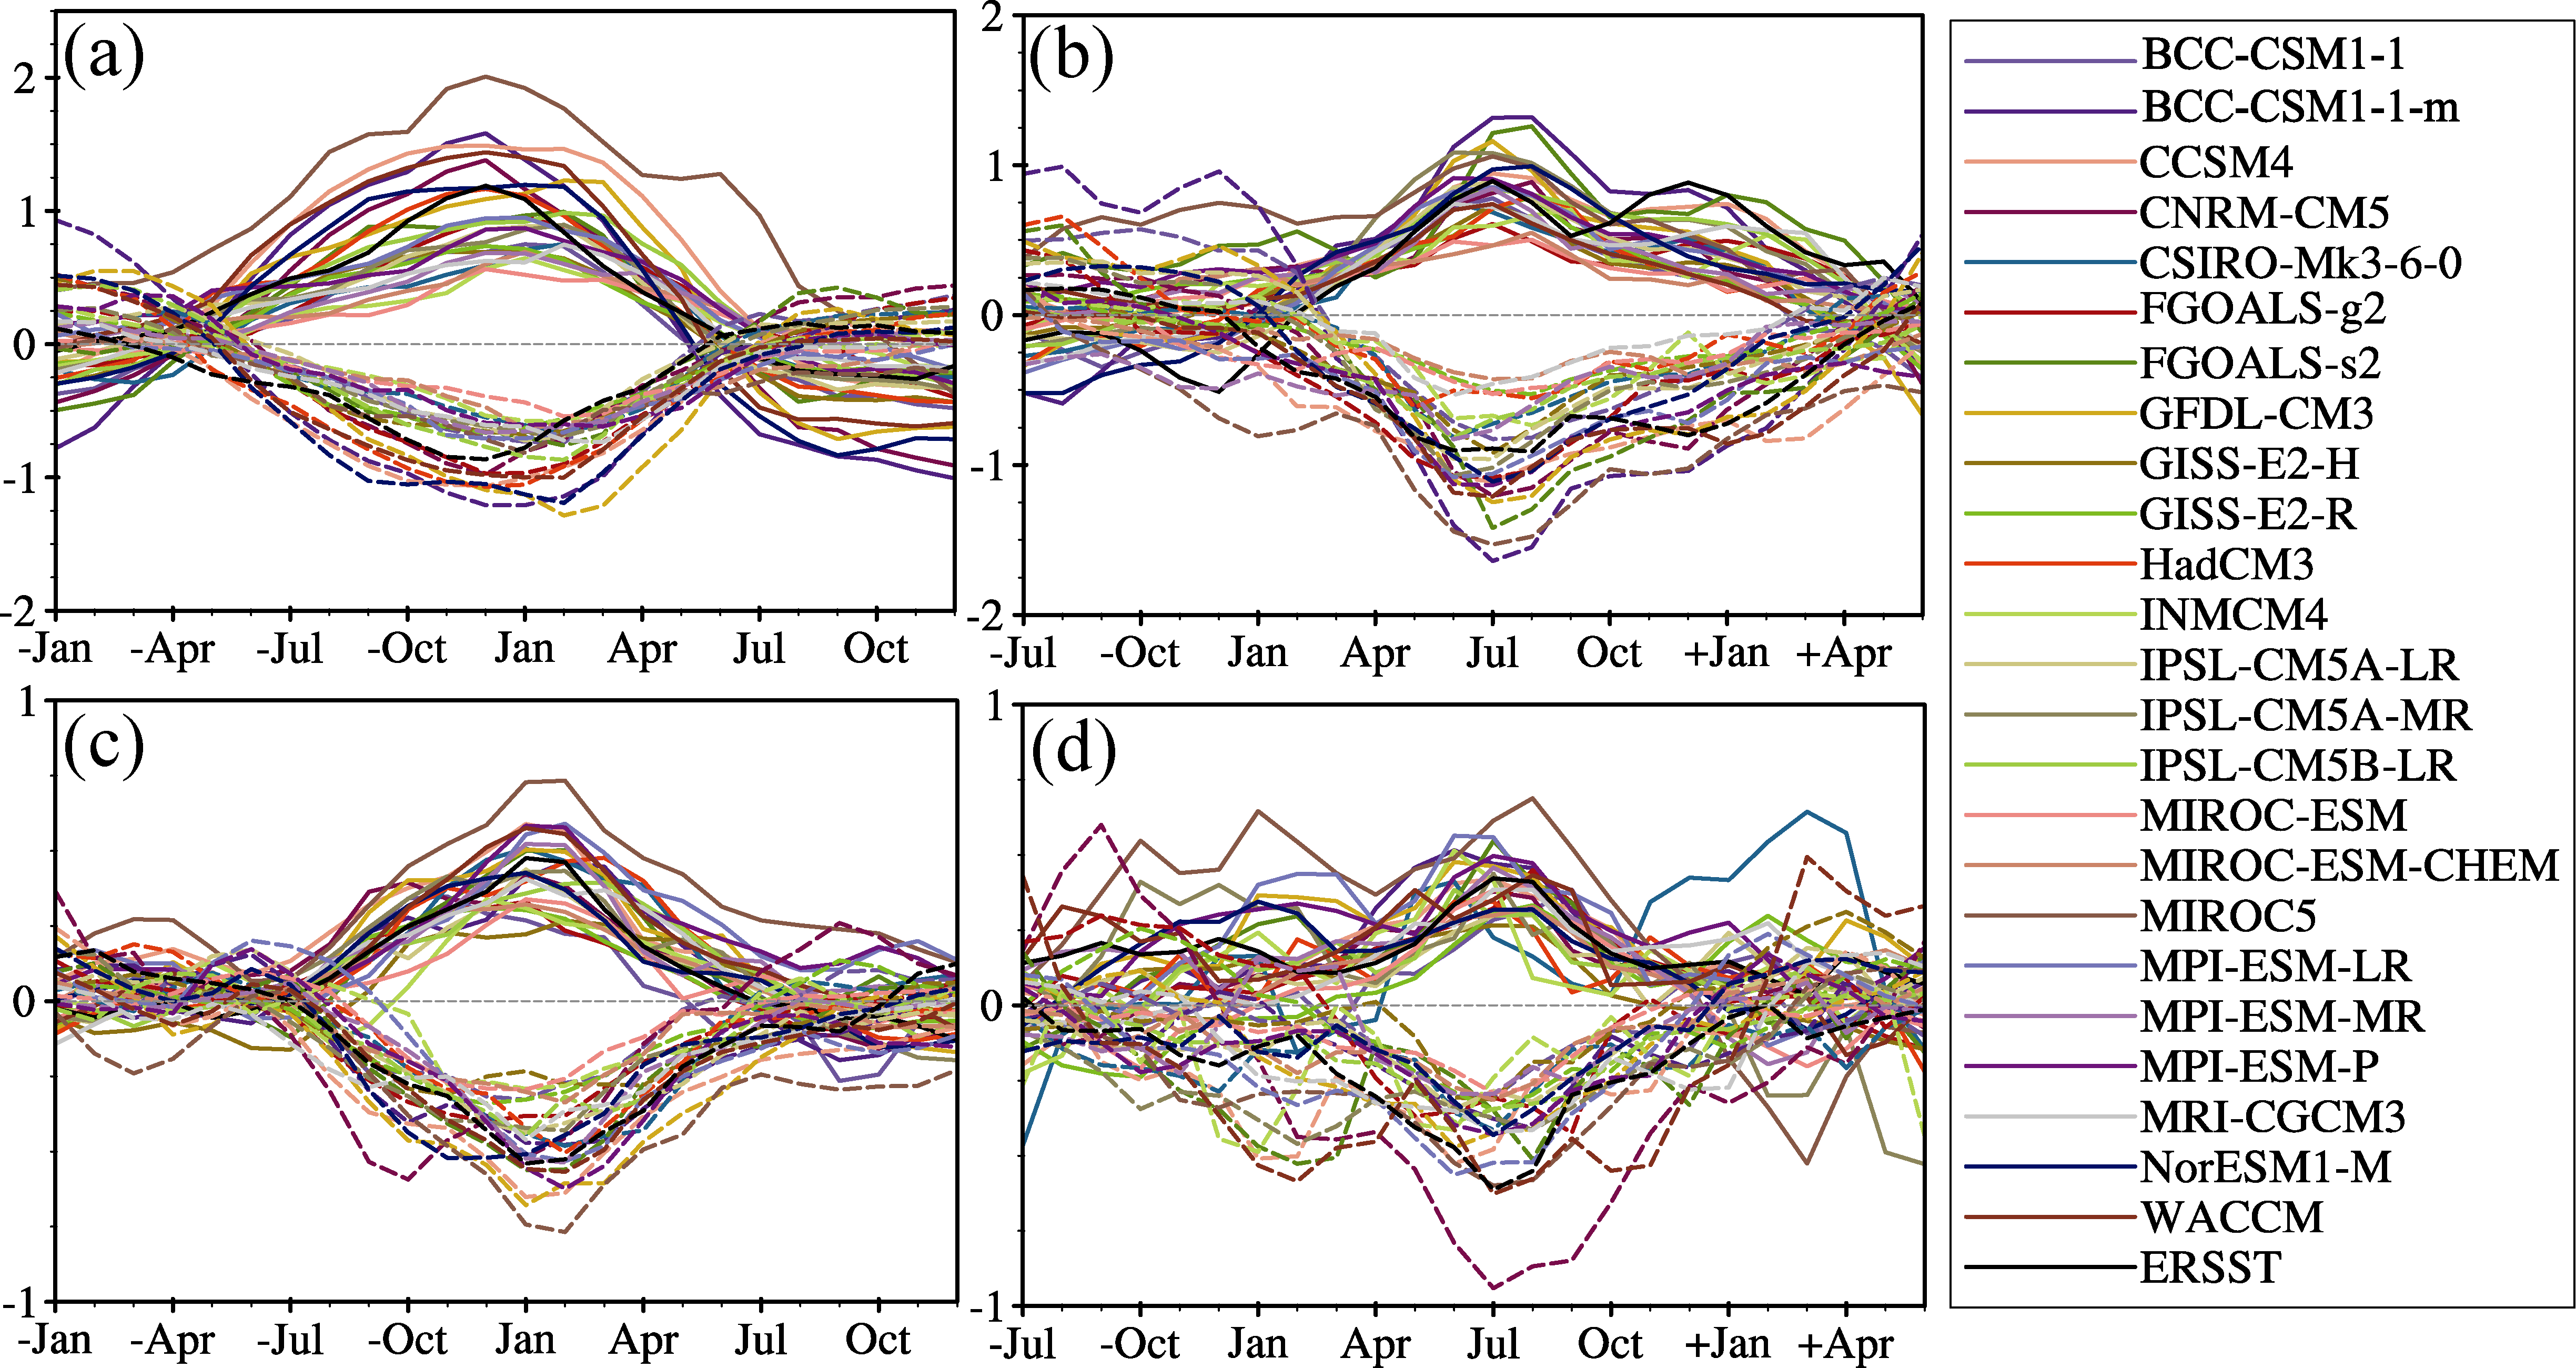
| Figure 1 Composite seasonal evolutions of a C-EP ENSO, b W-EP ENSO, c C-CP ENSO, and d W-CP ENSO in each model and in observations. The Ni#cod#x000f1;o3 indices in a, b were defined as the area-mean SST anomalies in the Ni#cod#x000f1;o3 region 5#cod#x000b0;S-5#cod#x000b0;N, 150-90#cod#x000b0;W, and the ENSO Modoki indices EMI Ashok et al., 2007 were used in c, d. The solid lines are for El Ni#cod#x000f1;o and the dashed lines for La Ni#cod#x000f1;a. Positive negative signs before months denote the year after before ENSO matured. |
| |