Statistical Characteristics of ENSO Events in CMIP5 Models
RAO Jian1, 2 , REN Rong-Cai1, * 
Statistical Characteristics of ENSO Events in CMIP5 Models |
|
RAO Jian
|
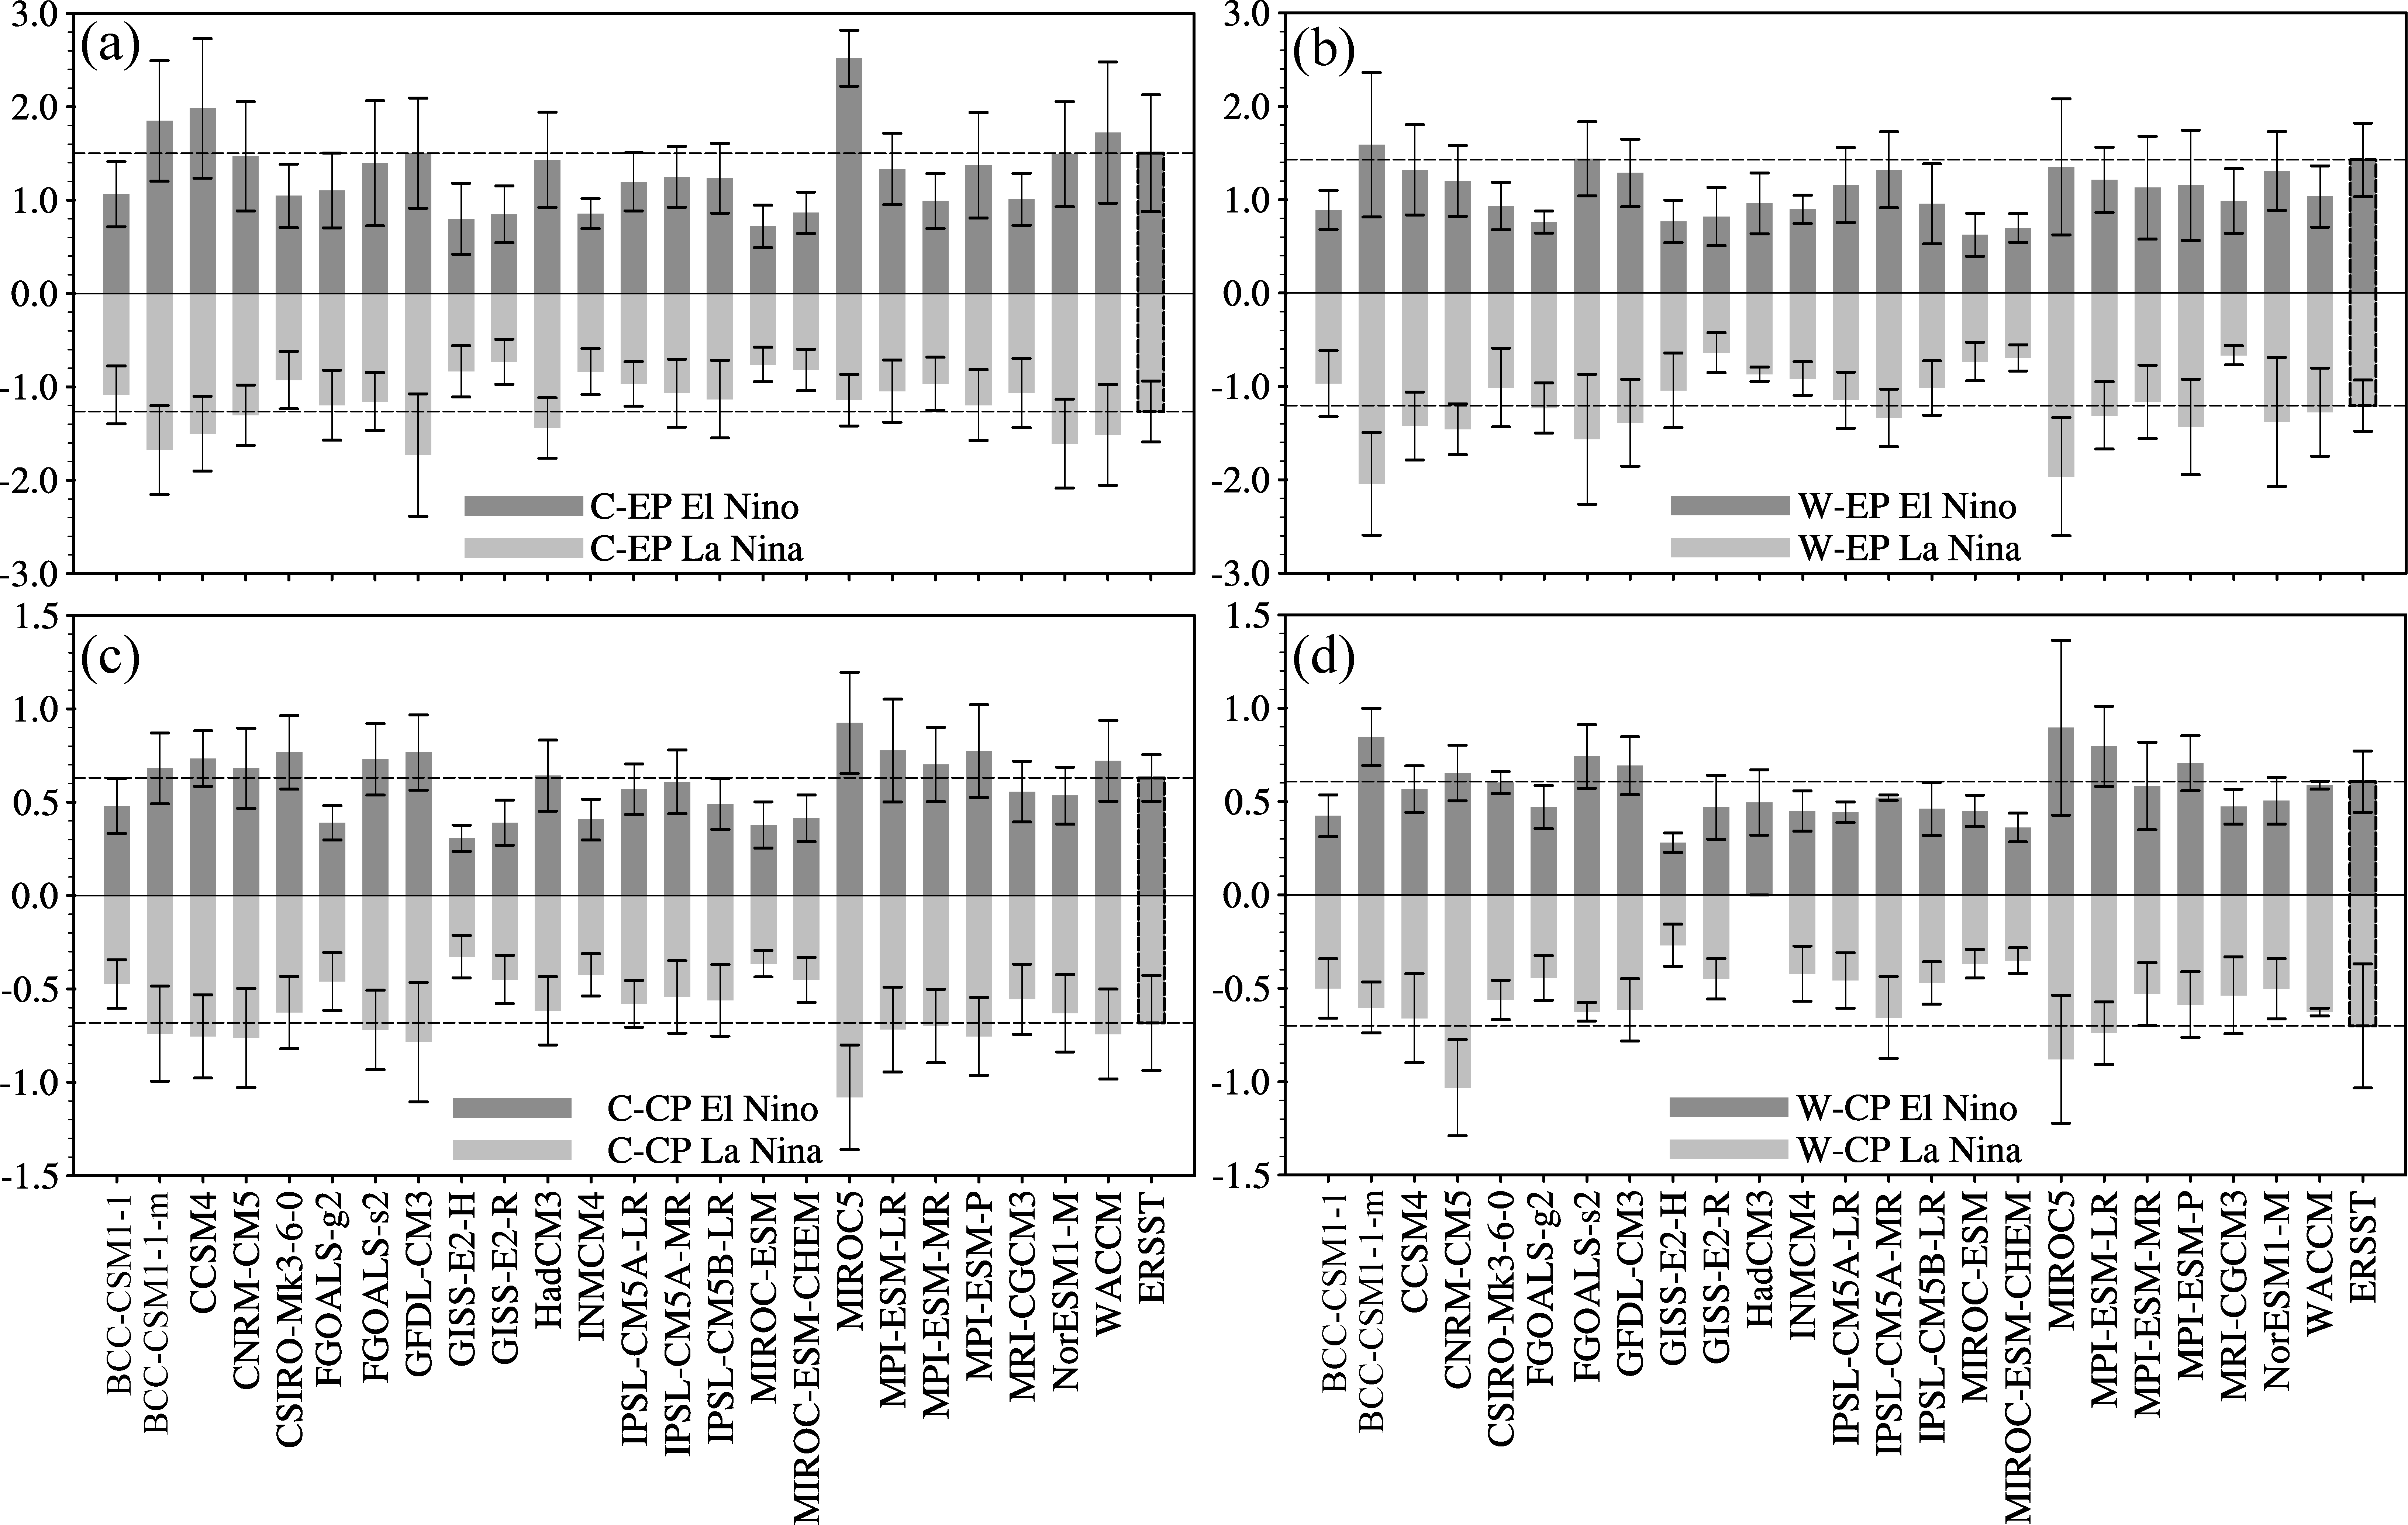
| Figure 2 Composite intensity of El Ni#cod#x000f1;o and La Ni#cod#x000f1;a for a C-EP ENSO, b W-EP ENSO, c C-CP ENSO, and d W-CP ENSO in each CMIP5 model and ERSST. The gray dashed lines show the composite results of ERSST. The vertical bars represent the intensity standard deviation for the selected El Ni#cod#x000f1;os and La Ni#cod#x000f1;as in each model or ERSST. |
| |