An Optical Disdrometer for Measuring Present Weather Parameters
JIA Sheng-Jie1, 2 , L#cod#x000dc; Da-Ren1, *  , XUAN Yue-Jian
1
, XUAN Yue-Jian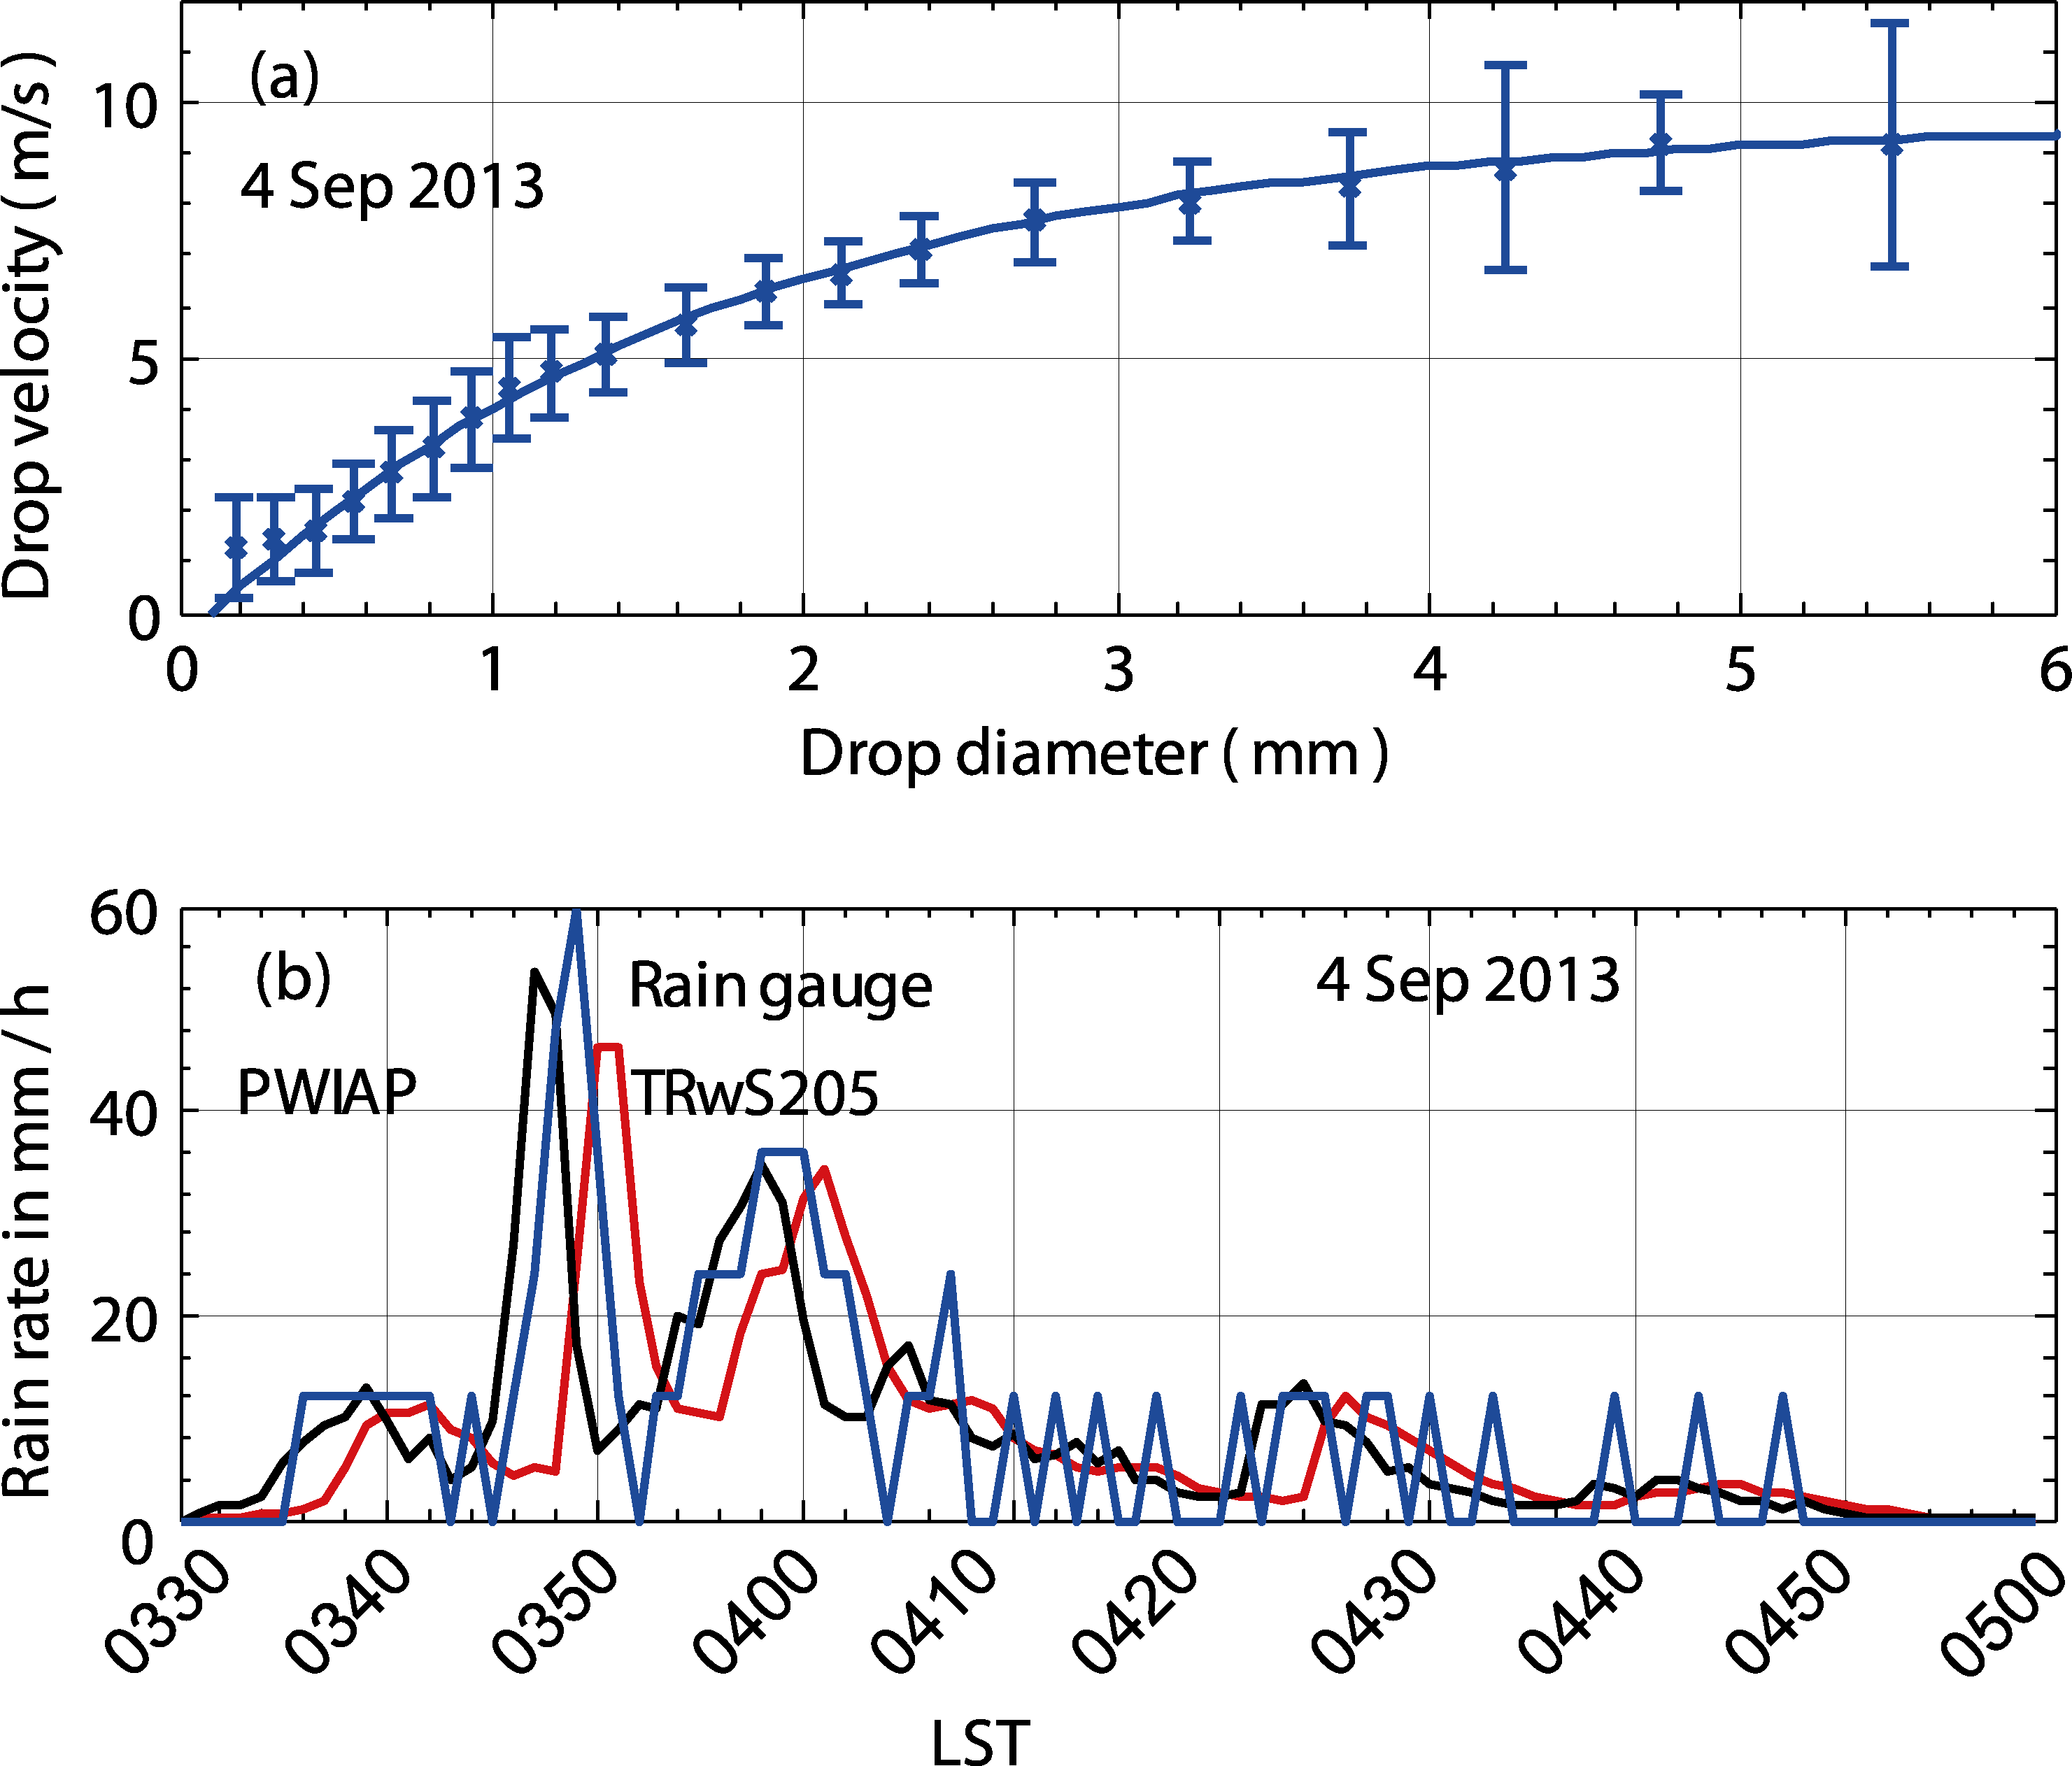
An Optical Disdrometer for Measuring Present Weather Parameters |
|
JIA Sheng-Jie
, XUAN Yue-Jian |
| Figure 3 a Scatterplot of the fall velocity of the drops measured by the proposed PWIAP as a function of diameter on 4 September 2013 LST. Crosses show the mean arithmetic velocity, and vertical bars cover the mean arithmetic velocity of one standard deviation. The solid line shows the empirical fall velocities derived from Atlas et al. 1973 after Gunn and Kinzer 1949 . b Time series of rain rates during 0330-0500 4 September 2013 LST. A comparison is given for PWIAP black line, the tipping-bucket rain gauge blue line, and the TRwS205 red line. |
| |