

Assessing MODIS Land Cover Products over China with Probability of Interannual Change
[GAO Hao1 , JIA Gen-Suo2, *  ]
]
]
|
|


Accurate and up-to-date land cover data are important for climate-change modeling. Quality assessment is becoming critical, as many satellite-based land cover products of differing scales have been released to meet the needs of scientific studies. In this study, the authors assessed the Moderate Resolution Imaging Spectroradiometer (MODIS) land cover products by analyzing the probability of interannual change from 2001 to 2012. The authors found that, cumulatively, 43.0% of MODIS land cover had changed over China from 2001 to 2012 at least once. Of this percentage, 12.1% was considered unreasonable change, 6.1% was considered reasonable change, and areas of confusion accounted for about 24.8%, giving rise to great uncertainty in the products. MODIS Collection 51 products clearly have less uncertainty than the Collection 5 products. Areas of reasonable change occurred in transition zones of ecological, biophysical, and climate gradients, while areas of unreasonable change appeared in heterogeneous landscapes. The misclassifications at three spatial scales of horizontal grids used in regional climate models occurred largely in the heterogeneous landscapes, and the areal percentage of misclassification decreased with larger horizontal grid spacing. In addition, the misclassifications in MODIS products often occurred among specific classes, which are geographically, ecologically, and spectrally similar, with low discriminative spectral-temporal signals. The effect of classification uncertainty should be made known, and further improvements are still needed for application in regional climate models. The authors‘ findings have important implications for better understanding the uncertainties of MODIS land cover products, and for improving the land surface parameterization for regional climate models.
Land cover plays an important role in the Earth’s system, and therefore, in global change studies ( Feddema et al., 2005; Verburg et al., 2011). It is a key parameter of biosphere-atmosphere interactions that parameterize land surface processes in various regional and global scale models ( Sellers et al., 1997; Oleson and Bonan, 2000; Lawrence and Chase, 2010). Satellite-derived land cover products are used in a wide array of scientific studies, such as climate modeling and ecosystem modeling, and many applications benefit from using them for improving spatially explicit model parameterization or model evalua-tion. At the same time, the accuracy of land cover products as input variables could also have a great influence on the performance of land surface and climate modeling, and have important implications for specific applications ( Benítez et al., 2004; Ge et al., 2007; Potter et al., 2008; Sertel et al., 2010). Currently, with the increasing number of global- and regional-scale satellite-derived land cover products released in response to various scientific needs ( Bartholomé and Belward, 2005; Friedl et al., 2002, 2010), understanding the accuracy and uncertainty of these products is becoming critical.
Previous studies indicate that the accuracy of these products varies significantly, with poor agreement among land cover products, especially for data at the regional scale. These studies have focused on validating land cover products with in-situ data ( Iwao et al., 2006; Mayaux, 2006; Defourny et al., 2009), and comparing popular land cover products ( Giri et al., 2005; Hansen and Reed, 2000; Fritz and See, 2008; McCallum et al., 2006; Herold et al., 2008; Kaptué et al., 2011). Unfortunately, most studies have been conducted at the global scale, and there is still a lack of good understanding of the accuracy and uncertainty of major land cover products at the regional scale. Though complete systematic approaches have been recommended for land cover assessment, numerous challenges are still encountered ( Foody, 2002; Strahler et al., 2006). A lack of sufficient ground validation sites is among the main obstacles, while differences in the sensors, spatial resolutions, algorithms, classification schemes, and data collection time are considered critical causes of disagreements and obstacles for comparing products ( Herold et al., 2008). Consequently, analyzing the accuracy and uncertainty of land cover products by using products with consistent sources, algorithms, and classification schemes is critical for such assessment.
The objectives of this study are to identify the uncertainty of MODIS Collection 51 land cover products with the International Geosphere Biosphere Programme (IGBP) classification scheme, and to assess the stability of each land cover class for China by analyzing the probability of interannual change from 2001 to 2012. A key focus is analyzing the pattern of uncertainty for the MODIS Collection 51 land cover products and analyzing the factors that contribute to the distribution of the uncertainty.
The MODIS Collection 51 land cover products were developed at approximately 500 m spatial resolution through a decision tree classifier with an ensemble supervised classification approach, based on the enhanced spectral information from the MODIS multi-band data and other MODIS products ( Friedl et al., 2002, 2010). Hereafter, we refer to these products as MLC51. Five different land cover classification schemes are provided by MLC51 products, including the IGBP classification scheme, which is widely used in various scientific applications. The global accuracy of the IGBP layer of the MODIS products in 2005 was 74.8%, as validated with field references ( Friedl et al., 2010). MLC51 are the only products that are updated and released annually, and are consistent and comparable at spatial and temporal scales due to consistent input data, legends, and classifiers.
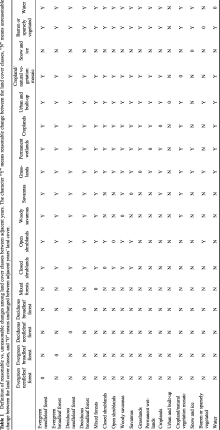
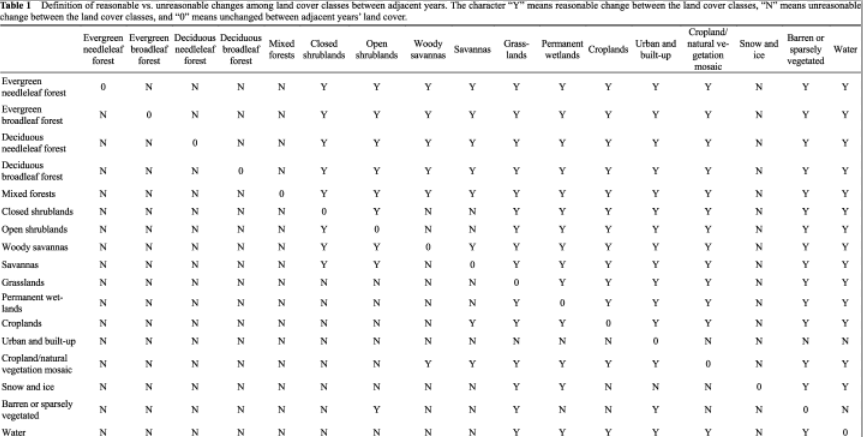
Reasonable and unreasonable changes of the IGBP land cover classification were used to identify areas that differ between two adjacent years in the MODIS data ( Liang and Gong, 2010). Considering vegetation succession, it is unlikely for certain vegetation types to change to other types over a short period. For instance, it is unlikely that shrub land or grassland will be replaced by deciduous forests on a large scale within years, or for deciduous forests to be replaced by coniferous forests at the decadal scale. However, changes in land use practices could cause reasonable change between cropland and grassland in a relatively short period; and some extreme events, such as wildfire, insect infestations, and flooding could transform dense forest vegetation to sparse woodland or even barren land in a short period. In addition, melting of snow and ice caused by climate change could be identified as land cover change on an interannual basis. Changes in land use practices, such as increased grazing, could also alter land cover categories. Policy changes in China could influence land cover change as well, such as “grain for green” and urban development planning.
Any changes in land cover classification between adjacent years were assigned with values in a lookup table (Table 1). “N” represents unreasonable or spurious change, “0” represents unchanged land cover, while “Y” represents reasonable change. In addition, classification confidence with the primary label for each pixel in each year was used to further examine this reasonable change. The change was considered reasonable only if the confidence associated with the class, which is the probability of class membership (scaled from 0 to 100) assigned to each pixel ( Mclver and Friedl, 2001), was higher than that in the preceding year. Otherwise, it was considered as confusion. Each pixel of the land cover product from 2001 to 2012 was assigned a change vector consisting of 11 elements. We defined pixels with change vectors comprised of only Y and 0 as areas of reasonable change; pixels with change vectors of only 0 were considered unchanged areas; while the remaining pixels were the uncertain areas. For instance, a pixel with a change vector of [0,0,Y,0,Y,0,Y,0,Y,Y,0] was identified as an area of reasonable change. If the change vector was only comprised of 0s, it would be identified as an unchanged area. If any element was labelled as N, it would be identified as an area of unreasonable change. We also calculated the repeats of land cover changes between successive years from 2001 to 2012. A quantity of pixels labelled unreasonable change could indicate a low accuracy of classification. On the other hand, a larger quantity of pixels labelled as areas of reasonable change could indicate a higher susceptibility to climate change or human activities.
The MLC51 land cover products were produced and released annually during 2001-12. To further identify areas of uncertainty in MLC51 land cover classification, the quantity of land cover classification variety during 2001-12 was counted. If a pixel was classified into eight different land cover categories from 2001 to 2012, it would have a land cover classification variety of eight. With a maximum of twelve, a pixel with a land cover classification variety of eight is quite high, and indicates great uncertainty in the classification of land cover. The land cover classification is supposed to be stable during a short period, but a large classification variety value may indicate lower confidence in the land cover classification for MLC51 products. High values of classification variety might indicate a high degree of uncertainty for the classification of the pixel, while low values of classification variety might indicate high confidence.
Except for the spatial uncertainty of land cover classification, the class-specific quality of the classification is also important for scientific applications. Generally, the confusion matrix is the basic and core approach for accuracy assessments: a simple cross-tabulation of the class label in the land cover products against ground observations or reference data for sample cases at specified locations. In this study, the confusion matrix for the land cover classification between adjacent years from 2001 to 2012 was calculated to analyze the confusion among the land cover classes, and to assess the stability of land cover classification in the MLC51 products. Data quality assessment was then carried out based on the assumption that the stabilization of land cover classification meant high accuracy.
The spatial patterns of reasonable and unreasonable changes were analyzed based on the MLC51 products over the period 2001-12 (Fig. 1a). The unreasonable changes were identified mostly in forested areas, which are mainly located in major mountain ranges of the region, such as the Daxing’an Mountains in the northeast of China; the Taihang Mountains running down the eastern edge of the Loess Plateau in the Shanxi, Henan, and Hebei provinces; the Qinling Mountains, a major east-west mountain range in southern Shaanxi province; the Hengduan Mountains, which form the southeastern part of the Qinghai-Tibet Plateau; the Tianshan Mountains, located west of the Xinjiang Autonomous Region, the edge of the Tibetan Plateau; and the Nanling Mountains, a group of mountain ranges in the south. The reasonable changes mainly occurred in the transition zones of ecosystems: among grassland, open shrubland and barren/sparsely vegetated land; between woody savannas and shrubland; and between cropland and natural vegetation. These categories are geographically and spectrally similar, and they frequently shift from one to another due to climate change, fire, and human activities. Almost half the land area of China (about 43.0%) was categorized into different land cover classes at least once during the period 2001-12. Among them, areas of reasonable changes accounted for about 6.1%, areas of unreasonable changes accounted for about 12.1%, and areas of confusion accounted for about 24.8% (Table 2). The previous version, MODIS Collection 5 (C5), showed that 48.6% land area of China was classified as different land cover classes during the period 2001-09. Among them, areas of reasonable changes accounted for 9.2%, areas of unreasonable changes were 15.4%, and areas of confusion were about 24.0%. MODIS Collection 51 products clearly have less uncertainty than the Collection 5 products.
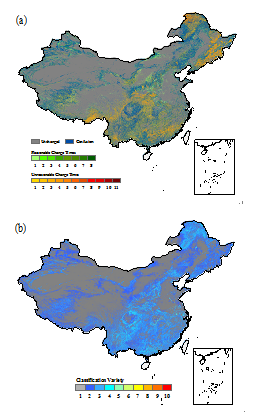 | Figure 1 Spatial patterns of probability of MODIS land cover products based on the interannual change analysis: (a) pattern of land cover change from 2001 to 2012; (b) quantity of land cover classification variety from 2001 to 2012. |
To validate the results of the analyses of the MODIS products, the spatial pattern of changes between the Environment and Ecological Science Data Center for West China (WESTDC) land cover map ( Ran et al., 2009) and MODIS products were also analyzed. The results showed that the changes are very similar to the pattern of changes for the MLC51 products over the period 2001-12. The unreasonable changes were found mainly in the mountain ranges, while the reasonable changes were located in the transition zones of major plant function types. Further qualitative analysis showed that the area of change was about 48.4%, which is quite close to the results for the MCL51 products from 2001 to 2012. The different data source, spatial resolution, and classification method of these two products may result in some uncertainty. Therefore, we also analyzed the spatial pattern of changes for GlobCover 2005 and 2009, which have the same sensor, spatial resolution, classification method, and schemes ( Bicheron et al., 2008; Bontemps et al., 2011). Before analyzing the data, we harmonized the GlobCover classification scheme to the IGBP classification according to previous studies ( Herold et al., 2009; McCallum et al., 2006). The patterns of changes were also very similar to the results of the MLC51 products-the areas of reasonable change accounted for about 9.8% and areas of unreasonable changes accounted for 8.6%. These are close to the results that were calculated for the MLC51 products from 2001 to 2012.
The uncertainty of the MLC51 products was also analyzed using the quantity of land cover classification variety for each pixel during 2001-12 (Fig. 1b). The areas with the least variety of land cover classification appeared most often in transition zones where land cover is unstable and tends to shift between similar land cover classes due to climate fluctuations. The areas with a high value of land cover classification variety occurred in heterogene-ous areas, such as in mountains and plateaus where there is high uncertainty in the classification. Further quantitative analysis showed that 57.0% of the pixels were classified as the same land cover class and 38.8% of the pixels were confused among two to three land cover classes from 2001 to 2012, indicating uncertainty among the land cover class concentrates in limited classes. The key to improving the accuracy of the land cover products is enhancing the ability to discriminate ecologically similar land cover classes. Selecting uncertain areas as training sites is one effective approach to improving the accuracy of land cover classification.
| Table 2 Summary of the changes of MODIS land cover products based on interannual change from 2001 to 2012 over China. |
For some applications, such as climate modeling, the extent of misclassified areas is an important issue, even more significant than the accuracy of classification. Here, the areal percentage of misclassification in the horizontal grid spacings of 36 km, 12 km, and 4 km, three common spatial scales of two-way nested grids used in regional climate models, was calculated based on unreasonable change from 2001 to 2012 (Fig. 2). The results also revealed that misclassification is mainly found in heterogeneous landscapes. The areal percentage of misclassification decreased with larger horizontal grid spacing. Moreover, the misclassification that occurred in transition zones often involved only isolated pixels, with little influence on neighboring pixels. Large clusters of misclassified pixels generally occurred in main mountains and plateaus, such as the Daxing‘an Mountains, the Changbai Mountains, the Qinling Mountains, the Hengduan Mountains, the Tianshan Mountains, the Tibetan Plateau, and the Nanling Mountains. The heterogeneity of landscapes is one of the main causes of misclassification. Similar results have been found in previous studies ( Latifovic and Olthof, 2004 , Kaptué et al., 2011).
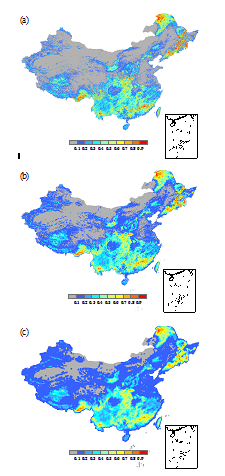 | Figure 2 Spatial pattern of the areal percentage of misclassification in horizontal grid spacings of (a) 4 km, (b) 12 km, and (c) 36 km, based on the unreasonable change from 2001 to 2012. |
It is also difficult to clearly discriminate land cover classes that are ecologically similar and have low separability of spectral-temporal signals. For example, the confusion between mixed forest and deciduous broadleaf forest, and between woody savannas and shrubland. These land cover classes often represent mixtures of different life forms or plant functional types. Therefore, it is difficult to separate these land cover classes with only coarse-resolution spectral data. It is also difficult to consistently characterize the plant functional type, an important variable for the parameterization of climate models and for the evaluation of the diversity of an ecological system on annual scales. Previous studies have shown that land cover products with different accuracy directly influence the results of the model output ( Benítez et al., 2004; Sertel et al., 2010). The common requirement of land cover accuracy for regional climate models is 80%, and the effect on simulation became stronger as accuracy decreases ( Ge et al., 2007). Our study showed that some uncertainty still exists in MODIS land cover products over China. The effect of classification uncertainty should be made known, and further improvements are still needed for application in regional climate models.
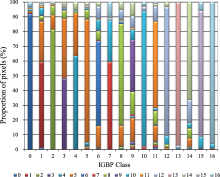
To understand the confusion among the land cover classes and to assess the stabilization of land cover classification in the MLC51 products, the mean proportion of pixels from each land cover class between adjacent years from 2001 to 2012 was compared (Fig. 3). The land cover classes of water, evergreen broadleaf forest, grassland, cropland, urban and built-up, snow and ice, and barren/sparsely vegetated were consistent during the period, indicating that the classification of these categories was very stable. Therefore, we assumed a high level of accuracy of these classes as well. On the other hand, the land cover classification “savannas” was the most seriously inconsistent class during the period. Evergreen needleleaf forest, deciduous needleleaf forest, closed shrublands, and open shrublands were also inconsistent from year to year. For example, a set of forested pixels were classified as mixed forests in one year but then misclassified as coniferous forests in next year. The forest classes were also often confused with woody savannas, savannas, and closed shrubland, which encompassed a gradient in tree fractions. Open shrubland and closed shrubland were also frequently confused with each other in classification, and similar confusion existed between woody savannas and savannas. Indeed, 26.7% of the evergreen needleleaf forests, 40.3% of the deciduous needleleaf forests, and 28.9% of deciduous broadleaf forests were misclassified as mixed forests. In addition, 7.2% of closed shrublands, 28.0% of open shrublands, and 7.2% of savannas were confused with grasslands. Meanwhile, 15.8% of mixed forest and 15.3% woody savannas were confused with savannas. In summary, misclassification largely occurred among similar land cover classes that were similar in their spectral-temporal properties and dominant plant functional types.
 | Figure 3 Mean proportion of pixels from each land cover class between adjacent years from 2001 to 2012. The x-axis represents the mean proportion of land cover class of the current year and the color represents the mean proportion of the class of the preceding year inside each land cover class of current year product. (0: Water; 1: Evergreen needleleaf forest; 2: Evergreen broadleaf forest; 3: Deciduous needleleaf forest; 4: Deciduous broadleaf forest; 5: Mixed forest; 6: Closed shrublands; 7: Open shrublands; 8: Woody savannas; 9: Savannas; 10: Grasslands; 11: Permanent wetlands; 12: Croplands; 13: Urban and built-up; 14: Cropland/natural vegetation mosaic; 15: Snow and ice; 16: Barren or sparsely vegetated). |
Consistent and accurate land cover data are fundamental requirements for global change research. The MODIS land cover products are used widely in various scientific studies, but their accuracy remains a major issue at regional scales, especially in China. In this paper, we demonstrated critical uncertainties in the MODIS Collection 51 land cover products through analyzing interannual changes of categories from 2001 to 2012 in China. About 43.0% of the pixels were categorized into different land cover classes at least once during the period 2001-12. Of this percentage, areas of reasonable change accounted for about 6.1%, areas of unreasonable change accounted for about 12.1%, and areas of confusion accounted for about 24.8%. Compared with the previous Collection 5 products, the MODIS Collection 51 products have fewer unreasonable classifications. The reasonable change occurred in transition zones where two or more classes mixed along ecological and climate gradients. Unreasonable change frequently appeared in heterogeneous mountains and plateaus. The misclassification at three common spatial scales of horizontal grids used in the regional climate model occurred largely in the heterogeneous landscapes. The areal percentage of misclassification decreased with larger horizontal grid spacing. Misclassification was often associated with isolated pixels in transition zones or homogeneous areas. Large clusters of misclassified pixels generally occurred in main mountains and plateaus. In MODIS products, the misclassification frequently occurred among specific classes that have similar ecological functions and spectral-temporal properties. The consistency of land cover classes in the MLC51 products showed a great difference. Our findings indicate that enhancing the ability to discriminate the ecologically similar land cover classes is a key method, and developing multi-sensor integrated land cover products by replacing uncertain pixels with local data at greater resolution and accuracy is a better solution for the short term. Additionally, these findings also have important implications for better understanding the uncertainties of MODIS land cover products, and for improving the land surface parameterization for regional climate models.
Acknowledgements. This study was supported by the National Basic Research Program of China (Grant No. 2012CB956202) and the Strategic Priority Research Program of the Chinese Academy of Sciences (Grant No. XDA05090201). We thank the team of the Land Processes Distributed Active Archive Center for their helpful response to our inquiry on satellite datasets.
| 1 |
|
| 2 |
|
| 3 |
|
| 4 |
|
| 5 |
|
| 6 |
|
| 7 |
|
| 8 |
|
| 9 |
|
| 10 |
|
| 11 |
|
| 12 |
|
| 13 |
|
| 14 |
|
| 15 |
|
| 16 |
|
| 17 |
|
| 18 |
|
| 19 |
|
| 20 |
|
| 21 |
|
| 22 |
|
| 23 |
|
| 24 |
|
| 25 |
|
| 26 |
|
| 27 |
|
| 28 |
|
| 29 |
|
| 30 |
|