
The Characteristics of Cloud-to-Ground Lightning Activity with Severe Thunderstorm Wind in South and North China
[YANG Xin-Lin1, 2 , SUN Jian-Hua2, 3, *  ]
]
]
|
|


The characteristics of cloud-to-ground (CG) lightning activity with severe thunderstorm wind (STW) in South and North China are analyzed using CG lightning data, radar data, and serious weather reports. The percentage of positive CG (PCG) flashes with STW in North China is larger than that in South China. STW takes place during the period when the total CG and PCG density is increasing fastest. STW also occurs close to the high-value center of CG and PCG density. In North China, the CG and PCG density in the grid of STW maximizes approximately 20 minutes after the STW occurs; while in South China, the PCG density and percentage of PCG in the grid of STW maximizes about 10 minutes before the occurrence of STW. The high-value centers of CG density and PCG density in North China move slightly faster than those in South China, which is opposite to the rate of increasing CG activity.
The severe thunderstorm wind (STW) caused by severe convective storms frequently last a short time and appear suddenly. This causes massive destruction and leads to serious risks to the safety of local residents and their property. Since it is difficult for meteorological departments to forecast the timing, intensity, and location of STW, many previous studies on STW have focused mainly on the atmospheric circulation, atmospheric physical quantities, and radar products. The likelihood of severe weather quickly increases with the density of positive cloud-to-ground (CG) (PCG) lightning ( Reap and MacGorman, 1989), and some researchers have pointed out that CG lightning activity rapidly strengthens prior to the occurrence of severe weather ( Goodman et al., 1988, 2005; Lang et al., 2000; Darden et al., 2010). The maximal density and frequency of CG in mesoscale convective systems in the west Mediterranean Sea were found to be focused on the strongest convective area ( Correoso et al., 2006). Carey et al. (2003) analyzed the CG lightning activity occurring with severe thunderstorms during the warm seasons of 1989-1998 in America. They showed that the majority (61%) of thunderstorms were associated with predominantly (> 90%) negative CG lightning, and that only 15% of severe storms were characterized by predominantly (> 50%) PCG lightning. Clearly, the relationship between severe thunderstorms and the polarity of CG flashes is affected by seasonal and regional characteristics and atmospheric conditions ( Carey and Rutledge, 1998; Rudlosky and Fuelberg, 2011).
Some previous studies have shown that the relationship between CG lightning and severe weather is relatively complicated. Qie et al. (1993) showed that there is an obvious correspondence between the frequency of CG and radar echo. PCG flashes concentrate in the strong radar echo region, and the percentage of PCG flashes in a severe storm is much larger than in a general thunderstorm ( Feng et al., 2007, 2008; Liu et al., 2009). For example, in Henan Province, a three-year average percentage of PCG flashes was 8.15%, while the percentage of PCG flashes was 45.5% in 10 hailstorms ( Feng et al., 2007). Zhang et al. (2003), in a study in the Pingliang area of Gansu Province, confirmed that hail occurred as storms approached the period when PCG lightning flashes reached a maximum. Although there is some research on the relationship between convection and severe weather, few studies can be found on the CG lightning of STWs in China. Therefore, it is necessary to analyze the characteristics of CG lightning during STW processes.
Most previous studies have focused on the temporal evolution of CG frequency during the lifetime of a thunderstorm; while little research has concentrated on the spatial changes of CG density around severe weather. In this paper, we focus on the spatial and temporal evolution of CG characteristics before and after the occurrence of STW, the results of which may be useful to the nowcasting of STWs. In the second section we introduce the data and methods used in the study, and then the results from CG activity in convective systems with STWs in both South and North China are discussed in section 3. Finally, conclusions and a discussion are given in section 4.
The CG lightning data, radar data, and serious weather reports from January 2010 to August 2013 are from the National Meteorological Center (NMC) and China Meteorological Administration (CMA) Meteorological Obser-va-tion Center. The China Lightning Detection Network contains 357 sensors over the whole of China. The CG lightning data are detected by the China Lightning Detection Network, whose detection efficiency is between 80% and 90%. The maximum detection radius of a sensor reaches up to 600 km. The CG lightning data include information on the time, location, polarity, and peak current. The PCG flashes with a peak current of less than 15 kA are eliminated because PCG flashes with a peak current in the range of 10-20 kA can be contaminated by cloud-to- cloud lightning ( Cummins et al., 2006), and the detection efficiency of PCG flashes with a peak current of less than 15 kA is extremely low ( Enno, 2011). In this work, we also use the national radar mosaic of composite reflectivity provided by the Severe Weather Prediction Center (SWPC) of the NMC, with temporal and horizontal resolutions of 10 min and 1 km × 1 km to select the STW. There are 112 operational radars, including 35 S-band Doppler radar stations. As Zheng et al. (2013) defined that the lifetime of a storm is determined by the start (end) time of the first (last) radar image where the 30 dBZ contiguous echo coverage exceeds a 30 km × 30 km area with a maximum exceeding 45 dBZ for at least 1 h, the critical value for STW selection is defined as 45 dBZ.
The serious weather reports contain wind reports, and these include both convective and non-convective wind. Based on the regulations of the SWPC of NMC, the definition of STW is that the thunderstorm wind speed is greater than 17 m s-1. The following four steps are used to select the convective STW from the serious weather reports. First, we select the wind reports whose wind speeds are larger than 17 m s-1 during the period from January 2010 to August 2013. Second, we calculate the CG lightning flashes in the 1° × 1° box whose center is located at the position of the STW from half an hour before the STW occurs to half an hour after the wind appears; and then we delete the wind reports without any CG lightning flashes. Because East China has a generally good coverage within the radar network and STW does not frequently occur in Northeast China, only the wind reports in the area (16-43°N, 105-125°E) are used in the present study. Third, if the distance between the position of the STW and the typhoon eye is less than 800 km, then the STW is considered to be affected by the typhoon, and it can be deleted. Fourth, if the strongest radar echo is less than 45 dBz in the 1° × 1° region whose center is located at the position of the STW from half an hour before the STW occurs to half an hour after the wind appears, then these wind reports are deleted because they are regarded as non-convective severe wind.
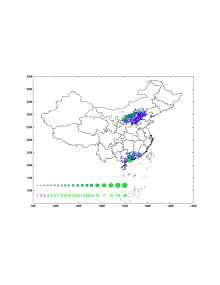
The spatial distribution of the STW frequency during the period from January 2010 to August 2013 (Fig. 1) shows that the STWs are concentrated in two regions. One is located in North China (36-43°N, 108-120°E) and the other is in South China (17-25°N, 108-120°E). According to our statistical results, there are 861 cases in North China and 331 cases in South China during the period from January 2010 to August 2013. We select the CG flashes in the 2° × 2° area whose center is located at the position of the STW from half an hour before the STW occurs to half an hour after the wind appears. The density of CG and PCG is analyzed with a spatial resolution of 0.1° × 0.1°. Section 3 analyzes the features of CG and PCG density.
 | Figure 1 The spatial distribution of Severe Thunderstorm Wind frequency during the period from January 2010 to August 2013 in North China (36-43°N, 108-120°E) and South China (17-25°N, 108-120°E). The size of the dot is proportional to the number of STWs (> 17 m s-1). |
The 10-min timing characteristics of CG flashes are analyzed from half an hour before the STW occurs to half an hour after the STW appears. This means that every part covers a 10-min period of CG data. The first part of the CG lightning data ranges from 30 to 20 min before the STW occurs. We use -30 to represent the first part, and -20, -10, 10, 20, and 30 for the other five periods.
From the distribution of CG and PCG frequency in both North and South China (not shown), there are 4106 (2174) CG lightning flashes and 126 (482) PCG lightning flashes during an average of 10 min in South (North) China, and the average percentage of PCG lightning reaches 3.06% (22.17%). The percentage of PCG lightning with STW in North China is larger than that in South China. Xue et al. (1999) indicated that the average percentage of PCG lightning in 18 hailstorms in the Beijing region reached 22.1%, which is quite close to our result. Although the quantities of CG and PCG flashes are different in each 10-min period, the changing quantity of CG (PCG) flashes accounts for a small proportion of the average CG (PCG) flashes. So, the relation between the frequency of CG or PCG and STW is not discussed further. The following sections analyze the spatial distribution of CG and PCG density in the 2° × 2° cell.
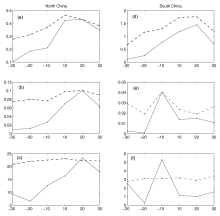
From the variation of CG and PCG density in a grid (0.1° × 0.1°) where the STW occurs in North China (Fig. 2), the CG density and the PCG density keep increasing during the first five periods. The densities reach their maximum in the fifth period, at the same time the CG activity in the grid (0.1° × 0.1°) reaches the strongest value in the 2° × 2° cell. In North China, the CG density and PCG density increase fastest during the third period to the fourth period. So, the STW occurs in North China during the period when the CG activity is associated with the fastest growth, but not during the period with the strongest CG activity. The average CG density and PCG density in the grid (0.1° × 0.1°) of the STW reach 0.28 and 0.047 flashes km-2 per 10 minutes, respectively. The variation of the percentage of PCG lightning is insignificant in North China (Fig. 2c). Chen (1995) indicated that the percentage of PCG in 20 hailstorms reached up to 65.8% in the Beijing-Tianjin-Hebei region during 1989- 1992. There is a significant difference between Chen's (1995) results and our results. Chen (1995) used CG data that were detected by only three sensors in the Beijing- Tianjin-Hebei region, which did not detect all CG activities. Also, the peak currents of PCG flashes were generally larger than the peak currents of negative CG flashes, which may mean that the detection efficiency of PCG lightning was better than the detection efficiency of negative CG lightening during 1989 to 1992. This would make the percentage of PCG in Chen's (1995) result larger than that in the present study. Liu et al. (2008) analyzed the CG characteristics of a severe convective storm process in North China, and showed that negative CG flashes were predominant in the entire process. The result of Liu et al. (2008) is consistent with this study.
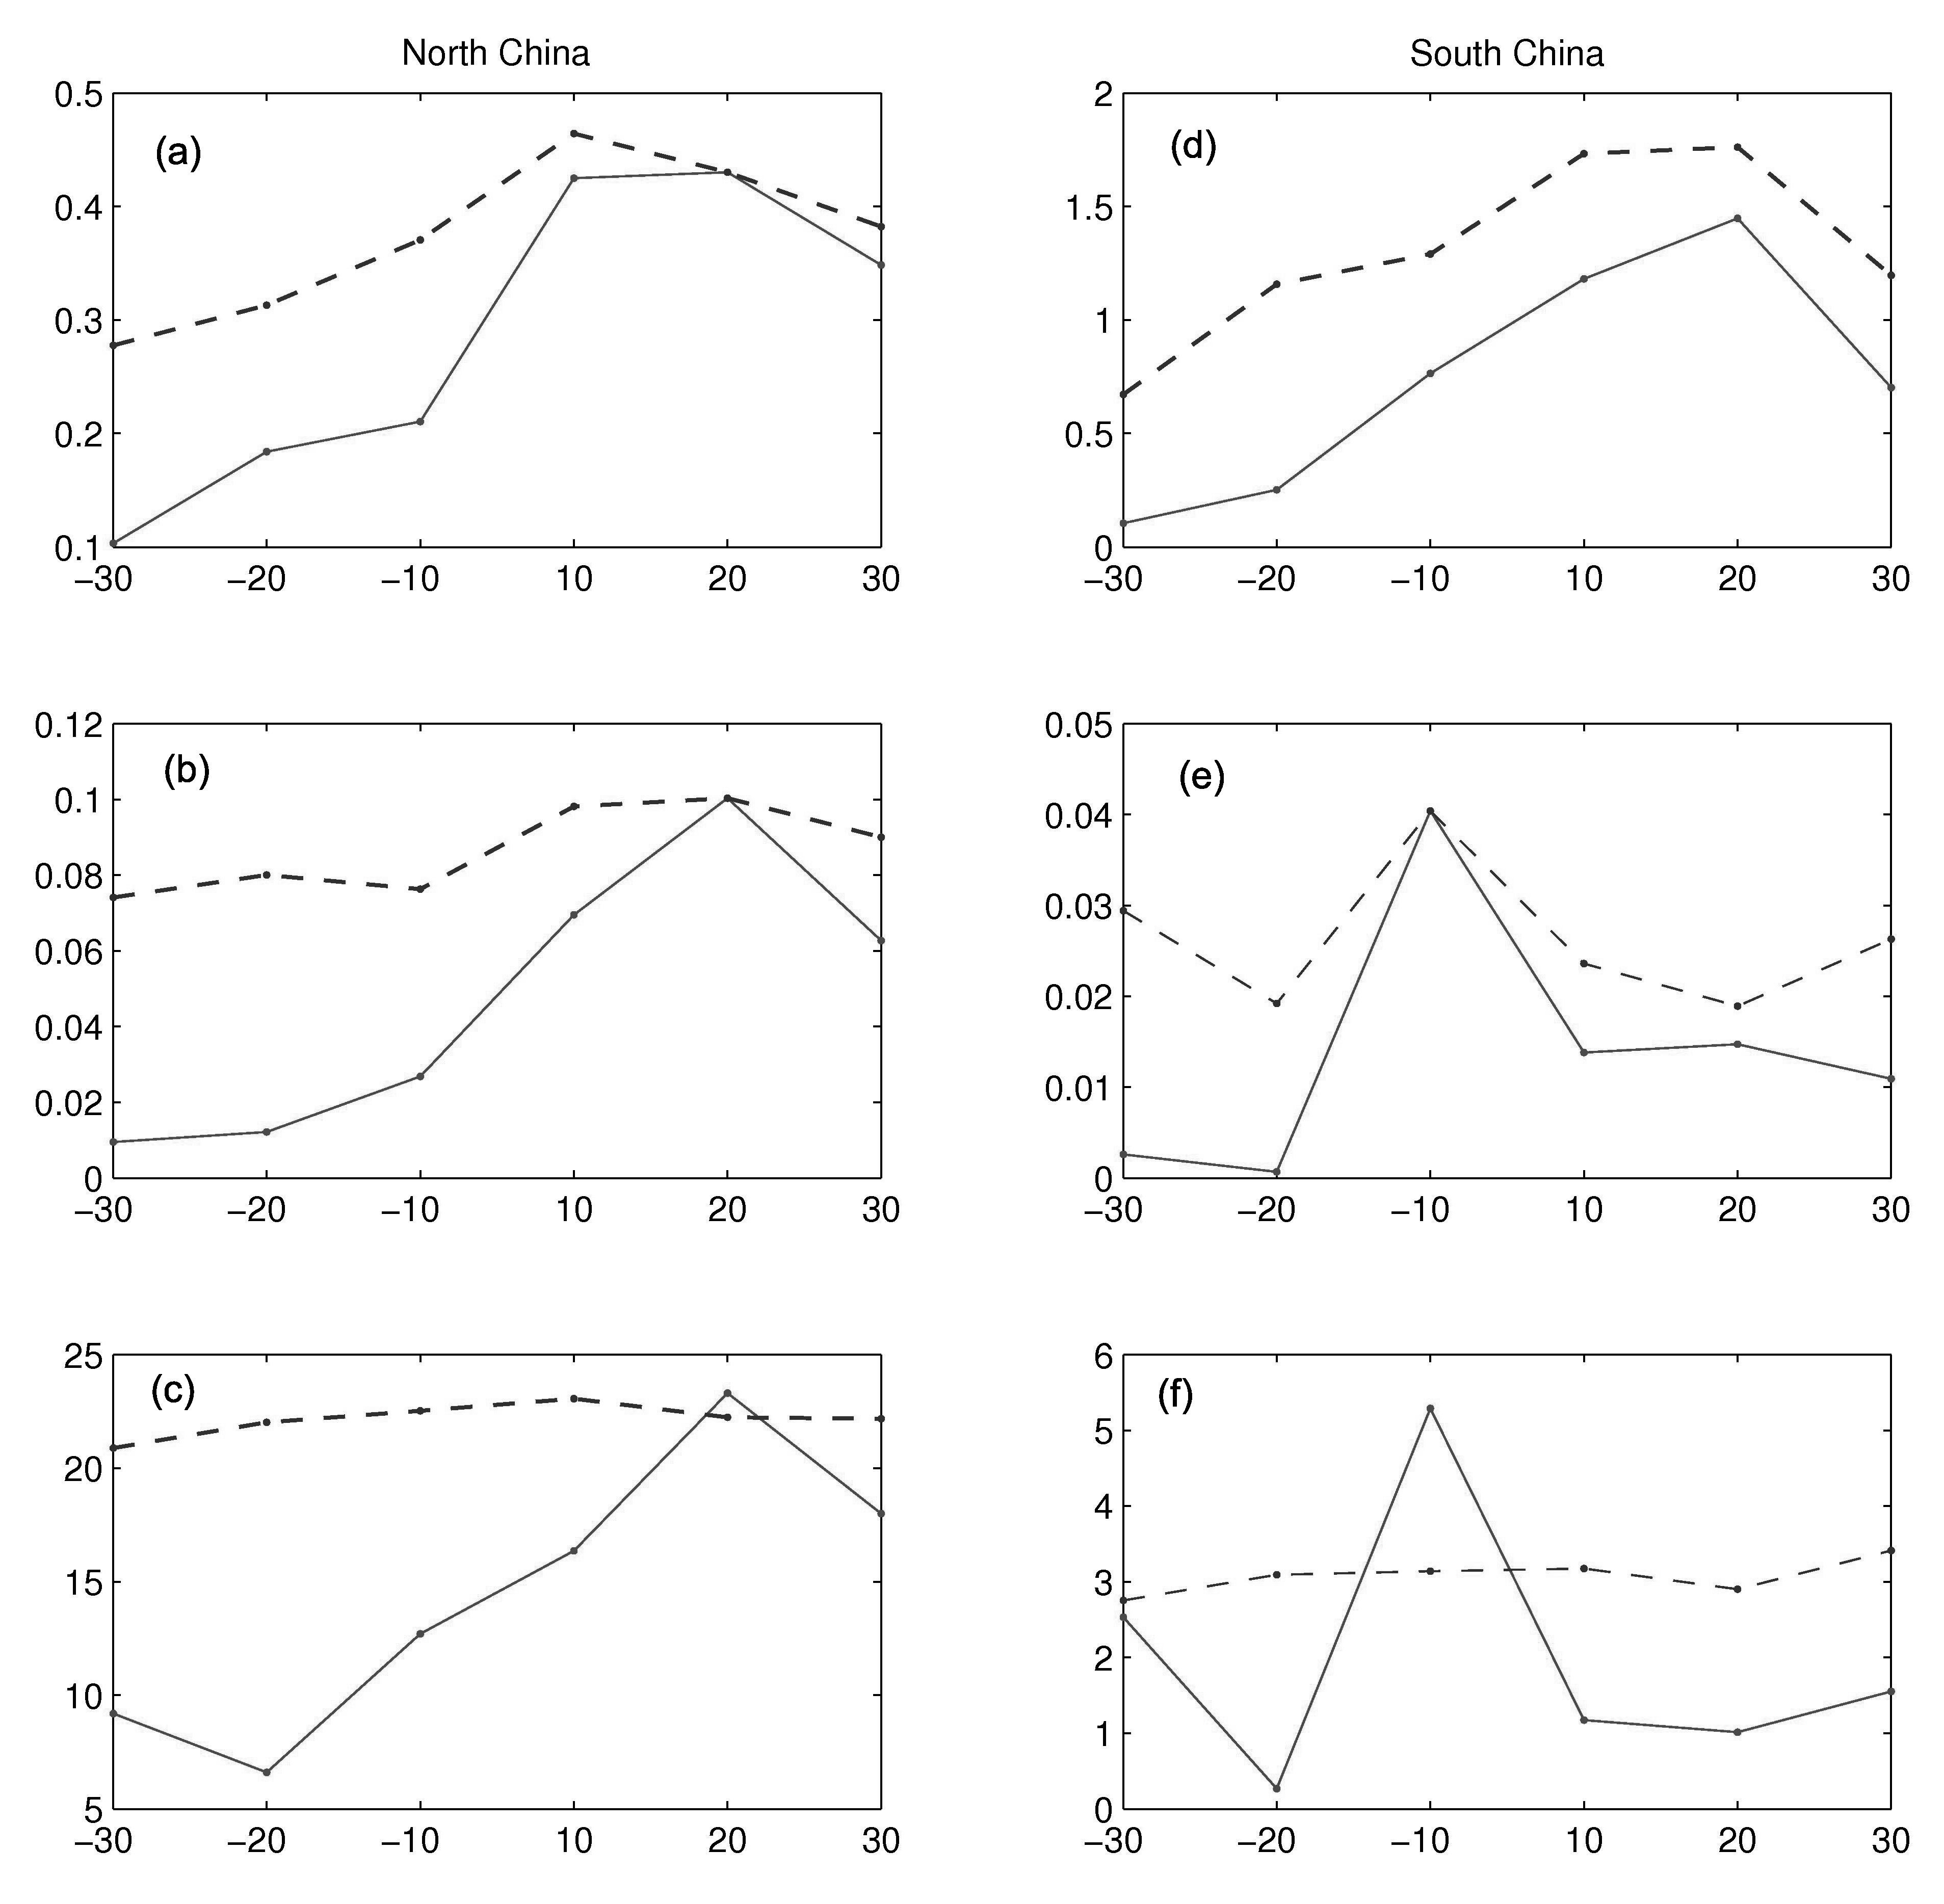 | Figure 2 (a) The variation of maximum (dashed line) Cloud-Ground density in the 2° × 2° cell and the CG density (solid line) in the areas (0.1° × 0.1°) where STW occurs in North China (units: flashes km-2 per 10 minutes). (b) As in (a), except for PCG density, and (c) the variation of the average percentage of PCG in the 2° × 2° cell (dashed line) and in the areas (0.1° × 0.1°) where STW occurs (solid line) in North China. Units: %. (d-f) As in (a-c), except for South China. |
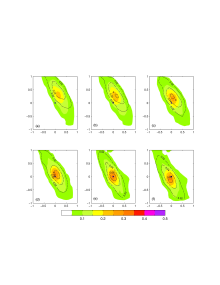
The spatial distribution of CG and PCG density during six periods in North China is shown in Fig. 3. The spatial distributions of CG and PCG density present a northwest-southeast belt structure. During the first period, the high-value centers of CG and PCG density are in northeast of the location of the STW (Fig. 3a). During the next four periods, the high-value centers appear to continue to move southwest and the intensity of CG and PCG density increases (Figs. 3b-e). The high-value centers move gradually closer to the location of the STW during the fifth period. In the last period, the high-value centers lying southwest of the location of the STW continue to move southwest and the intensity of the CG and PCG weakens.
In conclusion, in North China, during the period from half an hour before the STW occurs to half an hour after the STW appears, the CG and PCG density have a northwest-southeast belt distribution. The high values of CG and PCG density appear to keep moving from northeast to southwest during all six periods. The intensity of CG activity increases from the first to the fifth period, and meanwhile the high-value centers move gradually closer to the position of the STW. The STW occurs approximately 20 min before the high value of CG density reaches its maximum, and appears during the period when the intensity of CG activity is increasing most rapidly. The STW occurs close to the high-value center of CG density. Hail primarily appears at or near the area where the PCG flashes are concentrated ( Feng et al., 2008). Our results are similar to the relationship between hail and PCG flashes.
 | Figure 3 The spatial distribution of CG (shaded) and PCG density (black line) with STW during six periods in North China (units: flashes km-2 per 10 minutes). The blue dots represent the position of the STW. Panels (a-f) represent the six periods (-30, -20, -10, 10, 20, and 30). |
From the variation of CG and PCG density in the grid (0.1° × 0.1°) of STW in South China (Figs. 2d and 2e), the CG density is increasing during the first five periods, and the maximum CG density reaches 1.45 flashes km-2 per 10 minutes in the fifth period. Both the percentage of PCG and the density of PCG show an abrupt increase in the third period when the percentage of PCG reaches its maximum (5.29%) value (Fig. 2f). The PCG density in the grid of the STW reaches its largest value in the 2° × 2° region before the STW occurs. The average CG density and PCG density in the grid (0.1° × 0.1°) of STW reach 0.74 and 0.014 flashes km-2 per 10 minutes, respectively, and the average percentage of PCG in the grid of STW is 1.97%.
Figure 4 shows the spatial distribution of CG and PCG density for six periods in South China. The high-value centers of CG and PCG density are roughly in the northwest quadrant in the first period (Fig. 4a). During the following five periods, the high-value centers keep moving from northwest to southeast. The intensity of CG density is always increasing in the first five periods, while the intensity of PCG density continues rising during the first four periods. The high-value centers are close to the position of the STW in the fifth period (Fig. 4e). The high-value centers lie southwest of the location of the STW and the intensity of CG activity decreases in the last period (Fig. 4f).
 | Figure 4 The spatial distribution of CG (shaded) and PCG density (black line) with STW during six periods as in Fig. 3, except for South China. |
In summary, in South China, a high-value center of CG activity is moving from northwest to southeast in all six periods. The intensity of CG and PCG density increases quickly during the third period in South China. The STW occurs at or close to the high-value center of CG activity. The high value of CG density is more concentrated and higher in South China than in North China (Figs. 3 and 4). The high-value center of CG activity moves slightly slower in South China than in North China, but the intensity of CG activity increases much faster in South China than in North China.
CG lightning data and serious weather reports are used in this paper to analyze the characteristics of CG lighting activity associated with STW in both North and South China. The main conclusions can be summarized as follows:The percentage of PCG flashes with STW in North China is larger than that in South China. The STW occurs in the period when the intensity of both CG and PCG density have their fastest growth and the STW appears at or near the high-value center of CG activity. However, in North China, the maximum CG and PCG density in the grid of STW appear about 20 min after the STW occurs; while in South China, the PCG density and the percentage of PCG are at a maximum approximately 10 min before the STW.
The morphologies of CG and PCG density are different between North China and South China. In North China, the high values of CG density present a northwest-south-east band distribution that keeps moving from northeast to southwest during all six periods while the intensity of CGlightning activity slowly increases. However, in South China, the high-value density, being roughly circular in distribution, continues moving from northwest to southeast while the intensity of CG activity rapidly increases. The high-value center of CG activity in North China moves slightly faster than that in South China, and is opposite to the growth rate of CG intensity. The reason why the distribution of CG activity in North China presents a long band pattern may be that there are more line-shaped convective storms in North China, which are frequently affected by low troughs and cold fronts. This could also explain why the high value moves slightly faster in North China than in South China. In addition, the environmental conditions in South China are hot and humid, which possibly result in more local convection. In general, local convection moves slower than that affected by synoptic-scale systems in the westerlies.
The STW cases in this paper may not contain all the STW, due to the limitation of the observational data or methods. However, it is certain that all the STW cases are caused by severe convective storms. CG activity with STW is affected by seasonal and regional conditions and weather systems, and given that the conclusions of this study are based on statistically averaged data, the results only reflect the common characteristics of CG lightning with STW and may be inconsistent with the results of some cases studies. In addition, the China Lightning Detection Network can not efficiently detect cloud-to-cloud lightning, so only CG lightning is studied in this paper. Furthermore, the different variations of CG and PCG density and STW in North and South China may relate to different microphysical processes. In the future, radar, CG, and satellite data should be analyzed together to obtain the structure of convection, the microphysical processes, and the possible lightning mechanism involved in severe convective systems.
Acknowledgements. The CG lightning data were provided by the National Meteorological Center and China Meteorological Administration Meteorological Observation Centre. This research was supported by the China Meteorological Administration (Grant No. GYHY201406002) and the Key Program of the Chinese Academy of Sciences (Grant No. 2013CB430100).
| 1 |
|
| 2 |
|
| 3 |
|
| 4 |
|
| 5 |
|
| 6 |
|
| 7 |
|
| 8 |
|
| 9 |
|
| 10 |
|
| 11 |
|
| 12 |
|
| 13 |
|
| 14 |
|
| 15 |
|
| 16 |
|
| 17 |
|
| 18 |
|
| 19 |
|
| 20 |
|