A Climatology of the Southwest Vortex during 1979-2008
ZHONG Rui1 , ZHONG Lin-Hao2, *  , HUA Li-Juan
3 , FENG Shi-De4
, HUA Li-Juan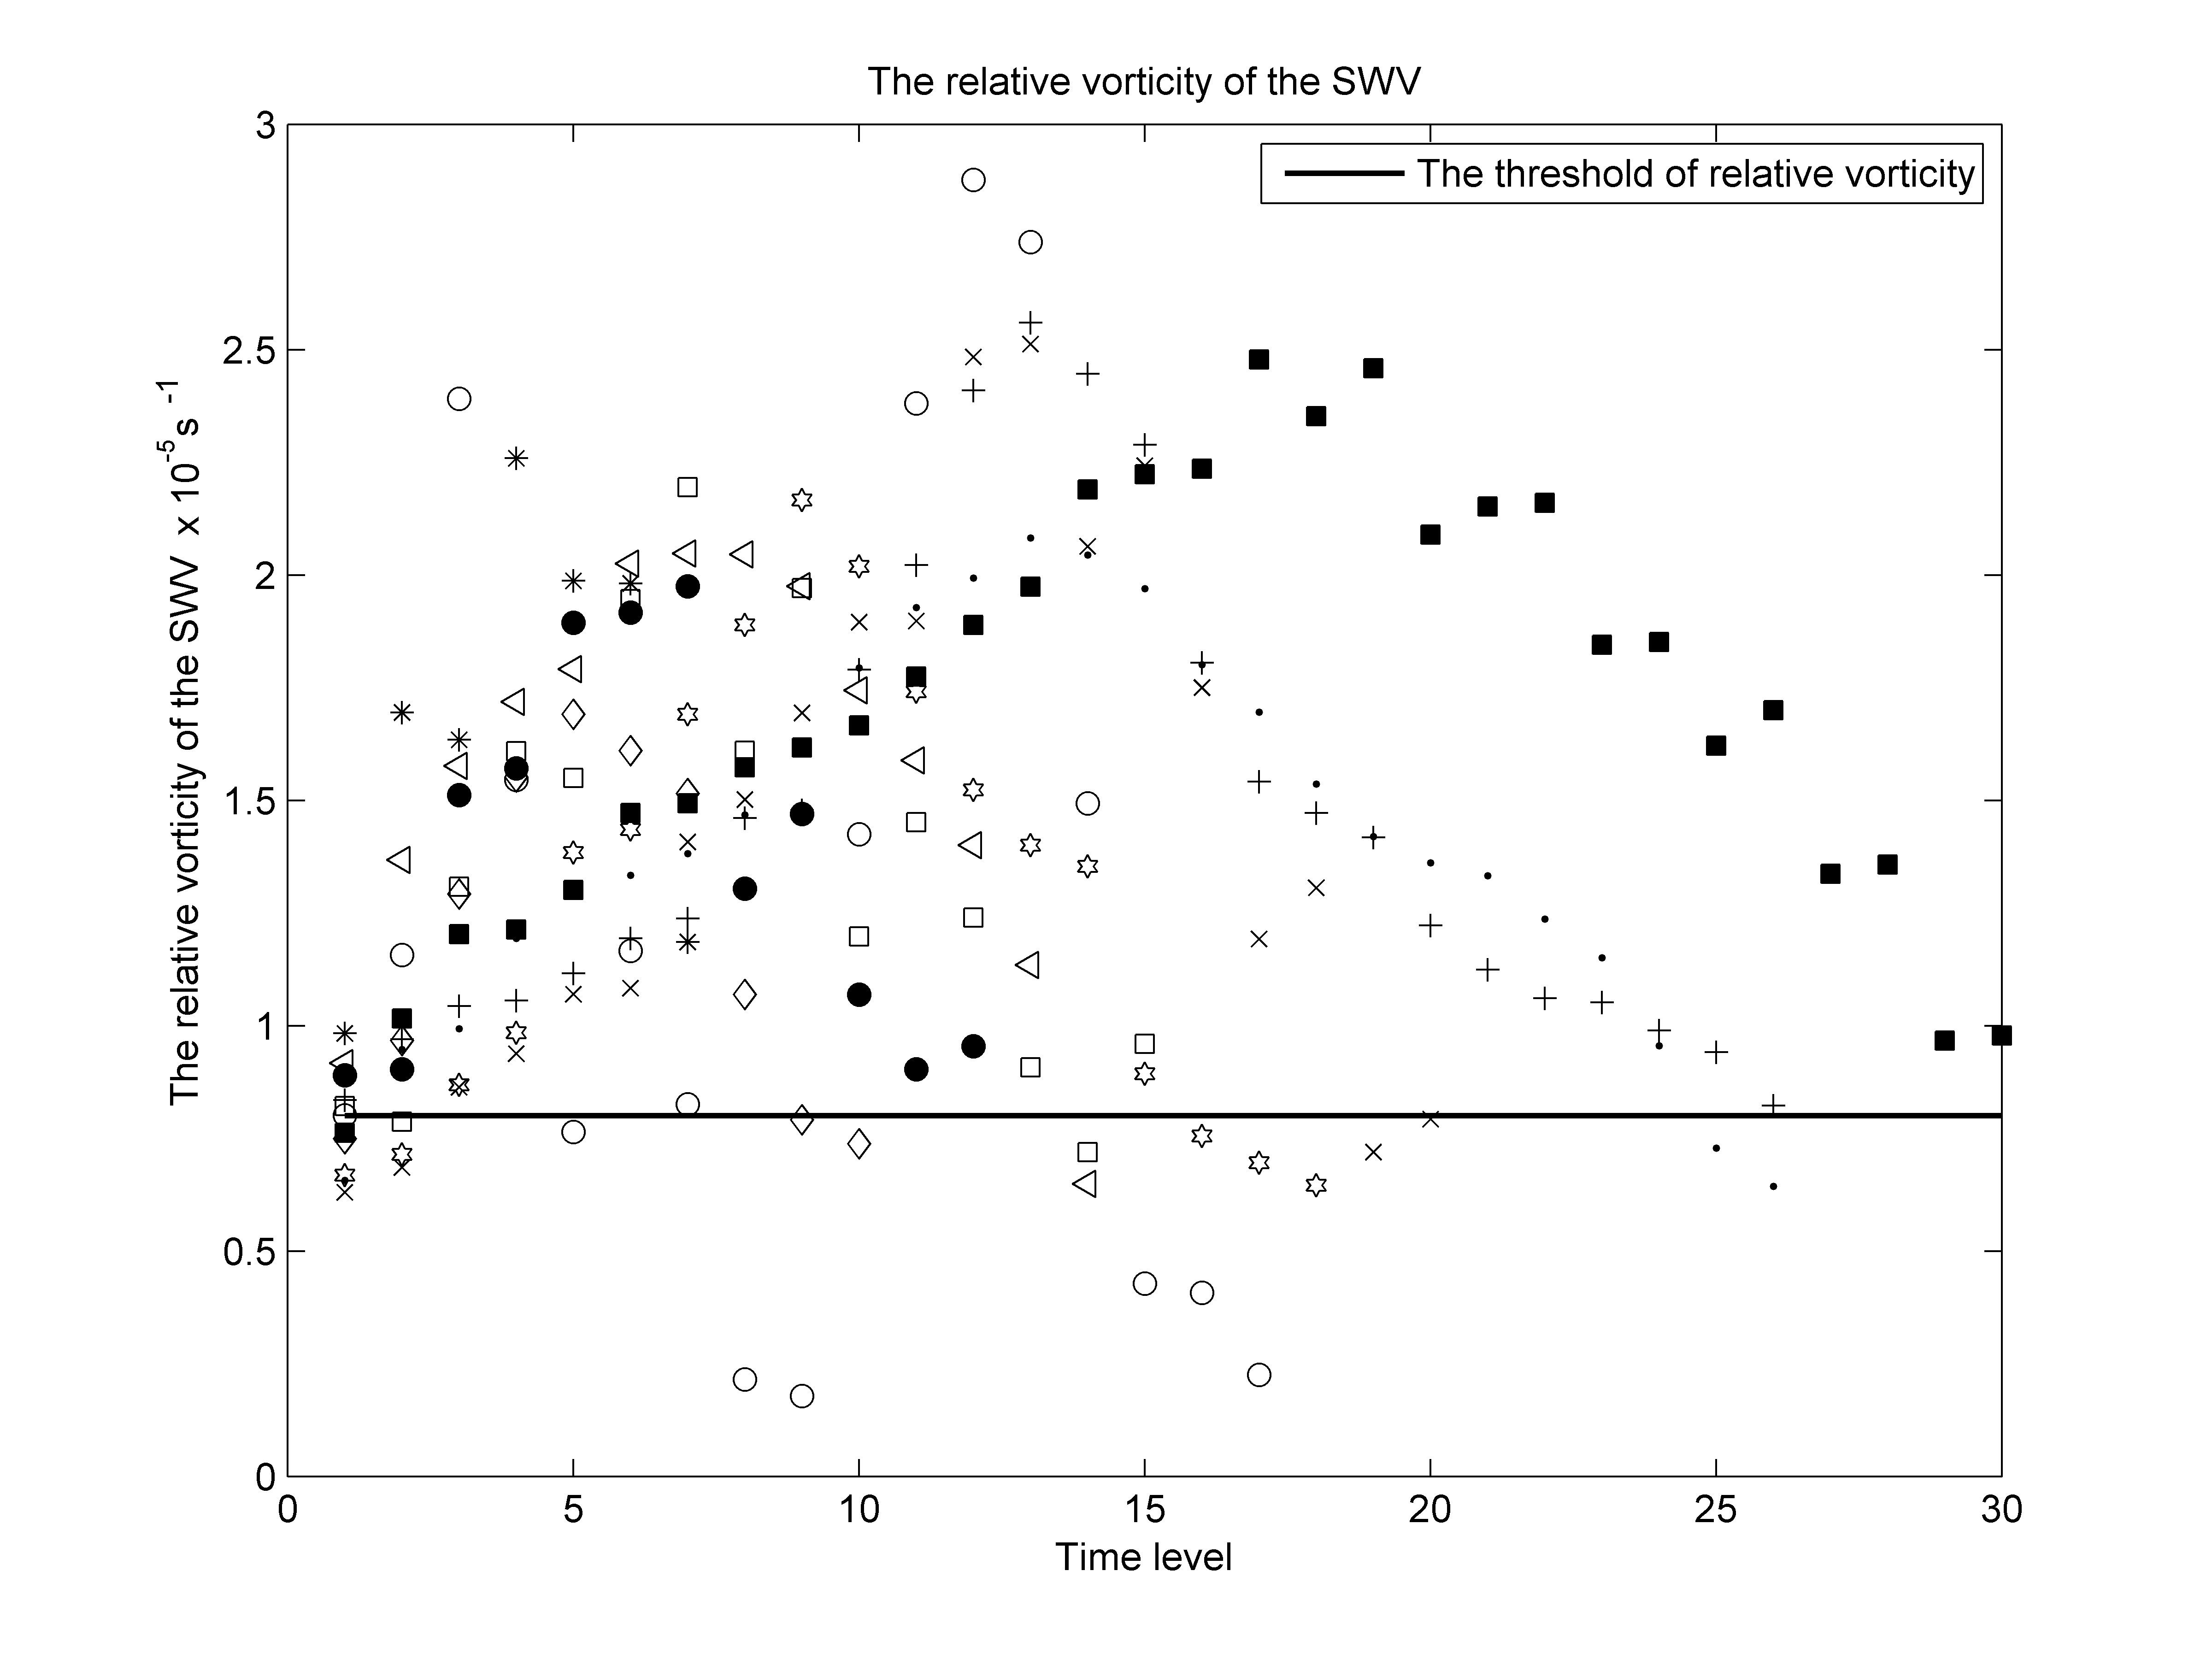
A Climatology of the Southwest Vortex during 1979-2008 |
|
ZHONG Rui
, HUA Li-Juan |
| Figure 2 Figure 1 Distribution of the relative vorticity of typical SWVs. The horizontal line is the threshold value of 0.8 #cod#x000d7; 10 -5 s -1 . The open circles, asterisks, open triangles, solid circles, crosses, solid triangles, plus signs, dots, diamonds, left-pointing triangles, and hexagons represent the relative vorticity of the SWV on 8 July 1989, 5 July 1991, 27 June 1998, 30 June 1998, 3 July 1998, 1 July 2000, 2 September 2004, 2 July 2007, 8 July 2007, 16 July 2007, and 11 June 2008, respectively. |
| |