Aerosol Direct Radiative Forcing over Shandong Peninsula in East Asia from 2004 to 2011
XIN Jin-Yuan1 , ZHANG Qing2 , GONG Chong-Shui1 , WANG Yue-Si1  , DU Wu-Peng
3 , ZHAO Yong-Fang4
, DU Wu-Peng|
|


Recent vigorous industrialization and urbanization in Shandong Peninsula, China, have resulted in the emission of heavy anthropogenic aerosols over the region. The annual means of aerosol optical depth (AOD), Ångström exponent (α), single-scattering albedo (SSA), aerosol direct radiative forcing (ARF), surface radiative forcing (SRF), and top-of-the atmospheric radiative forcing (TOA) recorded during 2004-2011 were respectively 0.67±0.19, 1.25±0.24, 0.93±0.03, 47±9 W m-2, -61±9 W m-2, and -14±8 W m-2. The aerosol optical properties and ARF characteristics showed remarkable seasonal variations due to cycle changes in the aerosol components and dominance type. The atmosphere-surface system was cooled by ARF in all years of the study due to anthropogenic sulfate and nitrate emission and sea salt aerosols. The magnitude of TOA cooling was larger in summer (-15±17 W m-2) and autumn (-12±7 W m-2) than that in spring (-8±4 W m-2) and winter (-9±10 W m-2).
Atmospheric aerosols play a major role in influencing climate change and can alter the Earth’s radiation budget by absorbing and scattering solar radiative energy, which further affects atmospheric heating, atmospheric stability, cloud development, and precipitation ( Charlson et al., 1992; Jones et al., 1994; Hansen et al., 1997; Ramanathan et al., 2001; Dubovik et al., 2002; Menon, 2004; Buseck, 2009; Zhang et al., 2012). China has played a key role in global economic growth and climate change during the most recent several decades. Large-scale farming and dramatic increases in urbanization and industrial activities have caused increased emissions of soot and organic aerosols to be absorbed into Asian and Pacific atmospheres ( Lelieveld et al., 2001; Eck et al., 2005; Streets and Aunan, 2005; Seinfeld et al., 2004), which has aggravated the uncertainty of aerosol climate and radiation effects in the region ( Penner et al., 2001; Forster et al., 2007; Huebert et al., 2003; Li, 2007; Seinfeld et al., 2004). Xin et al. ( 2007, 2011), Lee et al. (2007), and Wang et al. (2011) reported significant differences in temporal and spatial distributions of aerosol optical prosperities in China. In addition, Li et al. (2010) determined that aerosols cause substantial warming of the atmosphere at the expense of surface cooling in eastern China, which can significantly alter atmospheric heating profiles.
Shandong Peninsula is situated to the west of Bohai and the Huanghai seas. The land area of Shandong Province is 157126.31 km2. It’s the second-highest populated province in China with 95.7931 million, as reported in the 2010 Census, and one of the top three economic provinces, as evidenced by a Gross Domestic Product (GDP) of 3941.62 billion RMB (
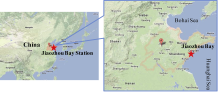
The Jiaozhou Bay observation station, shown in Fig. 1 (35.90°N, 120.18°E; 6 m above sea level), is situated on the west coast of the Huanghai Sea, which is a good regional background site for the Shandong Province in East Asia. A hand-held sun hazemeter (from the U.S. Forest Service) and a sun photometer (Microtops II of Solar Light CO.) were used to obtain measurements between 10 a.m. and 2 p.m. local time, which coincided with satellite overpass times. Measurements were obtained during each observation period when a direct line of sight to the sun was available. To ensure that no clouds were within the field of sun at a viewing angle of 30° during the observation, observers recorded, and evaluated real-time cloud conditions on cloud-free days or those in which cloud coverage was less than a half, which can efficiently reduce the cloud pollution. Langley plot calibrations are performed at the Lhasa site in August or September of each year. The calibrated values of the sun photometers are then transferred to the other sun photometers ( Xin et al., 2007, 2011). The Ångström exponent (α) was derived from the aerosol optical depths (AODs) at three wavelengths including those measured by the sun hazemeter at 405 nm, 500 nm, and 650 nm and the Microtops II sun photometer at 440 nm, 500 nm, and 675 nm; the α values ranged from 0.0 to 2.0 ( Dubovik et al., 2002). The Moderate-resolution Imaging Spectroradiometer (MODIS) Level 2 Collection 5 aerosol products were used in this paper to determine geometry data (MOD03) and the spectral surface reflectance product (MOD09); the MOD04 aerosol product had a 10 km × 10 km resolution ( Kaufman et al., 2002). The data used in this paper were all recorded from 2004 to 2011.
The single-scattering albedo (SSA) was retrieved by using the Mie theory ( Dubovik et al., 2002) and Santa Barbara DISORT (Discrete Ordinate Radiative Transfer) Atmospheric Radiative Transfer (SBDART) ( Ricchiazzi et al., 1998). The Junge power law size distribution was determined for various α values because it is governed by aerosol particle size and surface reflectance readings from the MODIS MOD04 aerosol product ( Lee et al., 2007). The aerosol direct radiative forcing (ARF) at the-top-of- the atmosphere radiative forcing (TOA) or at the surface (SRF) is defined as the difference in the net solar fluxes (down minus up; solar plus long wave; in W m-2) including and excluding aerosols. The difference in the two values yields the ARF for the entire atmosphere. In the present study, the net flux was computed in a wavelength range of 0.25-4.0 μm to cover solar short and long wavebands with and without aerosols at the TOA and SRF separately by using the SBDART model ( Ricchiazzi et al., 1998; Levy et al., 2007; Li et al., 2010). The AOD and α data were averaged within 2 h of the MODIS overpass
times. The daily MODIS data were averaged within a 25-km radius of the station, including at least five pixels. Cloud-free pixels were selected by using the multi- spectral MODIS cloud mask ( Lee et al., 2007; Kovacs, 2006).
The aerosol effect on the radiative ?uxes, defined as the radiative forcing, are given by
 | , (1) |
 | , (2) |
where △ F denotes the net downward ?ux (downward radiation F↓ minus upward radiation F↑); the superscripts TOA and SRF denote the top of the atmosphere (100 km) and the surface (1 km), respectively; and subscripts aero and non-aero denote dusty and clean skies, respectively ( Chou et al., 2002).
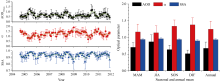
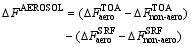
Figure 2 shows monthly and seasonal variations in AOD500 nm, α, and SSA500 nm over Shandong Peninsula in East Asia from 2004 to 2011; AOD and SSA are at the 500 nm wavelength in this paper unless otherwise stated. These three important parameters of aerosol optical properties govern the extinction, aerosol type, relative scattering, and absorption. Their variations showed remarkable seasonal cycles in the region. Due to its rapid development, Shandong Peninsula was covered by a substantial amount anthropogenic aerosol. As shown in Table 1, the annual mean of AOD reached 0.67±0.19 with a seasonal range of 0.51 to 0.87, which was approximately three times the regional background AOD of North China ( Xin et al., 2007). The maximum AOD (0.87±0.21) occurred in summer at which time high concentrations of aerosol and relatively high atmospheric humidity persisted, and the extinction properties were magnified with aerosol hygroscopic growth. This aerosol consisted of mainly hygroscopic sulfates and nitrates produced by the vigorous anthropogenic emission ( Wang et al., 2005). The dominant aerosol types were larger in spring and summer than those in autumn and winter due to dust particle transmission and soil aerosol emission in spring, aerosol hygroscopic growth in summer, and increased smoke and soot aerosols from fossil fuel and biomass burning in autumn and winter in northern China ( Xin et al., 2007, 2012; Wang et al., 2011).
 | Figure 1 The location of Jiaozhou Bay Station situated on the west coast of Huanghai Sea. |
 | Figure 2 Monthly and seasonal variations in AOD500 nm, Ångström exponent (α), and SSA over Shandong Peninsula in East Asia from 2004 to 2011. |
| Table 1 Seasonal and annual averaged AOD500 nm, Ångström exponent (α), SSA, ARF, SRF, and TOA over Shandong Peninsula in East Asia from 2004 to 2011. |
SSA is the rate of scattering to the sum of scattering and absorption. As shown in Table 1, the annual mean of SSA was 0.93±0.03 with a small seasonal range of 0.90 to 0.96, which implies that aerosols contained a mix of abundant anthropogenic aerosol ( Li et al., 2010; Bush and Valero, 2002; Ramanathan et al., 2001). The SSA of black carbon (BC) at visible wavelengths is approximately 0.2, whereas that for sulfate aerosol is approximately 1.0 ( Ramanathan et al., 2001; Penner et al., 2001; Haywood and Boucher, 2000). The SSAs of most Northern Hemisphere aerosols are in the 0.85-0.95 range ( Ramanathan et al., 2001; Hansen et al., 1997; Jacobson, 2001; Lee et al., 2007). The seasonal variation of SSA was remarkable and showed negative correlation with the monthly mean of the α. The trends of AOD and SSA were indistinctive, whereas the α showed a minor increase in recent years, which implies an increase in small aerosols over the region. Ramanathan et al. (2001) reported that aerosols have a net negative TOA forcing when the SSA exceeds 0.95 and a net positive TOA forcing for SSAs< 0.85. For the intermediate values, the net effect can change from negative to large positive forcing depending on cloud fraction, surface albedo, and distribution of vertical aerosols and clouds. However, regional TOA direct forcing is highly uncertain, particularly in regions containing atmospheric pollution.
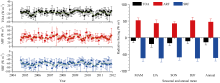
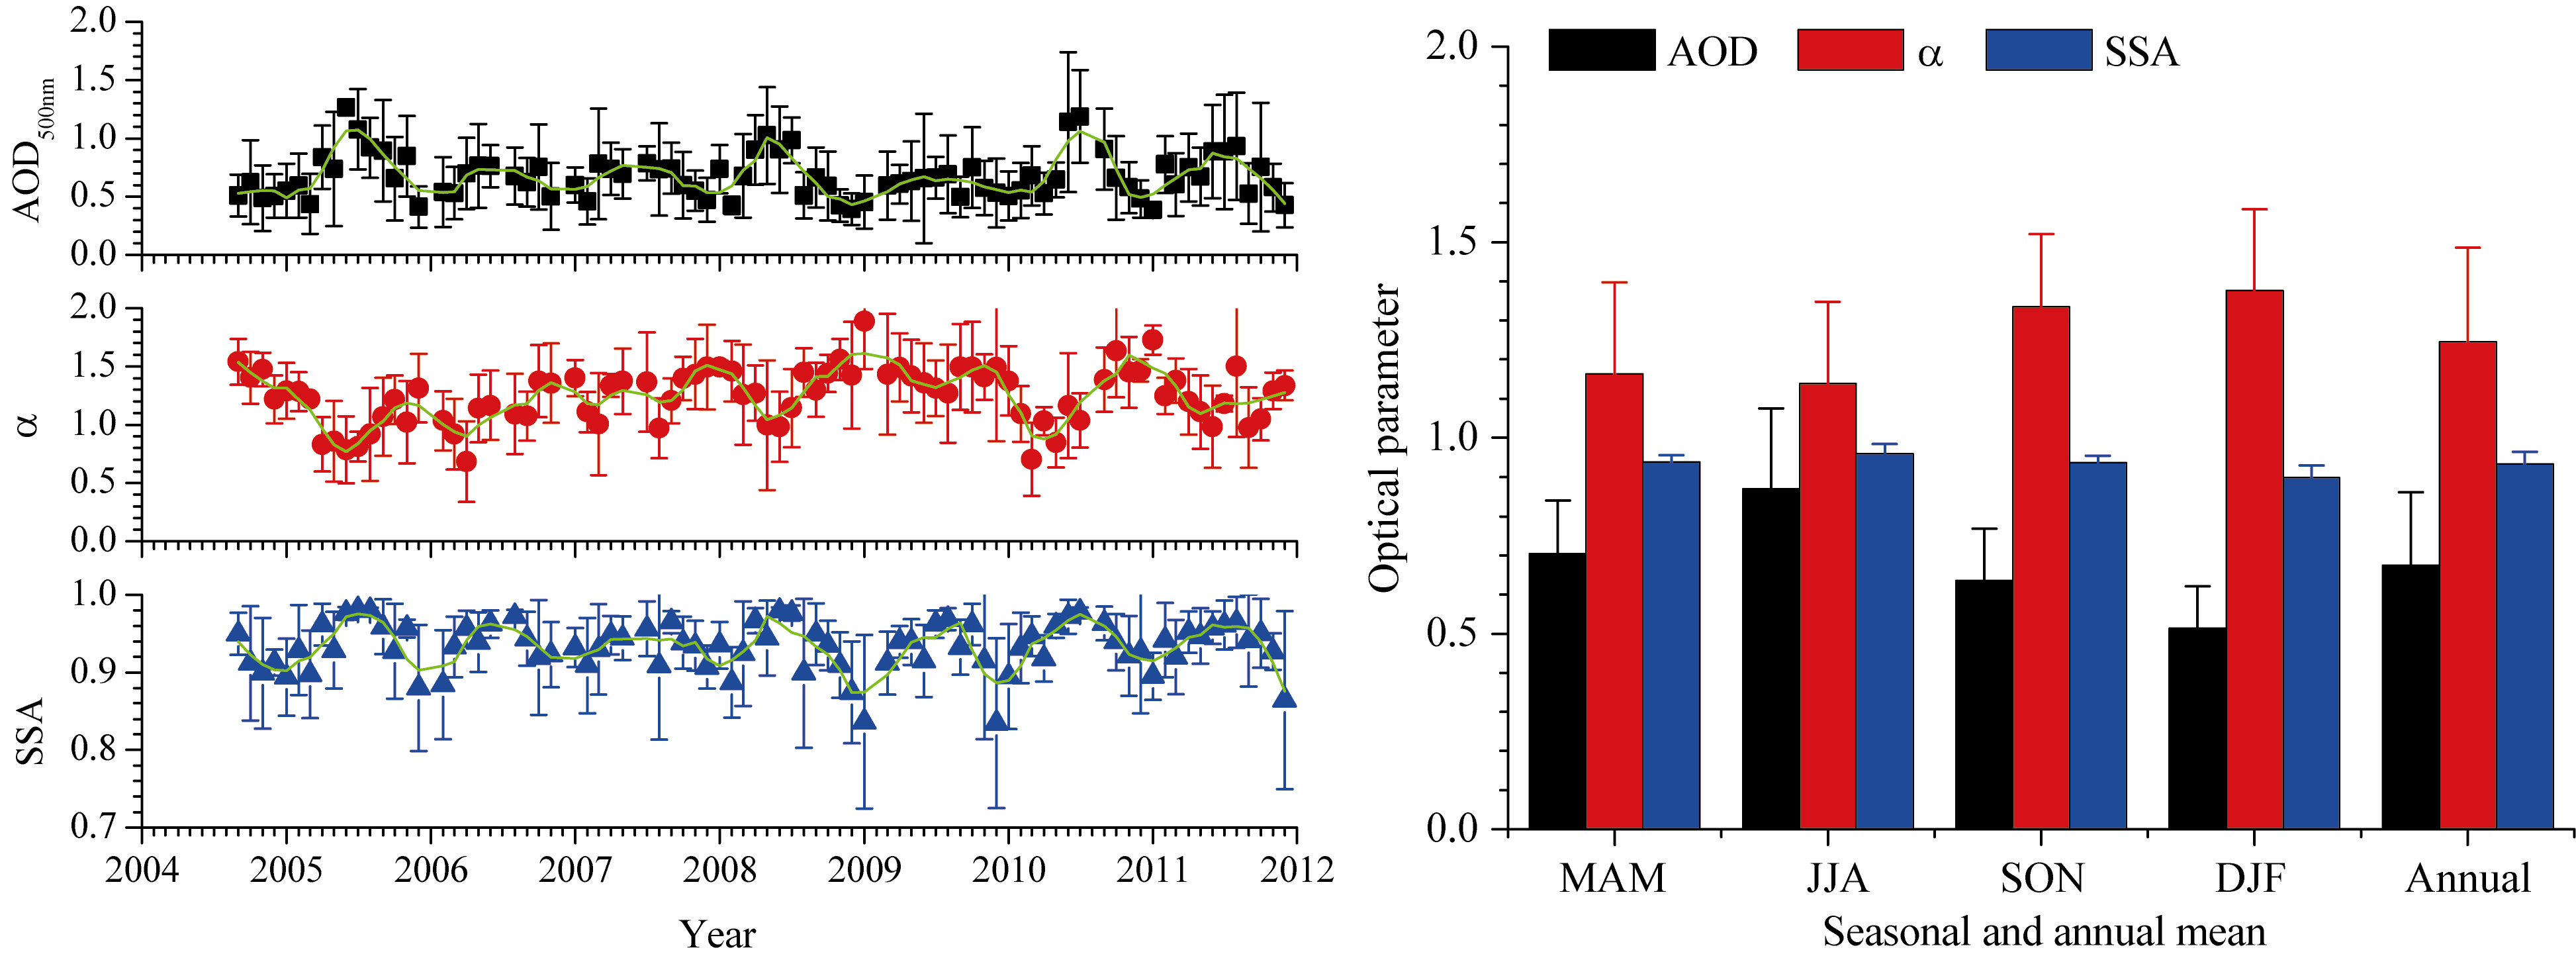
Figure 3 shows monthly and seasonal variation in ARF, SRF, and TOA over Shandong Peninsula. The annual means of these parameters were 47±9 W m?2, -61±9 W m?2, and ?14±8 W m?2, respectively, with large standard deviation in the wavelength range of 0.25-4.0 μm. Seasonal variations in AOD, ARF, SRF, and TOA exhibited seasonal cycles. As shown in Table 1, ARF was positive and higher in spring (52±7 W m?2) and winter (52±10 W m?2) than that in summer (43±10 W m?2) and autumn (43±5 W m?2), whereas SRF was negative and lower in spring, summer, and winter (approximately -62 W m?2) than that in autumn (-59 W m?2). TOA was lower in summer (?19±10 W m?2) and autumn (?16±7 W m?2) than that in spring (?10±5 W m?2) and winter (?11±7 W m?2). The global mean clear-sky ARF, both natural and anthropogenic, at the TOA and SRF were ?6.0 ±1 W m?2 and ?11±2 W m?2, respectively. The magnitude of the annual mean TOA (?14±8 W m?2) was higher than the global mean, which implies that abundant anthropogenic sulfate and nitrate aerosols in addition to and sea salt aerosols further cooled the atmospheric-surface system in the region of pollution. However, the huge amount of solar radiation trapped inside the atmosphere by the ARF was a significant source of heating for the atmosphere, particularly within the lower atmosphere, which can substantially alter atmospheric stability and influence the dynamic system ( Li et al., 2010). The trends in ARF and TOA showed weak declines in recent years, and that in SRF exhibited a weak increase.
 | Figure 3 Monthly and seasonal variation in ARF, SRF, and TOA at a wavelength range of 0.25-4.0 μm occurring over Shandong Peninsula in East Asia from 2004 to 2011. |
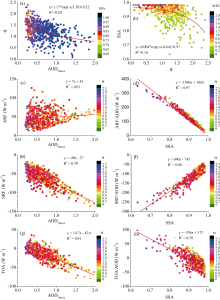
Figure 4 shows the relationships between the daily averaged AOD, α, SSA, aerosol ARF, SRF, TOA, and the heating rates of the latter three parameters and relevant conditional factors. The heating rate of ARF is the radiation per unit AOD, which include the rates of ARF to AOD (ARF/AOD), SRF to AOD (SRF/AOD), and TOA to AOD (TOA/AOD). The scatterplot of α as a function of AOD (Fig. 4a), which was classified according to SSA, showed that SSA had no remarkable effect on the relationship between α and AOD; α declined with AOD, and SSA declined with α (Fig. 4b). An abundance of anthropogenic sulfate and nitrate aerosols grow into large aerosols through hygroscopic absorption and showed strong scattering with large AOD, large SSA, and small α values. The small smoke and soot carbon aerosols (large α) showed strong absorption with small SSA and AOD values. The large α value implies that small absorptive smoke and soot aerosols increased as dominant aerosol types. The components and types of aerosol were complicated and variable due to the effects of the strong anthropogenic emissions in the Shandong Peninsula. Consequentially, ARF was also highly complicated and differed with respect to the background region. The strong anthropogenic emission enhanced the uncertainty of the aerosol effect on the regional climate.
 | Figure 4 Relationships between the daily averaged AOD, α, SSA, ARF, SRF, TOA, and the heating rates the latter three parameters and relevant conditional factors over Shandong Peninsula in East Asia recorded from 2004 to 2011. |
Except of the relationship of ARF and AOD (Fig. 4c), the relationships of SRF and AOD (Fig. 4e), TOA and AOD (Fig. 4g) were significant linear correlations. With AOD increasing, the magnitudes of ARF, SRF, and TOA were increscent as a function of AOD. The ARF warmed the atmosphere and cooled the surface. However, positive and negative differences appeared in the atmosphere- surface system that was dependent on the aerosol components. The correlations of the heating rates of ARF and SSA (Fig. 4d), SRF and SSA (Fig. 4f), and TOA and SSA (Fig. 4h), which were classified according to the dominant aerosol type, showed very high correlation coefficients ( R2) of 0.58-0.97. The aerosol components and type, expressed as SSA and α, respectively, controlled the heating rate of the ARF on the atmosphere-surface system. The small smoke and soot aerosols had the highest heating rates of ARF and SRF. Their efficiency in warming the atmosphere was higher than that of cooling the surface; thus, the presence of these aerosols resulted in the TOA positive heating rate and warming of the atmosphere-surface system. Anthropogenic sulfate, nitrate, organic carbon, dust, and soil aerosols are completely mixed in the atmosphere under actual conditions and exhibit large differences in optical properties and radiative forcing characteristics. When the SSA increased, the magnitudes of the heating rates of ARF and SRF declined, and the aerosol warming of the atmosphere-surface system shifted to cooling. As previously mentioned, TOA had remarkable seasonal variation with a net negative value in all four seasons. This negative TOA forcing was stronger in summer and autumn than that in spring and winter. In addition, higher amounts of scattered sulfate and nitrate aerosols were noted in summer and autumn over Shandong Peninsula due to the severe regional atmospheric pollution emitted through the region’s flourishing industrialization. However, under both conditions of atmosphere-surface warming and cooling, a substantial amount of solar radiation trapped inside the atmosphere by the ARF is a significant source of heating, particularly within the lower atmosphere ( Li et al., 2010). Such trapping can increase atmospheric stability and influence regional climate and atmospheric environments.
Aerosol optical properties and ARF characteristics showed remarkable seasonal cycles over the Shandong Peninsula in East Asia in recent years. High concentrations of aerosols and strong ARF due to heavy anthropogenic emission were noted. ARF warmed the atmosphere and cooled the surface, which may have increased the atmospheric stability. However, negative forcing values were noted in the atmosphere-surface system, which is dependent on the aerosol components and dominance type such as the abundant anthropogenic sulfate and nitrate aerosols in addition to sea salt aerosol observed in the region. The magnitudes of ARF, SRF, and TOA increased with AOD. The heating rates of ARF and SRF decreased with SSA, whereas the aerosol warming of the atmosphere-surface system shifted to cooling when the SSA was approximately 0.85. Essentially, aerosols cooled the regional atmosphere-surface system by approximately -14 W m-2 per year. Such cooling may offset the greenhouse effect or interfere with regional climate changes.
| 1 |
|
| 2 |
|
| 3 |
|
| 4 |
|
| 5 |
|
| 6 |
|
| 7 |
|
| 8 |
|
| 9 |
|
| 10 |
|
| 11 |
|
| 12 |
|
| 13 |
|
| 14 |
|
| 15 |
|
| 16 |
|
| 17 |
|
| 18 |
|
| 19 |
|
| 20 |
|
| 21 |
|
| 22 |
|
| 23 |
|
| 24 |
|
| 25 |
|
| 26 |
|
| 27 |
|
| 28 |
|
| 29 |
|
| 30 |
|
| 31 |
|
| 32 |
|
| 33 |
|