Bias Correction in Wind Direction Forecasting Using the Circular-Circular Regression Method
XU Jing-Jing1, 2 , HU Fei2  , XIAO Zi-Niu
3, 4 , CHENG Xue-Ling2
, XIAO Zi-Niu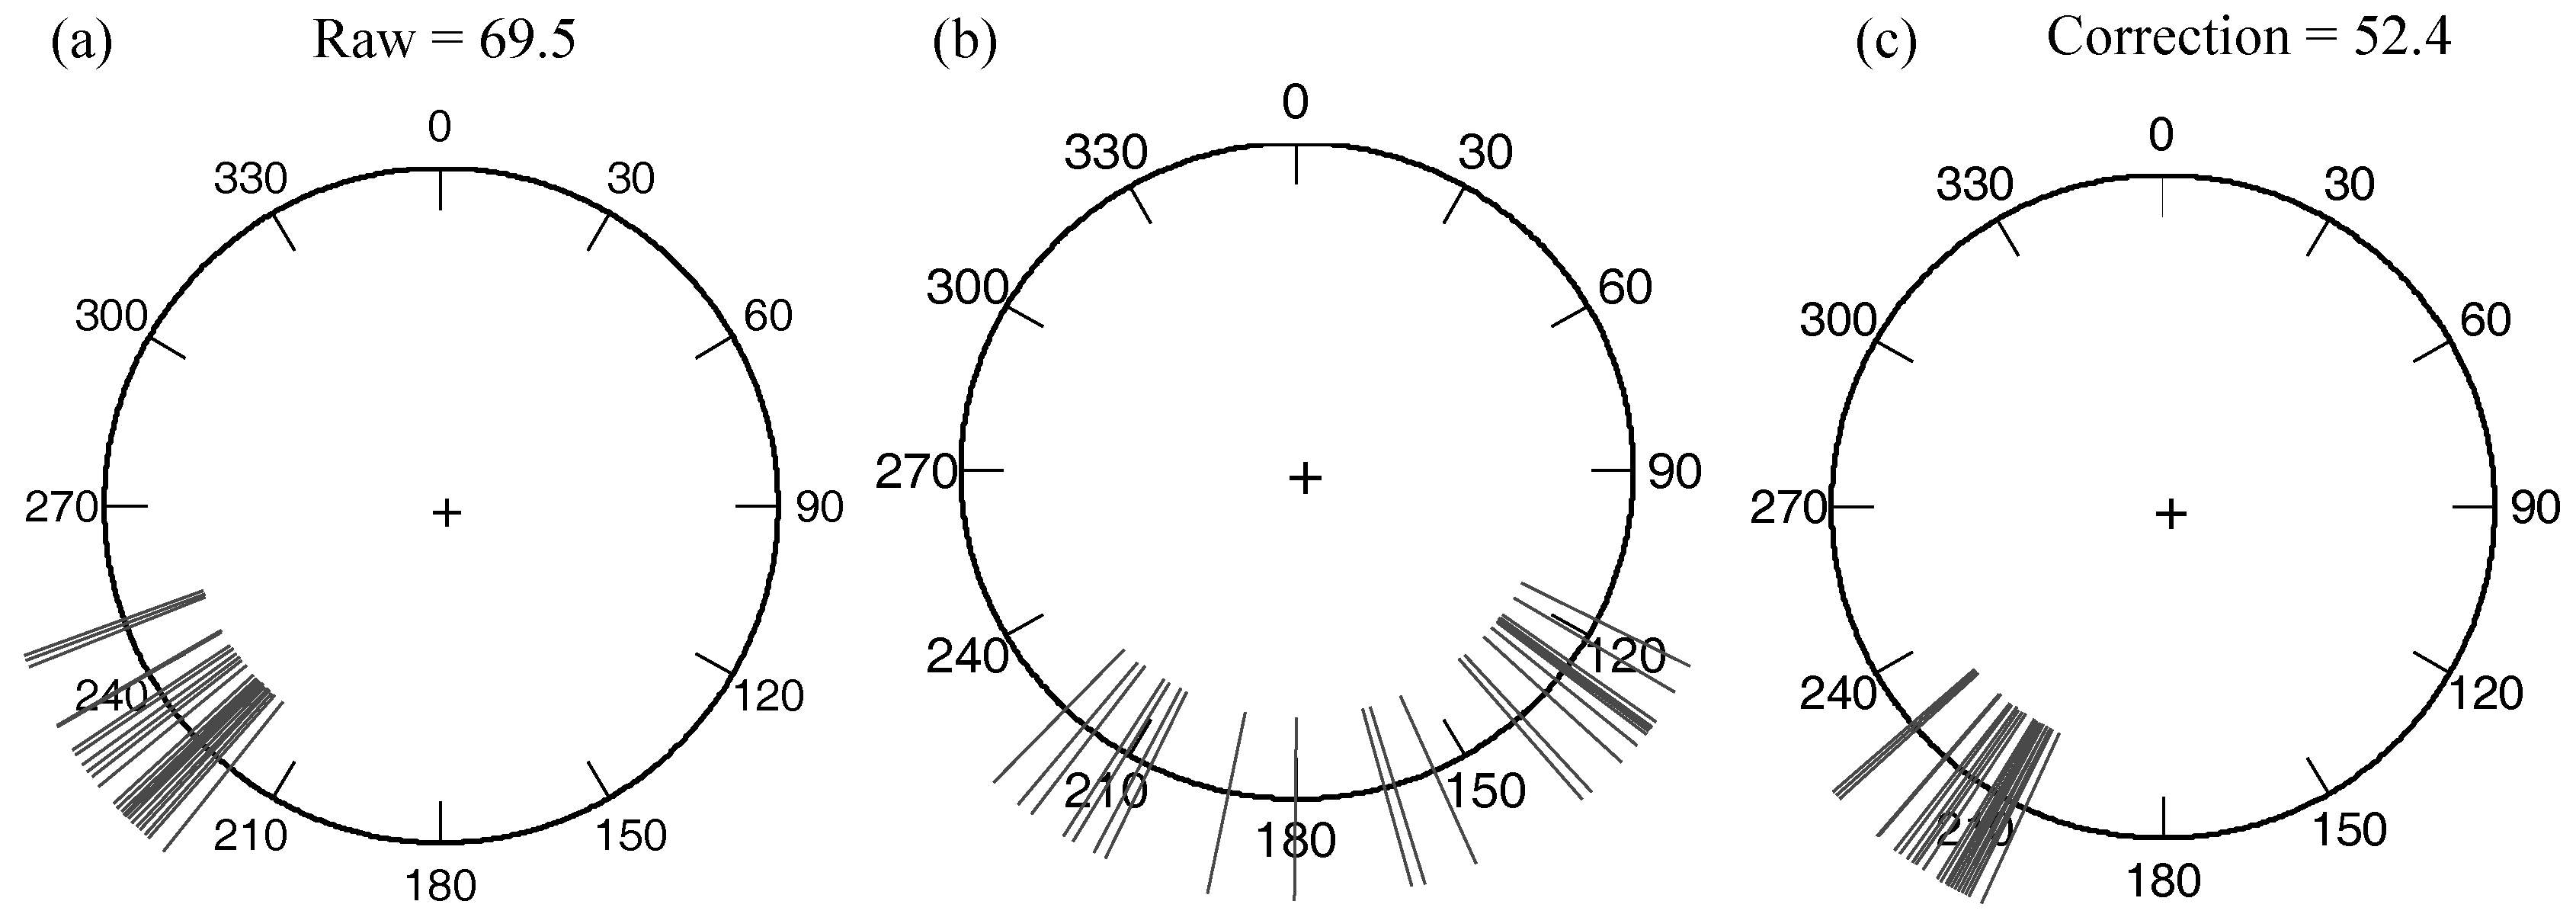
Bias Correction in Wind Direction Forecasting Using the Circular-Circular Regression Method |
|
XU Jing-Jing
, XIAO Zi-Niu |
| Figure 1 Circular diagrams of forecast distributions for wind direction at Yangmeishan wind farm, Yunnan Province, China, measured on 26 November 2011: a raw, b observation, and c bias-corrected. The black lines and graphs represent the forecast distributions. The circular absolute error of the day is shown in degrees. |
| |