Arctic Sea Ice Decline Intensified Haze Pollution in Eastern China
WANG Hui-Jun1, 2, 3  , CHEN Huo-Po
1, 2, 3 , LIU Jiping4
, CHEN Huo-Po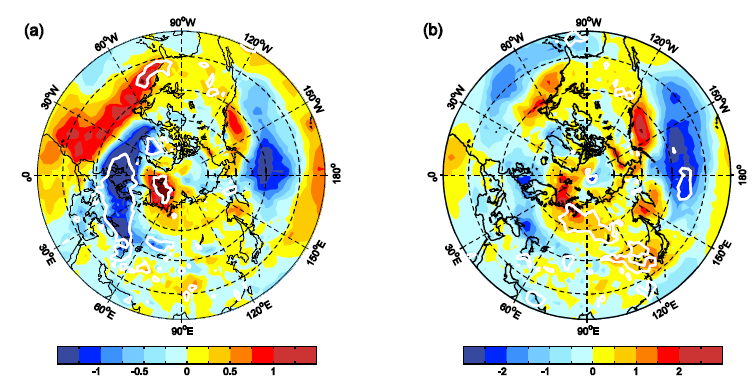
Arctic Sea Ice Decline Intensified Haze Pollution in Eastern China |
|
WANG Hui-Jun
, CHEN Huo-Po |
| Figure 5 Regression maps of near-surface 10 m zonal wind anomalies against the ASI and WHD anomalies during 1979-2008: a ASI and b WHD. The ASI index in a has been multiplied by -1.0 for convenient comparison. The linear trends of the indices and the zonal wind have been removed before the regression analysis. The white line indicated significant regression at 95% confidence level with Student#cod#x02019;s t -test. |
| |