Arctic Sea Ice Decline Intensified Haze Pollution in Eastern China
WANG Hui-Jun1, 2, 3  , CHEN Huo-Po
1, 2, 3 , LIU Jiping4
, CHEN Huo-Po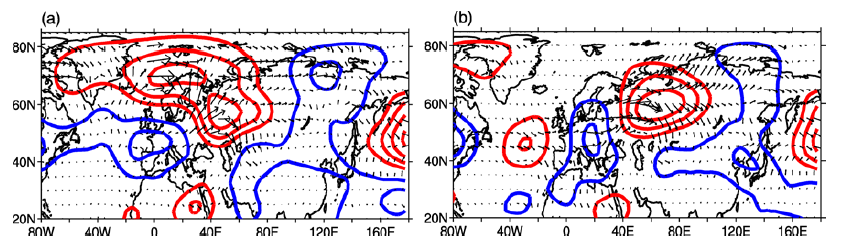
Arctic Sea Ice Decline Intensified Haze Pollution in Eastern China |
|
WANG Hui-Jun
, CHEN Huo-Po |
| Figure 7 Regression maps of the 500 hPa quasi-geostrophic streamfunction contours: 10 6 m 2 s -1 and wave activity flux vectors: m 2 s -2 : a ASI and b WHD. The ASI index in a has been multiplied by -1.0 for convenient comparison. The linear trends have been removed before the regression analysis. The quasi-geostrophic streamfunction and wave activity flux are computed according to Plumb#cod#x02019;s formulation Plumb, 1985 . |
| |