Arctic Sea Ice Decline Intensified Haze Pollution in Eastern China
WANG Hui-Jun1, 2, 3  , CHEN Huo-Po
1, 2, 3 , LIU Jiping4
, CHEN Huo-Po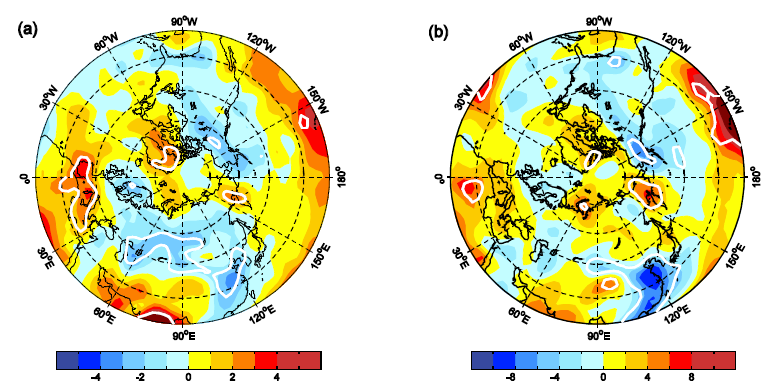
Arctic Sea Ice Decline Intensified Haze Pollution in Eastern China |
|
WANG Hui-Jun
, CHEN Huo-Po |
| Figure 8 Regression maps of the atmospheric stratification stability against the ASI and WHD anomalies during 1979-2008: a ASI and b WHD. The ASI index in a has been multiplied by -1.0 for convenient comparison. Their corresponding linear trends have been removed before the regression analysis. The white line indicated significant regression at 95% confidence level with Student#cod#x02019;s t -test. The atmospheric stratification stability is represented by the K index, which is computed by the following formulation: K = T 850 - T 500 + T d850 - T - T d 700 . T i is the i th level air temperature and T d j is the dew point temperature at the j th level, which is estimated from the relative humidity and the actual air temperature based on the Magnus-Tetens approximation. K index is an integrative indicator of atmosphere stability and the moisture condition, and generally, the large value means more unstable of the atmospheric stratification. |
| |