Arctic Sea Ice Decline Intensified Haze Pollution in Eastern China
WANG Hui-Jun1, 2, 3  , CHEN Huo-Po
1, 2, 3 , LIU Jiping4
, CHEN Huo-Po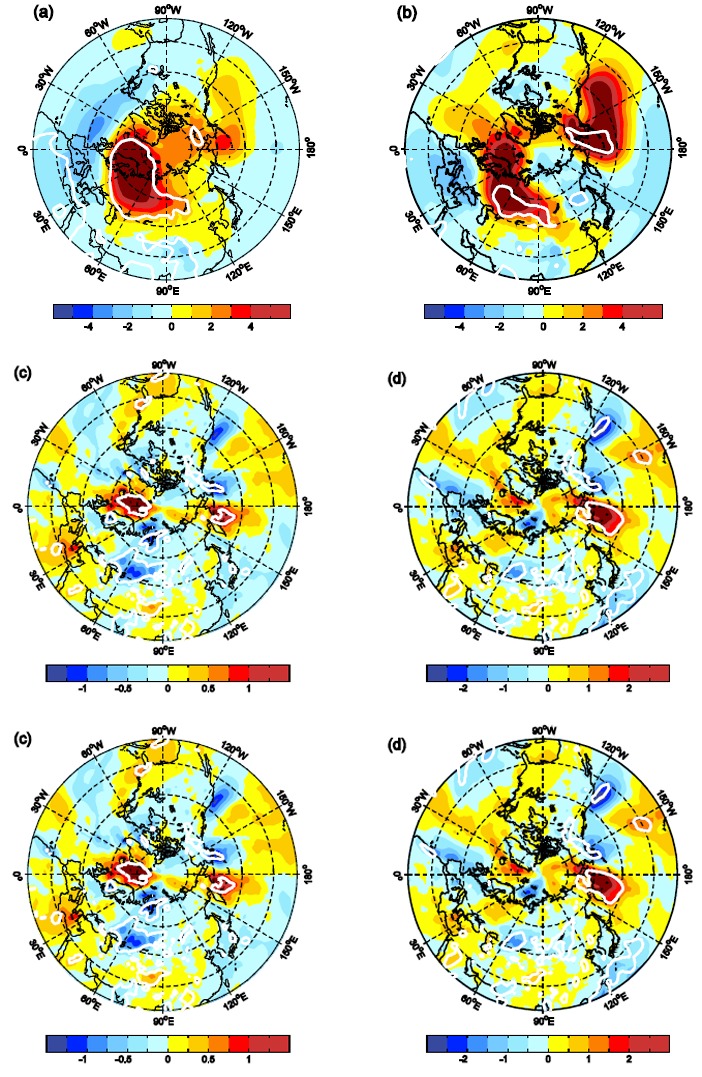
Arctic Sea Ice Decline Intensified Haze Pollution in Eastern China |
|
WANG Hui-Jun
, CHEN Huo-Po |
| Figure 9 Regression maps of the circulations against the ASI and WHD anomalies during 1979-2012. The left column shows the results of ASI and the right column shows the WHD. The top panels show the regression patterns of SLP; the top second panels show the results of the near-surface 10 m meridional wind anomalies; the mid panels shows the near-surface 2 m air temperature; the bottom second panels shows the results of the specific humidity over 850 hPa; and the bottom panels are the results of K index. The ASI index in the left column has been multiplied by -1.0 for convenient comparison. The linear trends of the indices and circulations have been removed before the regression analysis. The circulation data are derived from ERA-Interim. |
| |