Historical Trends in Surface Air Temperature Estimated by Ensemble Empirical Mode Decomposition and Least Squares Linear Fitting
LIN Peng-Fei1  , FENG Xiao-Li
2, 3 , LIU Juan-Juan1
, FENG Xiao-Li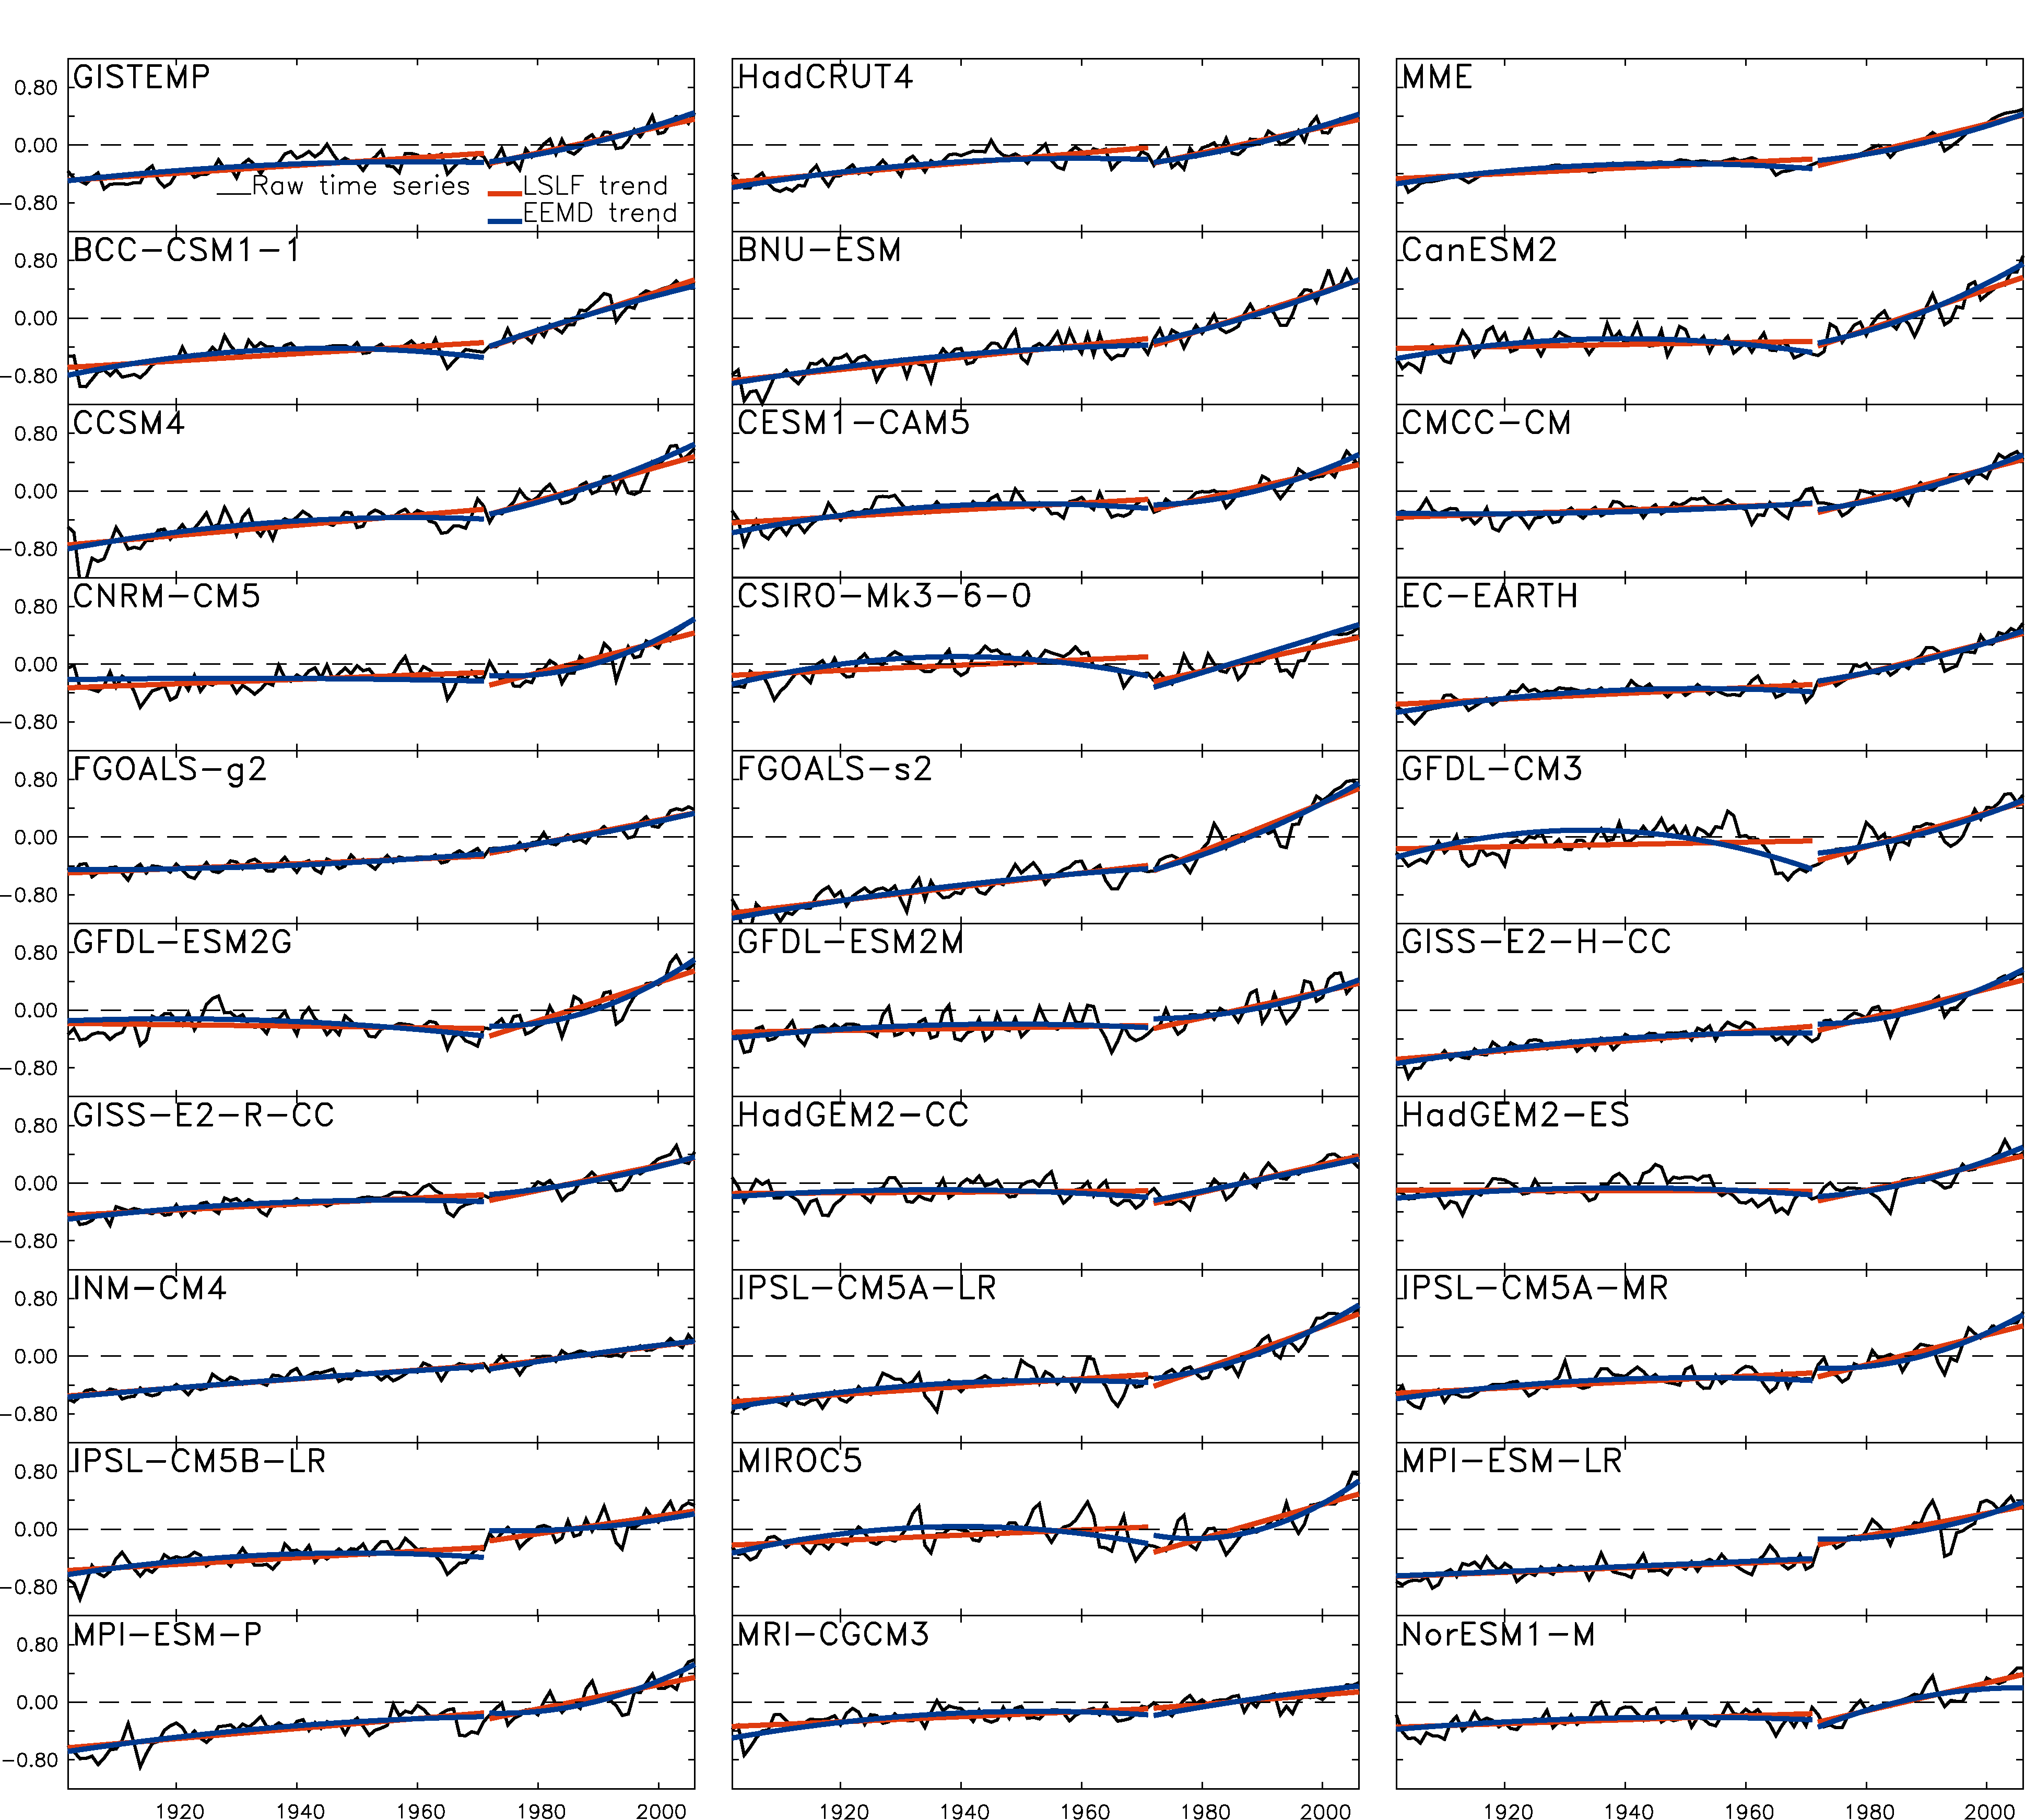
Historical Trends in Surface Air Temperature Estimated by Ensemble Empirical Mode Decomposition and Least Squares Linear Fitting |
|
LIN Peng-Fei
, FENG Xiao-Li |
| Figure 2 Time series black curves of global averaged SAT #cod#x000b0;C annual mean anomalies relative to 1971-2000 and their lines fitted by LSLF red curves and by the EEMD trend component blue curves during the periods of 1901-70 and 1971-2005 in observations from GISTEMP and HadCRUT4, 27 individual models, and the MME. |
| |