Historical Trends in Surface Air Temperature Estimated by Ensemble Empirical Mode Decomposition and Least Squares Linear Fitting
LIN Peng-Fei1  , FENG Xiao-Li
2, 3 , LIU Juan-Juan1
, FENG Xiao-Li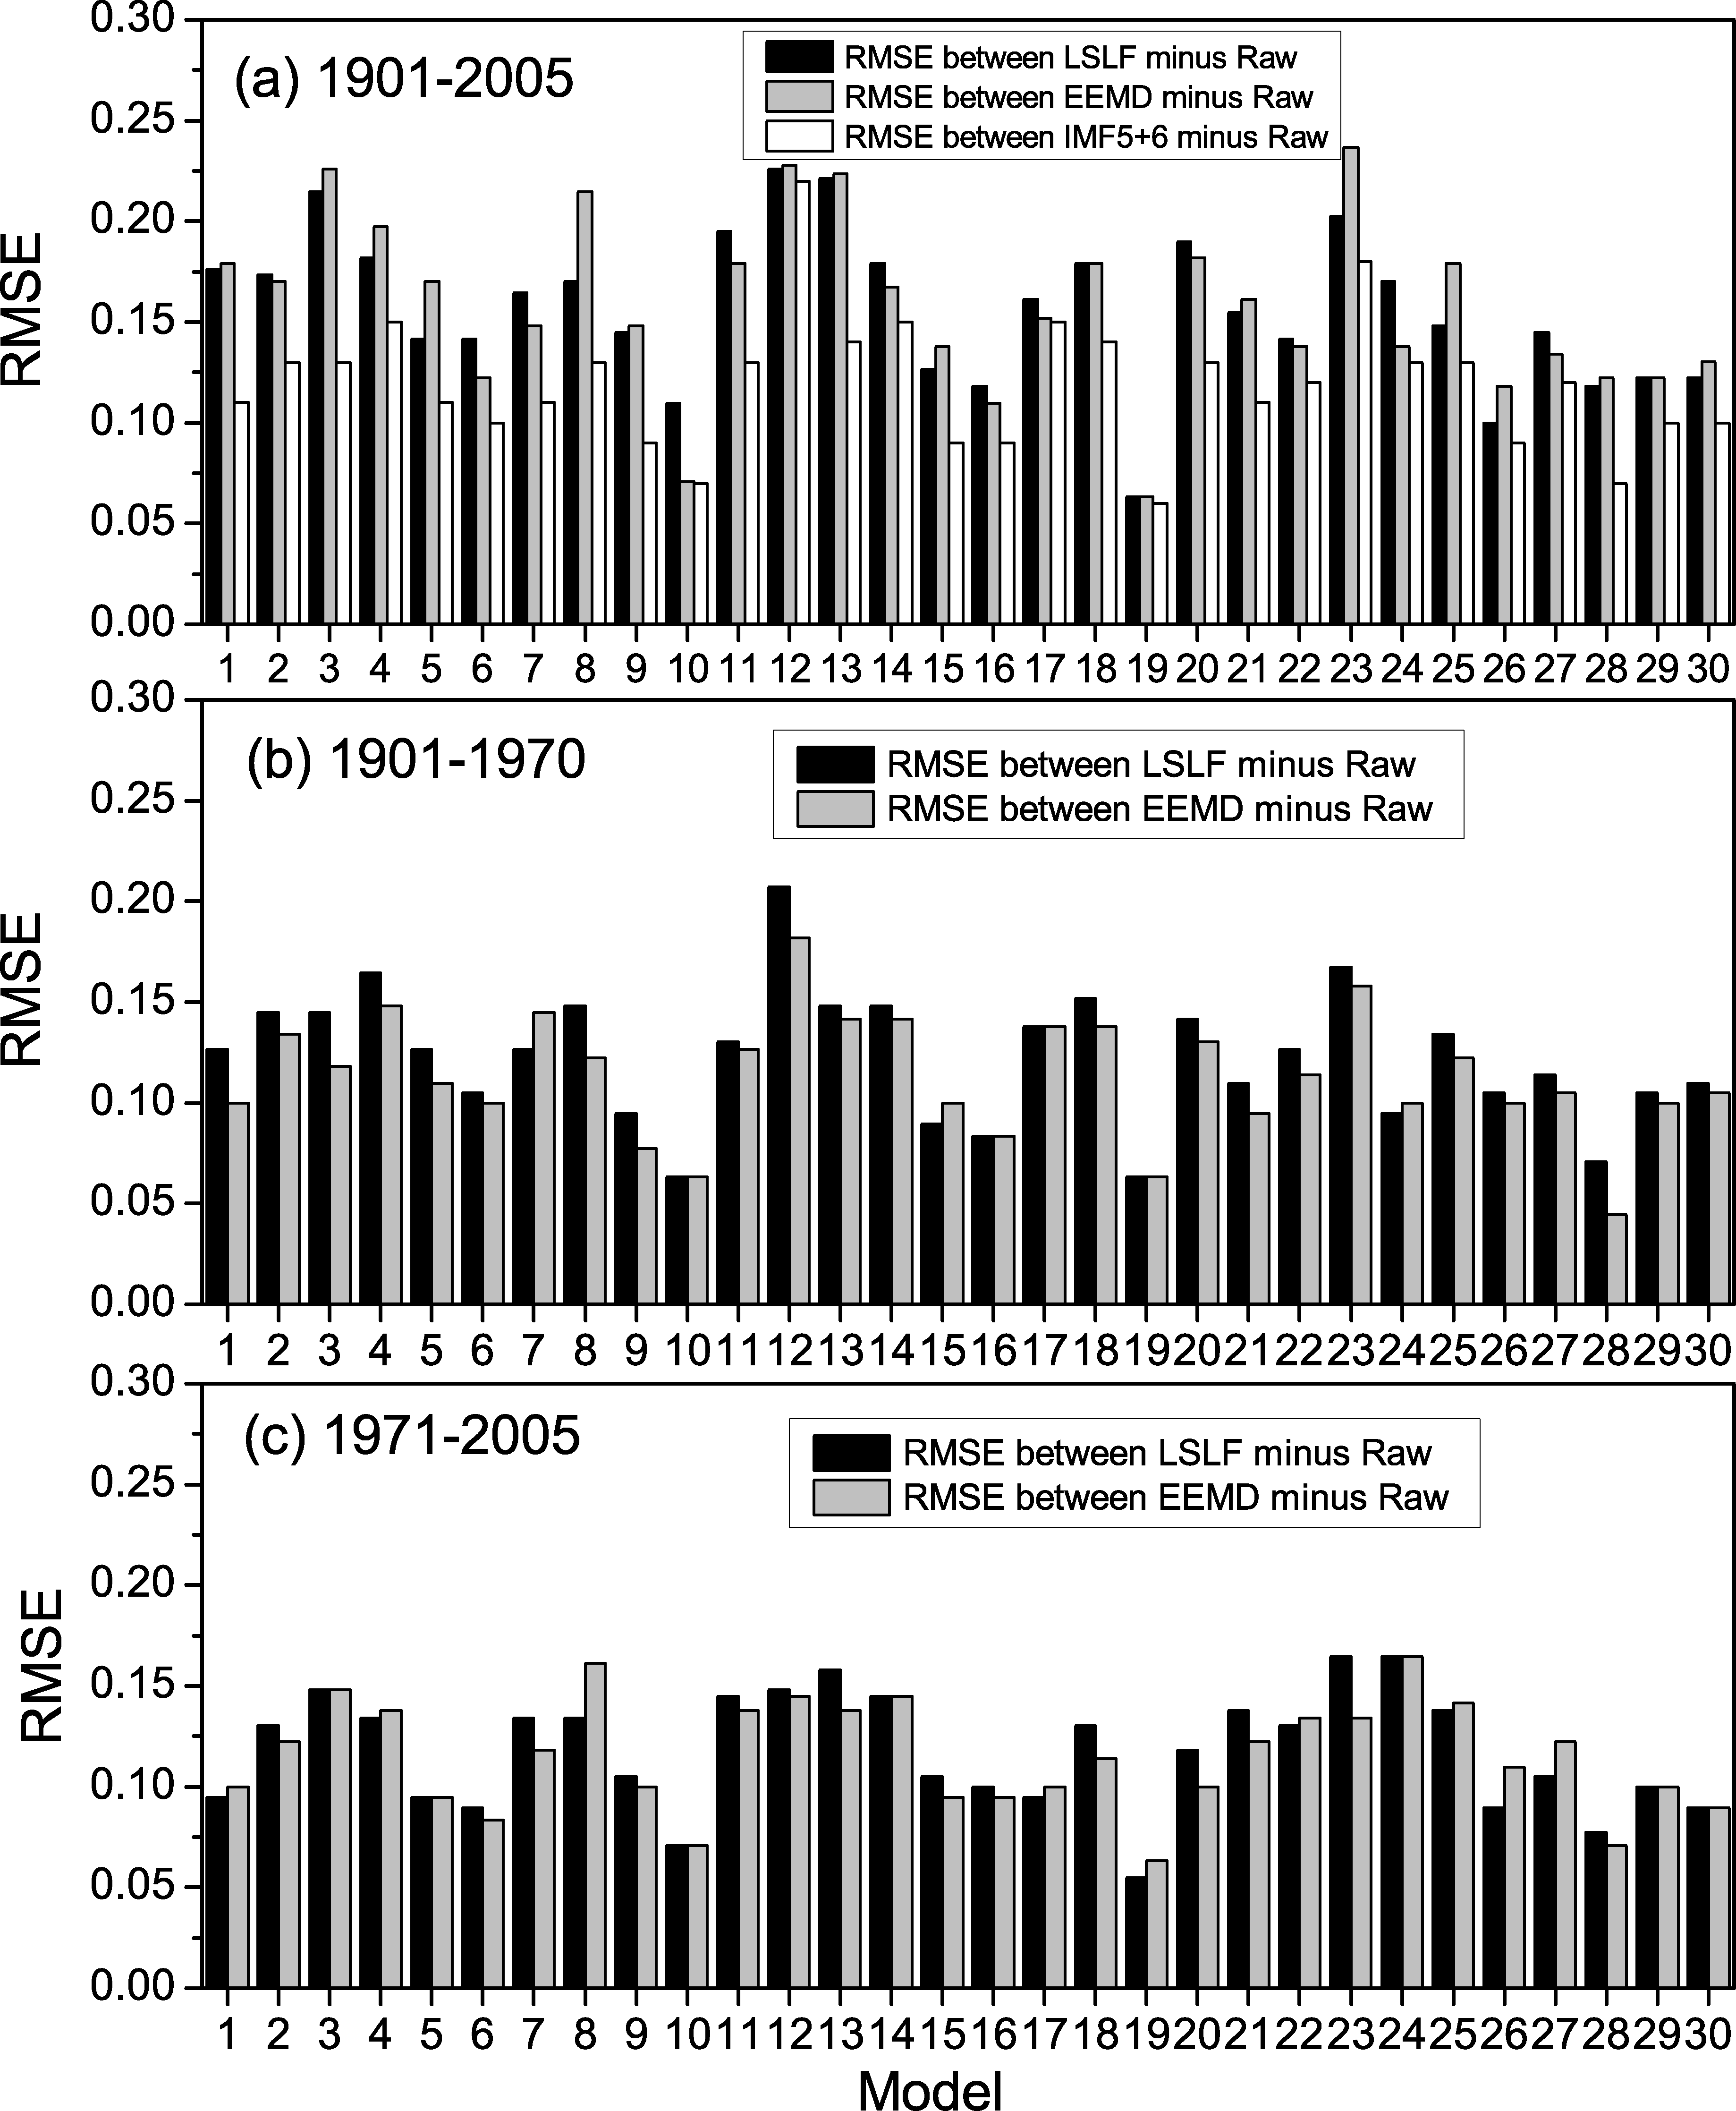
Historical Trends in Surface Air Temperature Estimated by Ensemble Empirical Mode Decomposition and Least Squares Linear Fitting |
|
LIN Peng-Fei
, FENG Xiao-Li |
| Figure 3 RMSEs #cod#x000b0;C between raw time series or lines and the fitted lines of global averaged SAT anomalies during the periods of a 1901-2005, b 1901-70, and c 1971-2005. The x -axes are labeled with the 27 model numbers; the MME is shown in the 28th column; and the observed trends from GISTEMP and HadCRUT4 are shown in the 29th and 30th columns, respectively. Black bars: lines fitted by LSLF minus Raw; gray bars: lines fitted by the EEMD trend minus Raw; white bars: lines fitted by EEMD MDV and trend components minus Raw. |
| |