Updated Homogenized Chinese Temperature Series with Physical Consistency
LI Zhen1 , YAN Zhong-Wei1, *  , WU Hong-Yi
2
, WU Hong-Yi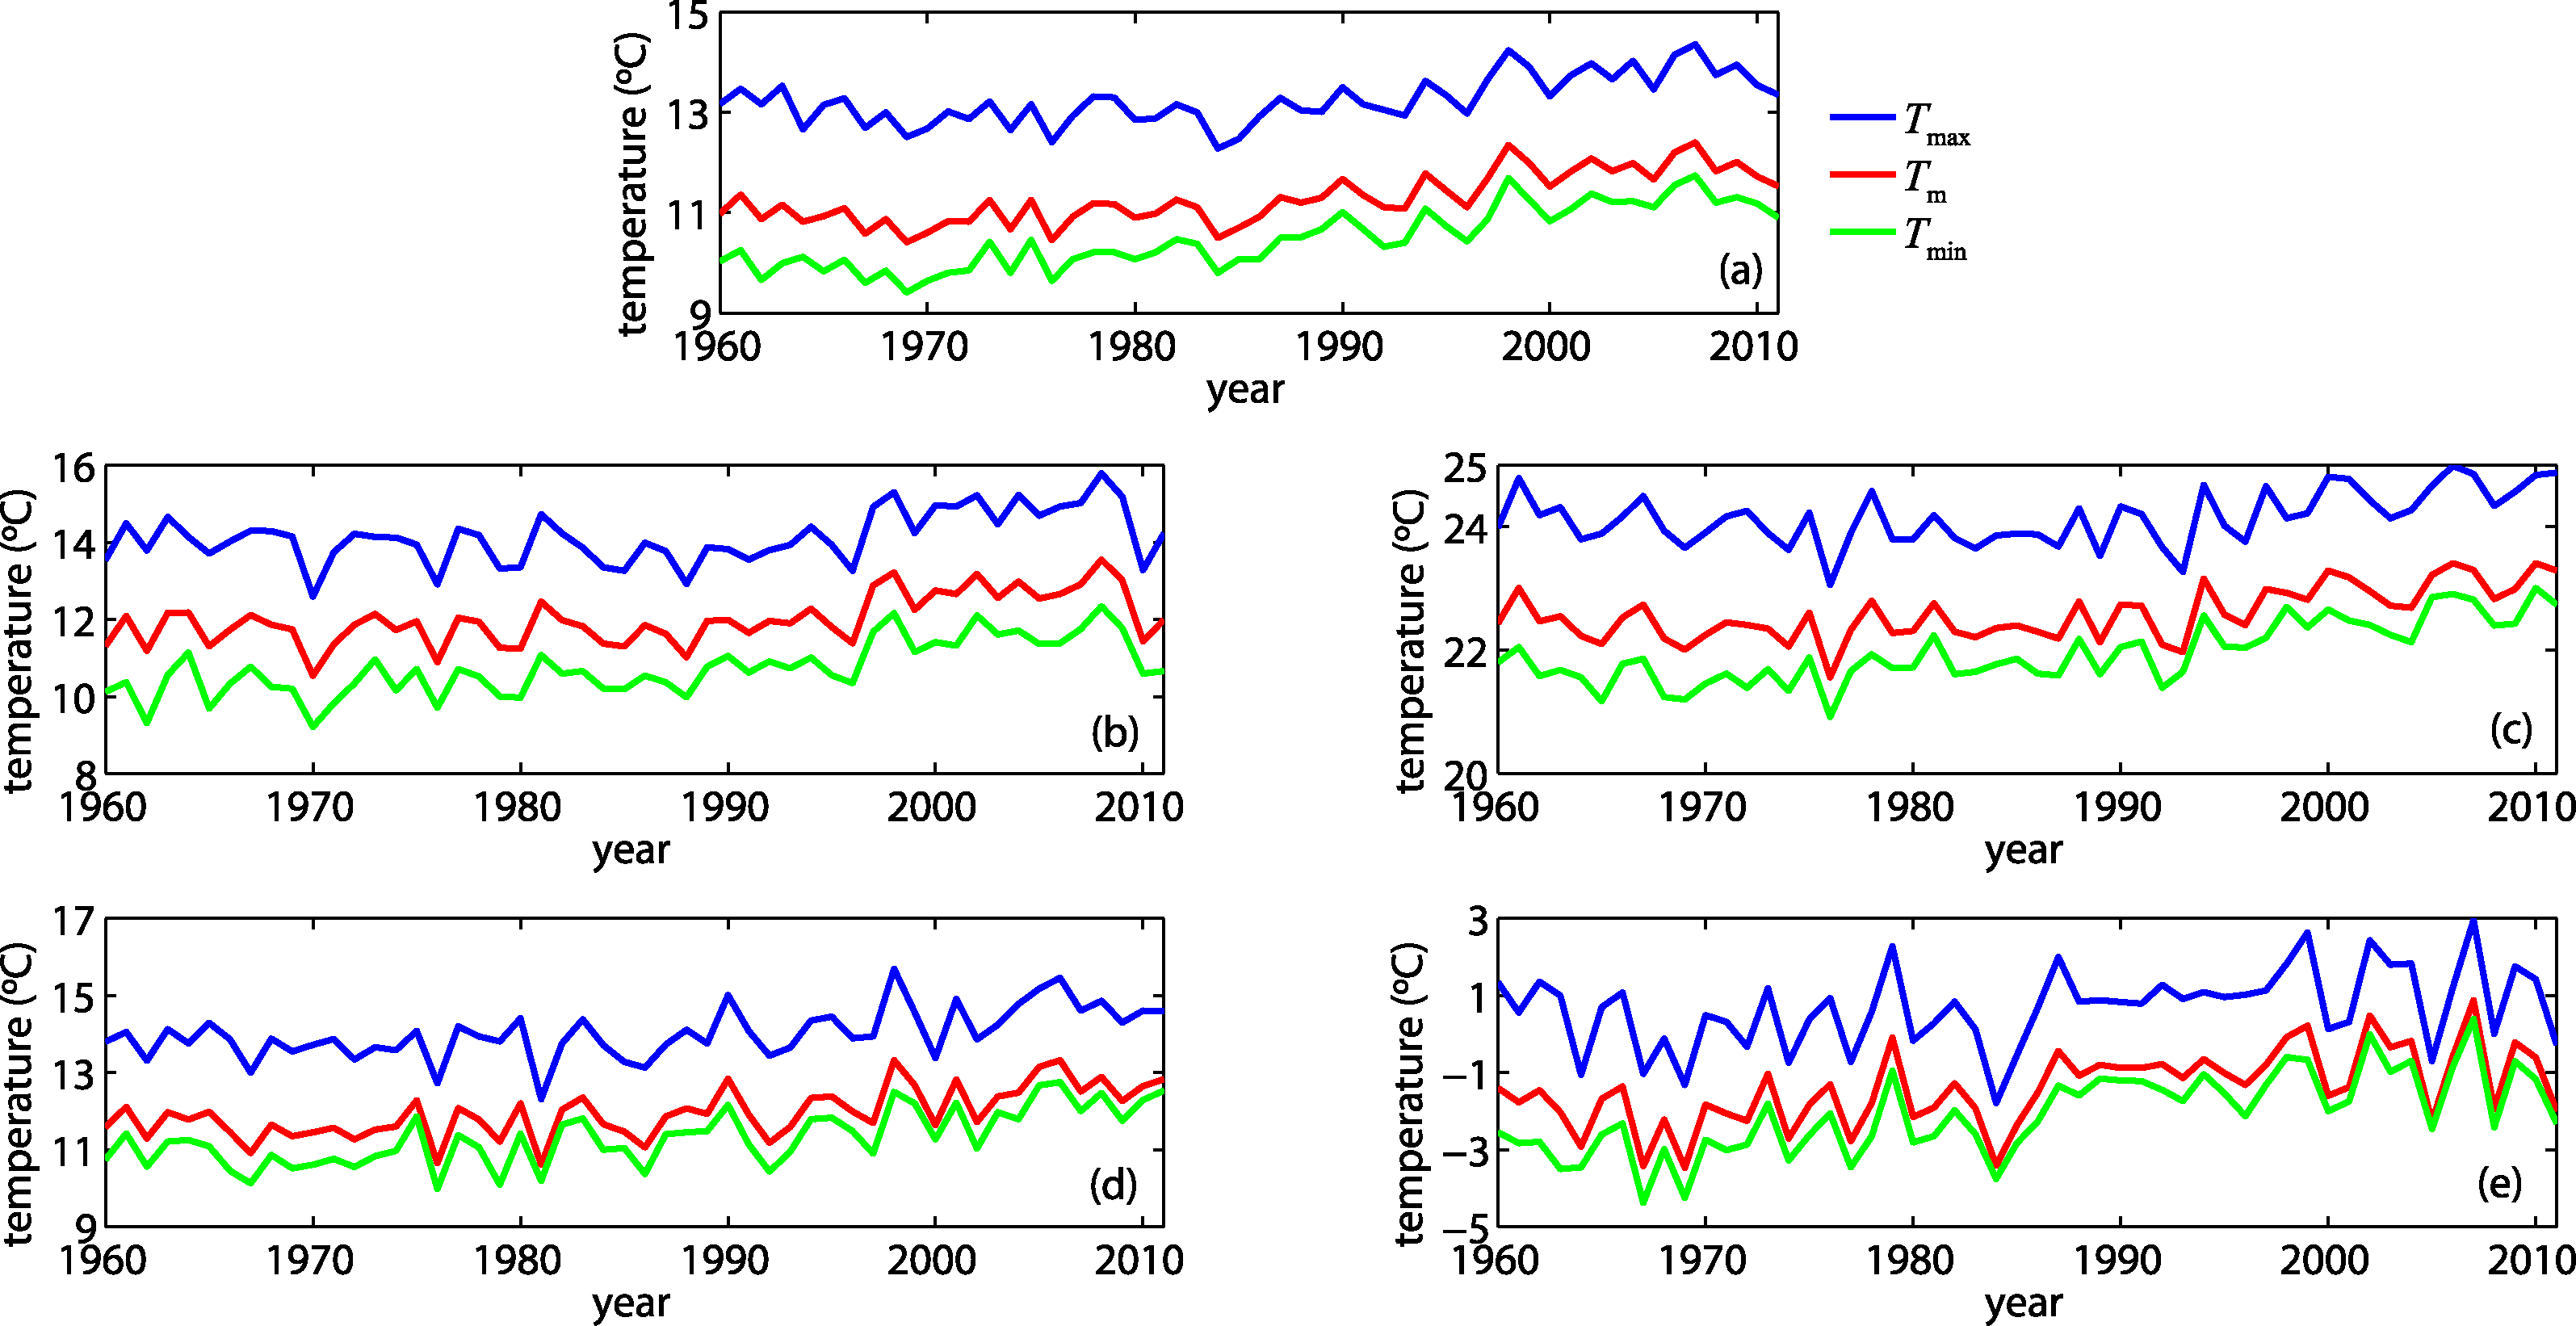
Updated Homogenized Chinese Temperature Series with Physical Consistency |
|
LI Zhen
, WU Hong-Yi |
| Figure 3 China-average a annual, b spring, c summer, d autumn, and e winter T max , T m , and T min series and corresponding linear trends #cod#x000b0;C per decade during 1960-2011, based on the updated homogenized dataset, CHTM2.0. A constant of 4#cod#x000b0;C is added to taken from the series of T min T max to make the figures compact. |
| |