Updated Homogenized Chinese Temperature Series with Physical Consistency
LI Zhen1 , YAN Zhong-Wei1, *  , WU Hong-Yi
2
, WU Hong-Yi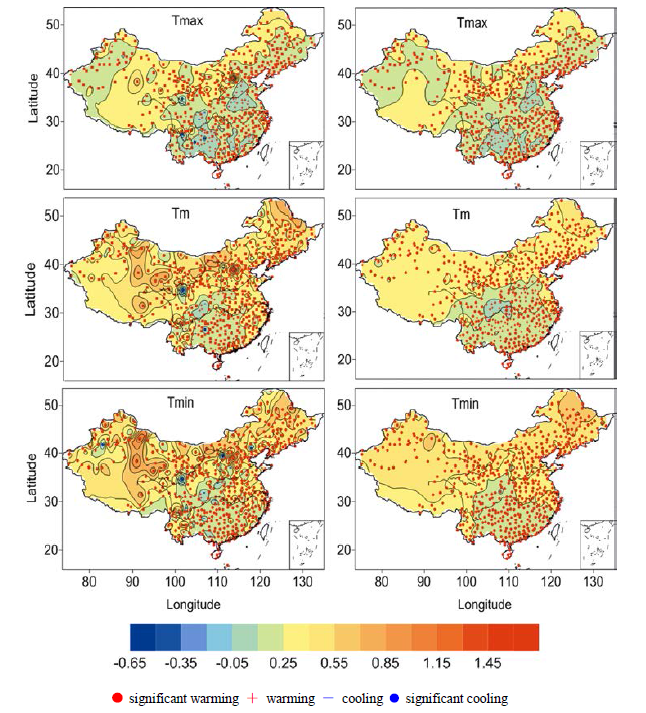
Updated Homogenized Chinese Temperature Series with Physical Consistency |
|
LI Zhen
, WU Hong-Yi |
| Figure 4 Linear trends #cod#x000b0;C per decade in annual T m T max T min series at 545 stations during 1960-2011, compared between the original left column and adjusted right column data. |
| |