
The Asymmetry of Subsurface Temperature Anomalies Associated with ENSO in the Equatorial Western Pacific
[HUA Li-Juan1, 2 , YU Yong-Qiang1, *  ]
]
]
|
|


The phenomenon of ENSO asymmetry has been recognized for many years, but most studies have focused on the asymmetry of surface temperature anomalies in the equatorial eastern Pacific. Here, the authors investigate the temperature asymmetry associated with ENSO in the subsurface of the western Pacific through analysis of observations and numerical experiments with an ocean GCM. Both the observation and simulation exhibit significant ENSO asymmetry, characterized by negative temperature skewness in the equatorial western Pacific and positive skewness in the eastern Pacific. Heat budget analysis reveals that nonlinear dynamical heating results in the positive temperature asymmetry in the equatorial eastern Pacific, but tends to weaken the negative temperature asymmetry in the equatorial western Pacific. The climatological meridional current transports the temperature anomalies and corresponding negative asymmetry from the off-equator region to the equator in the subsurface of the western Pacific. Through a sensitivity experiment with reversed wind stress forcing, the authors suggest that the skewness of the wind stress anomalies does not contribute to the negative temperature asymmetry in the western Pacific in the first-order approximation, while the internal nonlinear dynamics does play a key role. The study suggests that, as a result of nonlinear processes, the oceanic responses to anomalous wind stress are nonlinear and asymmetric in the tropical Pacific.
The fact that the warm and cold events of ENSO are not precisely opposite has been a recognized asymmetry for many years. Both the strength and duration of El Niñ o events are significantly different to those of La Niñ a events (Okumura et al., 2011). Since the 1980s, the observed ENSO asymmetry has strengthened; hence, it is proposed that the ENSO asymmetry is associated with decadal variability in the tropical Pacific (An, 2004). Recent studies based on numerical models have suggested that decadal climate shift is partly attributable to the time-mean effect of ENSO because of the asymmetry between warm and cold episodes (Rodgers et al., 2004). A positive (negative) temperature asymmetry implies that the strengths of warm (cold) anomalies are larger than those of cold (warm) anomalies.
The physical mechanism responsible for a positive temperature asymmetry in the equatorial eastern Pacific associated with ENSO events was first identified by Jin et al. (2003), and then further investigated in subsequent studies (e.g., An and Jin, 2004; Duan and Mu, 2006; Duan et al., 2008; Su et al., 2010). An and Jin (2004) showed that nonlinear dynamical heating (NDH) estimated from ocean reanalysis data plays a crucial role in the asymmetry and found that the vertical component makes an important contribution. Based on updated reanalysis datasets, Su et al. (2010) showed that the zonal term dominated by the geostrophic current and meridional term resulting from the Ekman current favor a positive temperature asymmetry in the far eastern Pacific. In addition, Vialard et al. (2001) proposed that ENSO asymmetry might be enhanced by oceanic tropical instability waves, and Timmermann and Jin (2002) proposed that biogeochemical processes (phytoplankton blooms-vertical redistribution of heat) might also favor ENSO asymmetry.
To date, most studies have focused on the positive temperature asymmetry in the equatorial eastern Pacific; very few studies have investigated the negative temperature asymmetry in the subsurface of the western Pacific (e.g., Rodgers et al., 2004; Choi et al., 2012), which is comparable to that in the eastern Pacific (Fig. 1). However, why the negative temperature asymmetry occurs in the western Pacific is poorly understood.
Due to the nonlinear dependence of convective precipitation on SST, the atmospheric responses to the same SST anomalies with opposite sign are asymmetric (Kang and Kug, 2002). Given that ENSO is asymmetric, warm SST anomalies are usually stronger than cold ones. Thus, anomalies in atmospheric circulation should be more asymmetric (Wu et al., 2010), which might in turn reinforce the original SST asymmetry. Therefore, both the internal dynamic processes, such as NDH in the upper ocean, and external forcing, such as wind stress, may contribute to ENSO asymmetry, but these features have yet to be clearly identified.
This paper attempts to address two important issues related to ENSO asymmetry: whether NDH contributes to the negative temperature asymmetry in subsurface temperature anomalies in the western Pacific, as it does in the eastern Pacific; and whether the responses of temperature anomalies to wind stress in the western Pacific are linear and symmetric.
In order to explore the mechanism responsible for ENSO asymmetry, we design several numerical experiments with an ocean GCM based on the primitive equations. The model is version 2 of the State Key Laboratory of Numerical Modeling for Atmospheric Sciences and Geophysical Fluid Dynamics/Institute of Atmospheric Physics (LASG/IAP) Climate Ocean Model (LICOM2.0), which has been widely applied in many studies (e.g., Liu et al., 2004; Yu et al., 2011). The model’ s dynamical framework is based on a latitude-longitude grid system with 1° β × β 1° horizontal resolution, but the meridional resolution increases to 0.5° between 10° S and 10° N, and there are 30 layers with 15 equal-depth levels in the upper 150 m. In this study, the model is configured with realistic topography, except that the North Pole is set up as an isolated island. The model can reproduce well the basic temporal and spatial structures of the observed ENSO, especially the significant ENSO asymmetry (Fig. 1). Using climatological monthly-mean wind stress, LICOM2.0 is first integrated from a motionless state to an equilibrium state through a 500-yr spin up. The end state of year 500 is then used as the initial condition for the numerical experiments described below.
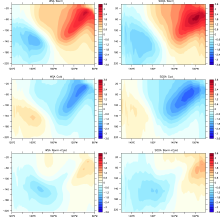
 | Figure 1 Equatorial upper ocean temperature anomalies of ENSO (2° N-2° S): (top panels) warm phase, (middle panels) cold phase, and (bottom panels) residual (warm+cold) in Wind Stress Anomaly (WSA) (left) and Simple Ocean Data Assimilation (SODA) (right) (units:° C). |
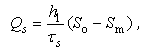
In order to evaluate the model’ s ability to delineate ENSO variability and further understand the mechanism responsible for ENSO asymmetry, one control and one sensitivity run are designed. The control run is integrated for 44 years with climatological winds and heat flux from the Ocean Model Intercomparison Project (OMIP) (Roeske, 2001), and with the SST and salinity restored to the Levitus94 datasets (Levitus and Boyer, 1994; Levitus et al., 1994), as described by Liu et al. (2004). Specifically, the restored boundary conditions contain
and


In the sensitivity run— hereafter referred to as the wind stress anomaly (WSA) experiment— the surface winds are climatological winds plus the interannual monthly anomalies, and the surface boundary conditions for temperature and salinity are kept as they are in the control run. The sensitivity run is the same as that in Sun et al. (2014); the interannual monthly anomalies of 1958-2001 from the European Center for Medium-Range Weather Forecasts 40-yr reanalysis (ERA40) (Uppala et al., 2005) over the tropical Pacific (30° N-30° S, 120° E-80° W) are superimposed on the climatological surface winds. It is important to note that, due to the restoring of the boundary conditions, the simulated surface temperature and salinity are restored to the climatological mean value with a seasonal cycle. Therefore, in a negative feedback process, the restored boundary conditions have a damping effect on any perturbations of SST and salinity that deviate from the climatological mean state. Consequently, the anomalies of temperature, as well as other variables, and also their skewness, can only result from the wind stress forcing or the ocean dynamical process in the numerical experiments.
So, in order to quantify the relative contributions of wind stress forcing and ocean dynamics to the temperature asymmetry, we design a new group of further simplified experiments that we name W97 and W97_R. W97 is similar to WSA, except that the external forcing is the averaged 1997-98 December-January-February (DJF) wind stress anomalies plus climatological winds. Furthermore, the wind stress anomalies are reversed in W97_R. The 1997-98 El Niñ o is the strongest El Niñ o event among instrumental records, and so we choose the wind stress anomalies at the peak of this event to force our ocean model. To enable discussion on whether the oceanic response related to the easterly and westerly wind stresses of equivalent strength is symmetric, both of the experiments are integrated for five years based on the fixed wind stress anomalies. Simple Ocean Data Assimilation (SODA) reanalysis data (Carton and Giese, 2008) are compared with the simulations.
The composites of the warm and cold phase temperature anomalies are shown in Fig. 1 together with their residuals as a measure of the ENSO asymmetry. Figure 1 provides the subsurface condition, in which the selected El Niñ o events are estimated as the 100 warmest months for the Niñ o3 region, and likewise the chosen La Niñ a events are from the 100 coldest months for the Niñ o3 region. In this way, we can obtain the same amount of both events, and thus the composite analysis is more reasonable. The major characteristics of the spatial pattern of the temperature anomalies are simulated well in the warm/cold phase, as well as in the residual. The negative temperature anomalies are found in the residual in the equatorial western Pacific, while the opposite situation is shown in the equatorial eastern Pacific. The model underestimates the positive temperature anomalies in the residual. However, the simulated magnitude (-1.5° C) of the largest negative temperature anomalies, located at (140 m, 180° E), is identical with SODA. In general, the ocean model captures the major pattern of the observed asymmetry, implying that the model has enough ability to reproduce ENSO asymmetry and can be used as an effective tool to explore its physical mechanism.
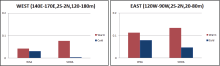
In order to examine whether NDH also contributes to the negative asymmetry in subsurface temperature in the western Pacific, as it does in the eastern Pacific, we choose the regions with typically the strongest asymmetry in the western and eastern Pacific based on the warm/cold phase temperature anomalies from WSA (Fig. 1). The western region is located at (2° N-2° S, 140° E-170° E) between 120 m and 180 m, and the eastern region is located at (2° N-2° S, 120° W-90° W) between 20 m and 80 m. NDH is defined as
 | Figure 2 NDH averaged over the region (2° N-2° S, 140° E-170° E) between 120 m and 180 m (left), and over the region (2° N-2° S, 120° W-90° W) between 20 m and 80 m (right) for the warm phase (red) and cold phase (blue) in WSA and SODA (units: ° C per month). |
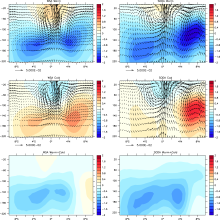
Therefore, it is necessary to explore what mechanism works for the negative temperature asymmetry. Figure 3 shows the composites of the warm and cold phase temperature anomalies together with their residuals averaged between 120° E and 160° W. The large-scale pattern in WSA is in line with the observation, both showing that there are two centers of negative (positive) temperature anomalies in the off-equatorial region in the warm (cold) phase. It is interesting that the strongest asymmetry is not located exactly at the equator, but off-equator in the western Pacific. moreover, the maximum asymmetry from the observation seems to be farther poleward than in the simulation. For instance, in the warm phase the negative centers are located at (160 m, 4° S) and (140 m, 4° N) for WSA, with extreme values of -1.6° C and -1.6° C; while for SODA, the negative centers are located at (180 m, 4° S) and (120 m, 6° N), with extreme values of -1.4° C and -2.0° C. In the cold phase, the positive centers are located at (160 m, 4° S) and (140 m, 5° N) for WSA, with extreme values of 0.8° C and 1.0° C; while for SODA, the positive centers are located at (160 m, 4° S) and (120 m, 8° N), with extreme values of 0.4° C and 1.6° C. In the residuals, the negative centers are located at (160 m, 4° S) and (140 m, 3° N) for WSA, with extreme values of -1.0° C and -1.0° C; while for SODA, the negative centers are located at (160 m, 4° S) and (160 m, 4° N), with extreme values of -1.2° C and -1.2° C. The location of the negative center in Fig. 3c is close to that in Fig. 1c. Therefore, we may infer that the temperature asymmetry probably originates in the subsurface off-equatorial region.
 | Figure 3 Temperature anomalies averaged in the western Pacific Ocean (120° E-160° W) and the corresponding climatological mean current for the (top panels) warm phase, (middle panels) cold phase, and (bottom panels) residual (warm+cold) in WSA (left panels) and SODA (right panels) (units: ° C). Units for the mean meridional currents (V) and vertical currents (W) are 1 and 0.0001 m s-1, respectively. |
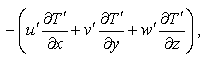
To investigate how the negative temperature asymmetry reaches the equator, the climatological mean currents are exhibited in Fig. 3. It is clear that the mean meridional currents converge toward the equator, thus enabling advection of the negative temperature asymmetry to the region. Further heat budget analysis shows that 

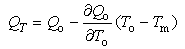
It should be noted that the observed wind stress is also asymmetric, in which the amplitude of the westerly anomaly is much stronger than that of the easterly one (not shown) in the tropical Pacific. Thus, it is natural to question if the negative-skewed temperature in the ocean results from the skewness of the wind stress or nonlinear dynamics. If it is the latter, the response of the oceanic circulation to wind stress should be nonlinear. The results of the W97 and W97_R experiments are used to examine this issue. Figure 4 shows the sum of the temperature anomalies from the W97 and W97_R experiments, in which the anomalies are defined as the difference between the sensitivity runs (W97 and W97_R) and the control run. As the wind stress anomalies in these two sensitivity runs are identical except for their sign, if the oceanic response to the wind stress anomalies is linear, the anomalies from W97-control should be equal to those from W97_R-control, but with opposite sign. However, the composites in Fig. 4 show a significant “ non-zero” characteristic, so it is clear that the dynamical responses to the wind stress anomalies of the same magnitude but with opposite sign are asymmetric, which means that the nonlinear dynamics should not be ignored. Thus, the nonlinear dynamics should be responsible for the negative temperature asymmetry in the first-order approximation, not the skewness of the wind stress anomalies.
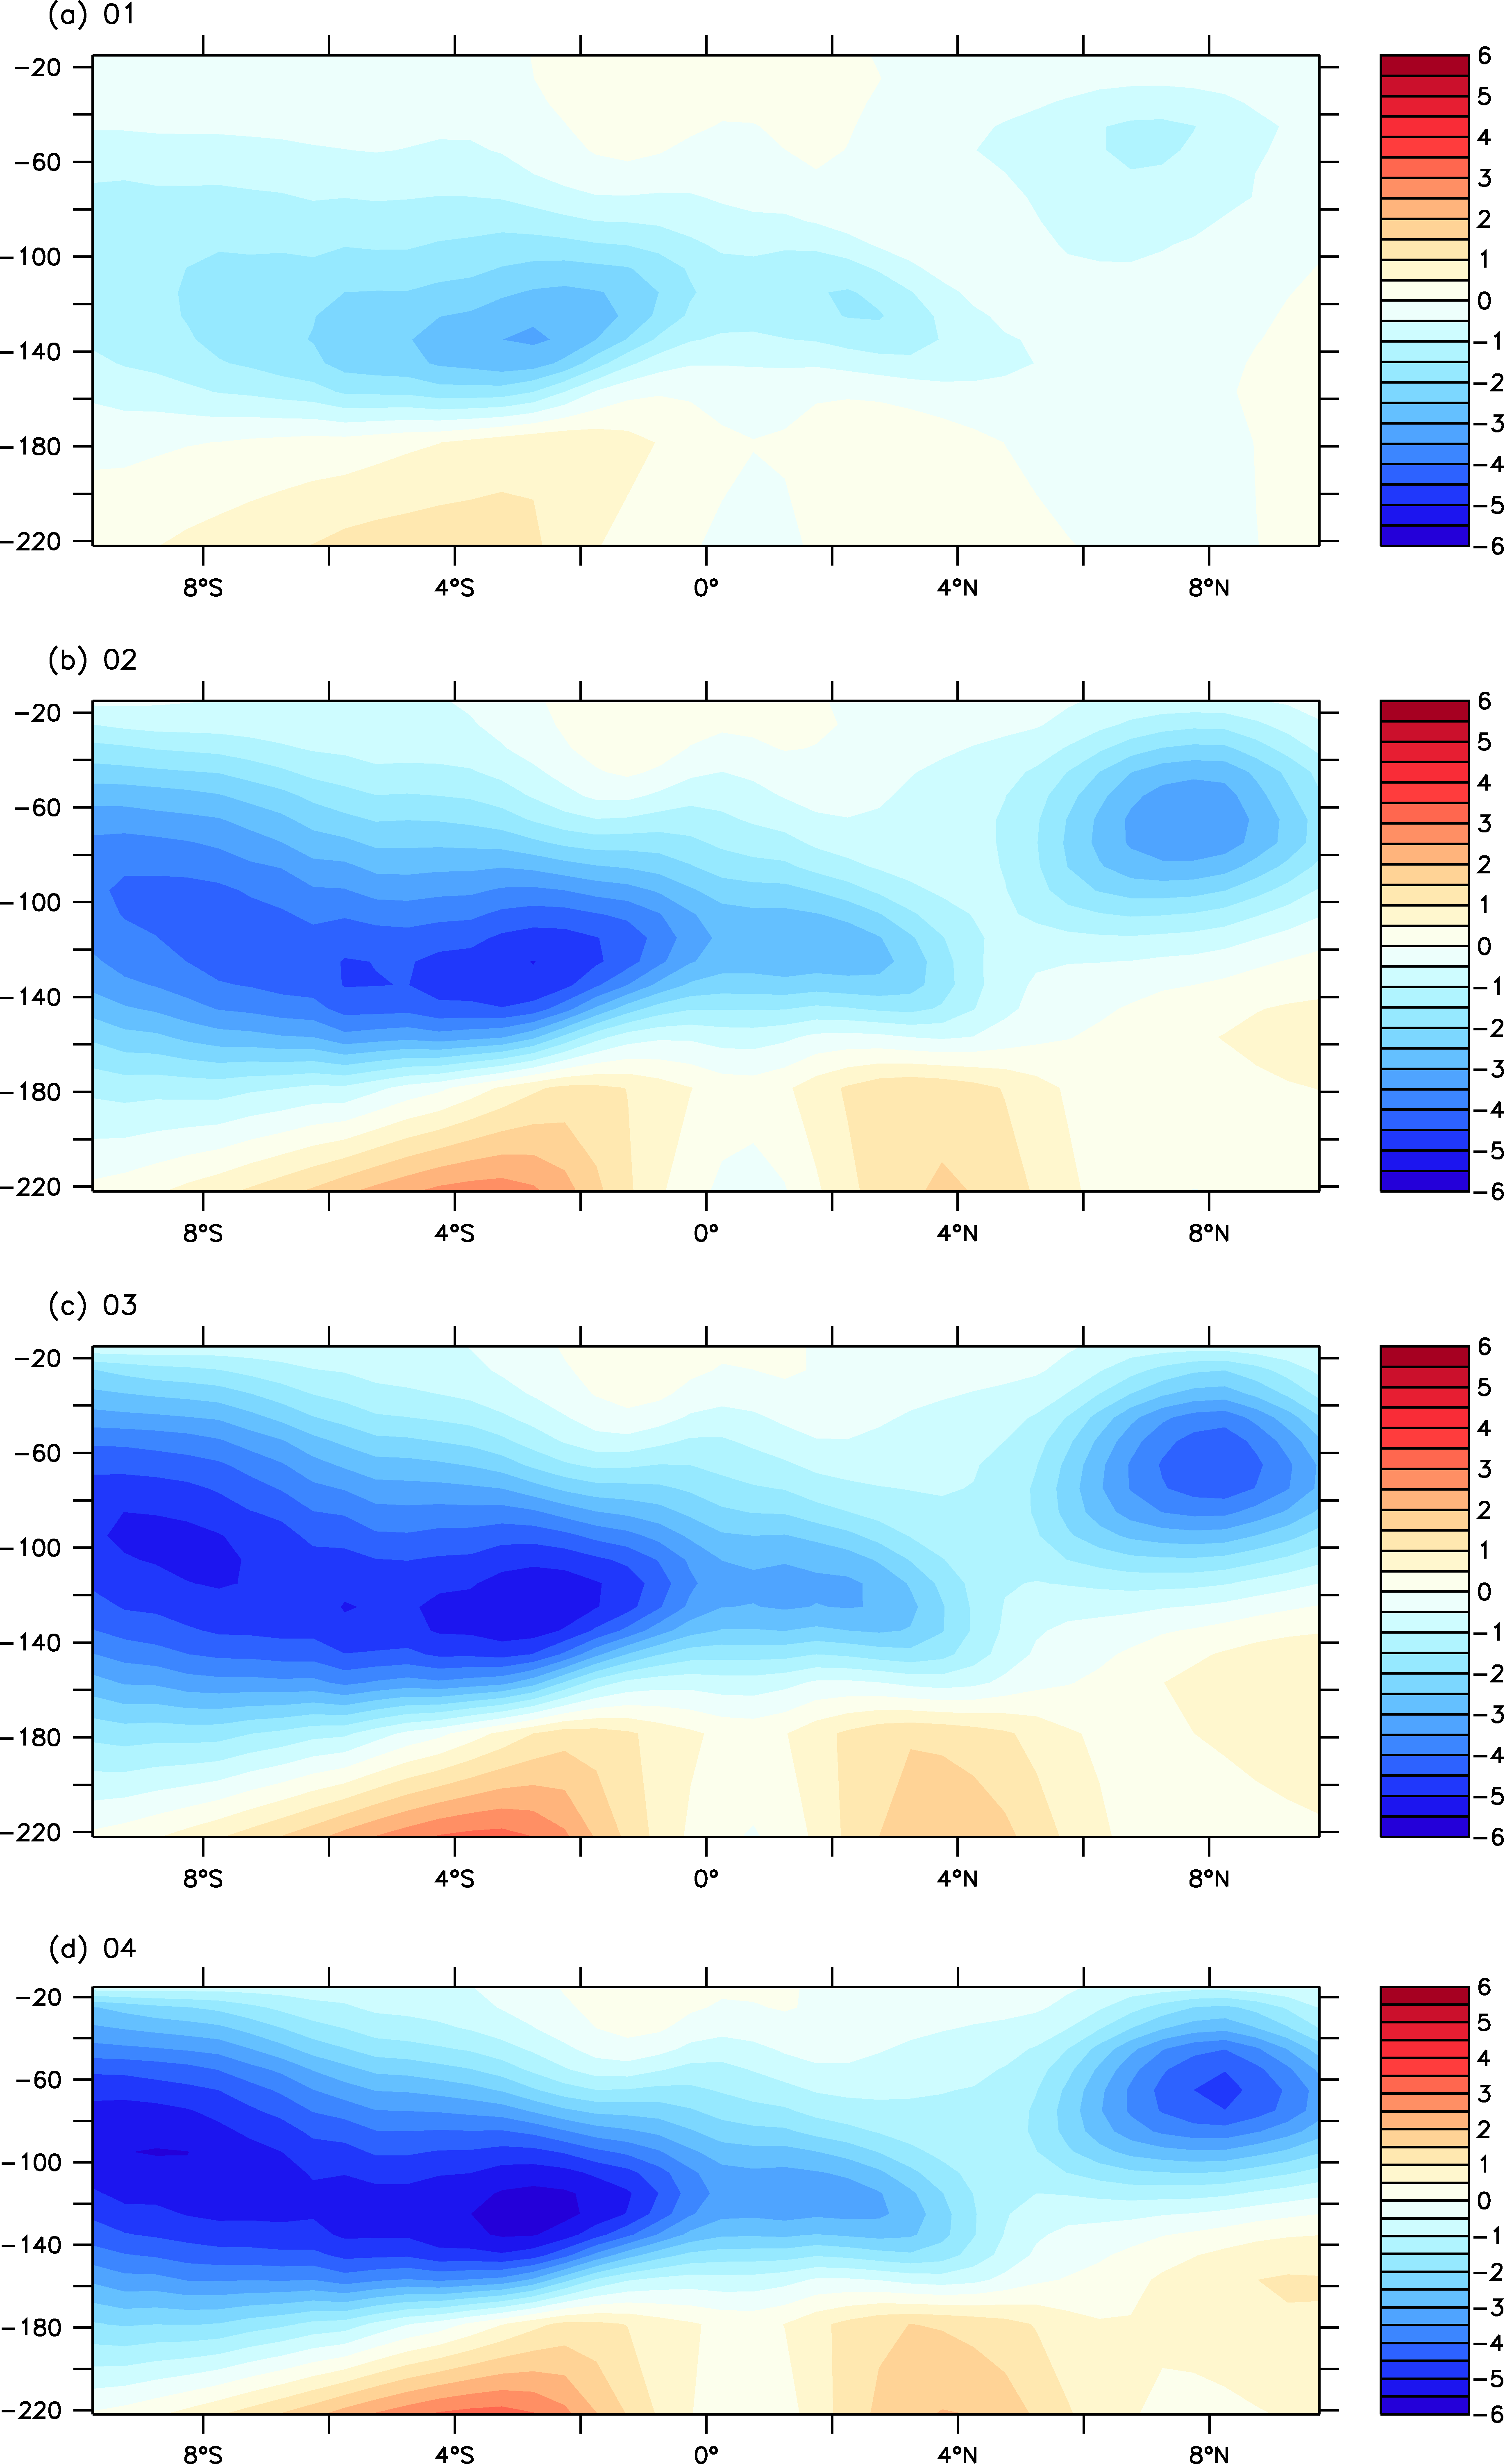 | Figure 4 Annual temperature differences between W97 and the control run, plus annual temperature differences between W97_R and the control run in the (a) first year, (b) second year, (c) third year, and (d) fourth year (units: ° C). |
Figure 4 shows the simulations from the first year to the fourth year, in which it is important to note that the model reaches an equilibrium state after approximately one year of spin-up. The major pattern in each of the four years is identical; that is, the largest negative temperature anomalies are located off-equator. It is clear that, with time, the negative anomalies are advected toward the equator, so the magnitude of negative anomalies in the equator increases Consequently, both Figs. 3 and 4 illustrate that ENSO asymmetry in the western Pacific originates from the off-equatorial region, and Fig. 4 further implies that the negative anomalies to the south of the equator probably contribute much more than those to the north.
To address the fact that the observed negative asymmetry of temperature anomalies associated with ENSO in the western Pacific has rarely been explored in previous studies, we carry out several numerical experiments to aid understanding of the mechanism responsible for ENSO asymmetry. Unlike in the equatorial eastern Pacific, the heat budget analysis suggests that NDH does not favor the negative asymmetry in subsurface temperature in the western Pacific; in particular, it tends to weaken the negative temperature asymmetry. It is important to note that both the simulation and observation exhibit stronger off-equator negative asymmetry of temperature than at the equator. The negative temperature skewness may originate in the off-equator region. Driven by the cyclonic wind stress curl through Sverdrup balance, the climatological meridional current is directed equatorward in the subsurface, which transports off-equator subsurface anomalous temperature and corresponding negative asymmetry to the equator. Two additional sensitivity experiments, in which the wind stress anomalies are identical except for their opposite sign, show a strong asymmetric response in the subsurface temperature anomalies, further confirming that the nonlinear dynamics rather than the skewness of the external forcing is the key mechanism for ENSO asymmetry. The results from these experiments also show that the negative temperature anomalies in the Southern Hemisphere advect to the equator more easily and, in turn, exert a greater impact on the equatorial temperature anomalies than those in the Northern Hemisphere.
Acknowledgements
This study is jointly supported by the National Basic Research Program of China (Grant No. 2013CB956204) and the “Strategic Priority Research Program—Climate Change: Carbon Budget and Relevant Issues” of the Chinese Academy of Sciences (Grant No. XDA05110302).
| 1 |
|
| 2 |
|
| 3 |
|
| 4 |
|
| 5 |
|
| 6 |
|
| 7 |
|
| 8 |
|
| 9 |
|
| 10 |
|
| 11 |
|
| 12 |
|
| 13 |
|
| 14 |
|
| 15 |
|
| 16 |
|
| 17 |
|
| 18 |
|
| 19 |
|
| 20 |
|
| 21 |
|
| 22 |
|