Mid-Holocene Ocean Feedback on Global Monsoon Area and Precipitation
[TIAN Zhi-Ping1  , JIANG Da-Bang
1, 2 ]
, JIANG Da-Bang|
|


Mid-Holocene ocean feedback on global monsoon area, global monsoon precipitation (GMP), and GMP intensity (GMPI) was investigated by a set of numerical experiments performed with the Community Climate System Model version 4. Results showed that ocean feedback induced an increase in land monsoon area for northern Africa but a decrease for Asia and North and South America, and led to an increase in ocean monsoon area for the western Indian Ocean and southeastern Pacific but a decrease for the eastern Indian Ocean, tropical western Pacific, and tropical West Atlantic between the mid-Holocene and pre-industrial period. Dynamic ocean- induced changes in GMP and GMPI were 10.9×10⁹ m3 d-1 and -0.11 mm d-1 between the two periods, respectively. Ocean feedback induced consistent change between the Northern and Southern Hemisphere land or ocean but opposite change between land and ocean in the Northern or Southern Hemisphere monsoon areas for monsoon precipitation. The mid-Holocene summer changes in meridional temperature gradient and land-sea thermal contrast were the underlying mechanisms.
Monsoon precipitation plays an essential role in determining global energy and the hydrological cycle (Trenberth et al., 2000). Over the past half a century, great changes have been experienced in monsoon rainfall, which impact more than two-thirds of the world’ s population and therefore are of great scientific and societal importance. In recent years, more and more attention has been paid to changes in global monsoon precipitation (GMP) on the centennial time scale (Wang and Ding, 2006; Zhou et al., 2008; Hsu et al., 2012; Wang et al., 2012), but limited emphasis has been placed upon longer time scales such as the orbital scale.
The mid-Holocene, 6000 years before present, is a period when the climate and environment were remarkably different from today (Bartlein et al., 2011), mainly due to a change in incoming solar radiation at the top of the atmosphere (Berger, 1978). It is an ideal time period for studying past climate change on the orbital scale, and one for which proxy data are abundant and relatively reliable. Previous simulations have indicated that the mid-Holocene land monsoon precipitation generally increased in the Northern Hemisphere (NH) (Kutzbach et al., 1996; Wang, 1999; Zhou and Zhao, 2009; Wang et al., 2010; Zheng et al., 2013) but decreased in the Southern Hemisphere (SH) (Liu et al., 2004; Zhao and Harrison, 2012) with respect to the present day, and ocean feedback can to a certain extent modulate monsoon precipitation change. On the other hand, both the GMP and global monsoon area (GMA) have evolved over time under the background of global climate change (Zhou et al., 2008; Hsu et al., 2012). However, hitherto little is known about how and to what extent the regional and global monsoon areas, and hence monsoon precipitation, responded to dynamic ocean during the mid-Holocene (Jiang et al., 2014). The present study addresses this issue using a state-of-the-art climate system model.
The present study used a globally coupled ocean-atmosphere-sea-ice-land-surface climate model named the Community Climate System Model version 4 (CCSM4) developed at the National Center for Atmospheric Research (NCAR) (Gent et al., 2011). The atmospheric model of the Community Atmosphere Model version 4 (CAM4) is employed at T31 resolution of approximately 3.75° × 3.75° and with 26 vertical levels. The land model, run on the same horizontal grid as the atmosphere, is the Community Land Model version 4 (CLM4). Both the ocean model (POP2) and sea-ice component (CICE4) use a 3° horizontal grid with 60 levels in the vertical direction. More details on CCSM4 are available online at http://www. cesm.ucar.edu/models/ccsm4.0/, and further information can be found in Gent et al. (2011).
Following the protocol of the Paleoclimate Modeling Intercomparison Project, the major differences in boundary conditions between the mid-Holocene (6 ka) and the pre-industrial (0 ka) period lie in the Earth's orbital parameters (Berger, 1978) and the atmospheric concentrations of greenhouse gases. To separate the contribution of ocean feedback from total climate change between the two periods, four experiments were undertaken: two atmosphere-ocean coupled (AOGCM) experiments (AO (0 ka) and AO (6 ka)) and two atmosphere-only (AGCM) simulations (A (0 ka) and A (6 ka)). The same configurations of the 0 ka experiments were performed by both the AOGCM and AGCM, and thus the differences between them, i.e. (AO (6 ka)-AO (0 ka)) and (A (6 ka)-A (0 ka)) allows us to discuss the role of ocean feedback during the mid-Holocene. Further details about the simulations are given in Tian and Jiang (2013).
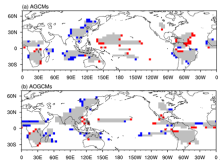
The monsoon climate is characterized not only by annual reversal of prevailing surface winds, but also by a marked contrast between a wet summer and dry winter (Webster et al., 1998; Wang and Ding, 2006). Following the definition given by Liu et al. (2009) and Wang et al. (2012), GMA is defined here as the region in which the local summer-minus-winter precipitation rate exceeds 2 mm d-1 and the local summer rainfall exceeds 55% of annual total precipitation. Summer denotes May through September (MJJAS) in the NH and November through March (NDJFM) in the SH. Similar to the spatial pattern shown in Wang et al. (2012), CCSM4 can reasonably reproduce the present monsoon regions over land in North, East, and South Asia, northern and southern Africa, northern Australia, and North and South America, as well as over the oceans of the tropical western Pacific and western Indian Ocean (Fig. 1). As in Zhou et al. (2008), Hsu et al. (2012), and Wang et al. (2012), GMP is defined as the sum of total summer rainfall in the monsoon area, and the GMP intensity (GMPI) is measured by area-averaged mean summer rainfall in the GMA.
 | Figure 1 Global monsoon areas for the two (a) AGCM and (b) AOGCM experiments. Grey indicates the common areas between 6 ka and 0 ka, and blue (red) indicates expanded (reduced) monsoon areas at 6 ka relative to 0 ka. |
In the AGCM simulations (Fig. 1a), the mid-Holocene monsoon area expanded slightly over most land monsoon regions as well as the Indian Ocean, whereas it reduced over the tropical western Pacific and Atlantic with respect to the pre-industrial period. At the regional scale, land monsoon area increased by 0.8× 10⁶ km2 (12.1%) in northern Africa (0-25° N, 20° W-50° E), 2.3× 10⁶ km2 (33.5%) in Asia (5-70° N, 70-150° E), and 0.3× 10⁶ km2 (3.1%) in South America (0-30° S, 35-85° W), but decreased by 0.3× 10⁶ km2 (8.5%) and 0.5× 10⁶ km2 (7.9%) in North America (0-30° N, 55-120° W) and southern Africa (0-35° S, 10-40° E). In the AOGCM simulations (Fig. 1b), however, the monsoon area changes between the mid-Holocene and pre-industrial period were different from those of the AGCMs. As compared to A (0 ka), monsoon regions additionally registered over India and the southeastern Pacific, increased over the western Indian Ocean, but decreased over the tropical western Pacific and disappeared over the eastern Indian Ocean and tropical West Atlantic in AO (0 ka). In AO (6 ka), monsoon areas expanded over most land monsoon regions as well as the western Indian Ocean and southeastern Pacific, but retreated over southern Africa, South America, and other ocean monsoon regions relative to AO (0 ka). At the regional scale, land monsoon area changes between the two periods were 2.5× 10⁶ km2 (51.4%), 1.0× 10⁶ km2 (6.5%), -0.5× 10⁶ km2 (-9.9%), -0.5× 10⁶ km2 (-6.5%), and -0.8× 10⁶ km2 (-7.8%) in northern Africa, Asia, North America, southern Africa, and South America, respectively. Taking all simulations into account, ocean feedback showed a substantial impact on GMA changes between the two periods. Regionally and qualitatively over land, dynamic ocean induced an increase in monsoon area over northern Africa but a decrease over Asia as well as North and South America, and had no significant effect over southern Africa and northern Australia (10-30° S, 110-155° E). On the other hand, the ocean monsoon area increased in the western Indian Ocean and southeastern Pacific but reduced in the eastern Indian Ocean, tropical western Pacific, and tropical West Atlantic due to ocean feedback.
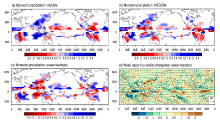
With reference to the pre-industrial period, the mid-Holocene ocean feedback led to more monsoon precipitation over the globe and global ocean areas but less over global land areas, with an average change of 10.9× 10⁹, 15.8× 10⁹, and -4.8× 10⁹ m3 d-1, respectively. As compared to between the AGCM (Fig. 2a) and AOGCM (Fig. 2b) simulations, Fig. 2c shows that ocean- induced changes in monsoon precipitation were unevenly distributed worldwide. Monsoon precipitation generally increased in northern and southeastern Africa, the southwestern Indian Ocean, the tropical western and central North Pacific, North America, and the tropical West Atlantic, but decreased in East and South Asia, the southeastern Indian Ocean, northern Australia, and the tropical eastern Pacific. The former increase resulted from the ocean-induced convergence of water vapor flux in those regions, whereas the divergence held true for the latter regions (Fig. 2d). At the hemispheric scale, land monsoon precipitation decreased by 2.8× 10⁹ m3 d-1 in the NH and 2.0× 10⁹ m3 d-1 in the SH, while ocean monsoon precipitation increased by 13.9× 10⁹ m3 d-1 in the NH and 1.8× 10⁹ m3 d-1 in the SH, showing consistent change between the NH and SH land or ocean areas but opposite change between the land and ocean areas in the NH or SH. At the regional scale over land, monsoon precipitation reduced by 7.4× 10⁹, 2.7× 10⁹, 5.9× 10⁹, and 1.0× 10⁹ m3 d-1 in Asia, North and South America, and northern Australia, respectively, while it increased by 5.1× 10⁹ and 1.9× 10⁹ m3 d-1 in northern and southern Africa due to ocean feedback, respectively. Thus, the dynamic ocean-induced increase in GMP mainly resulted from more monsoon precipitation over the NH ocean areas, whereas less precipitation over land monsoon areas had a negative contribution.
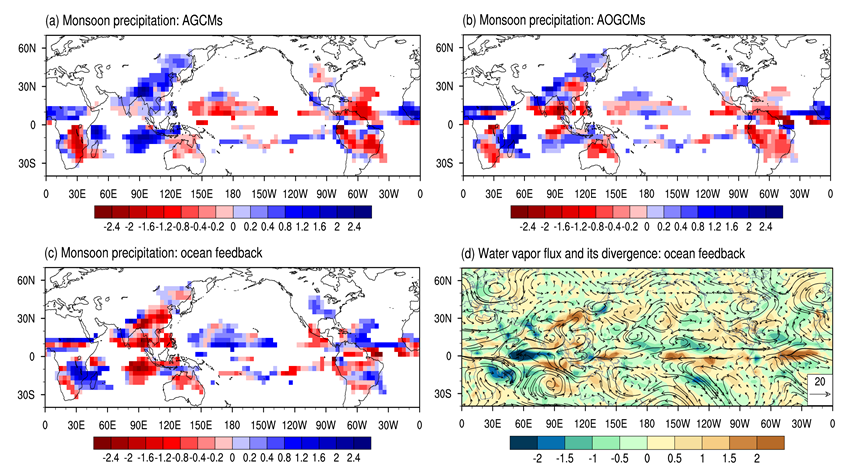 | Figure 2 Changes in summer monsoon precipitation (units: mm d-1) for the (a) AGCM and (b) AOGCM, and (c) due to ocean feedback. (d) Changes in summer vertically integrated water vapor flux (arrows; units: kg m-1 s-1) and its divergence (shading; units: mm d-1) due to ocean feedback. The vertical integration of the water vapor flux was performed from the surface to 300 hPa, and the impacts of topography have been removed using the surface pressure. The units of divergence have been converted to mm d-1 assuming the density of liquid water as 1 g cm-3. |
On the whole, the mid-Holocene GMPI decreased due to ocean feedback. The intensity of monsoon precipitation decreased by 0.11 and 0.15 mm d-1 for the globe and global land areas, respectively, but increased by 0.13 mm d-1 for the global ocean. At the hemispheric scale, monsoon precipitation weakened over the NH land and ocean areas but strengthened over the SH monsoon areas, revealing consistent change in monsoon precipitation intensity between land and ocean in the NH or SH but opposite change between the NH and SH land or ocean. Regionally, monsoon precipitation intensity decreased in northern Africa, Asia, North America, and northern Australia but increased in southern Africa and South America due to ocean feedback. Thus, the dynamic ocean-induced decrease in GMPI resulted from the weakened monsoon precipitation over the NH land monsoon areas.
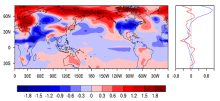
The influence of the dynamic ocean on monsoon precipitation occurs mainly through changes in evaporation from the ocean and the large-scale atmospheric circulation. In response to the mid-Holocene changes in orbital forcing and atmospheric concentrations of greenhouse gases, ocean feedback led to significant changes in summer surface temperature relative to the pre-industrial period (Fig. 3). In the NH, the mid-Holocene ocean was warmer at the mid- and high-latitudes but colder at the lower latitudes. Accordingly, summer temperature generally rose north of approximately 50° N but decreased in the south, except in East and South Asia, western Europe, the northeastern Pacific, and the western Atlantic, leading to an overall decrease in meridional temperature gradient through the lower to mid and high latitudes. This was beneficial to the occurrence of anomalous southerly winds, which brought additional moisture from the tropics in the lower troposphere to compensate for warming-induced loss of atmospheric mass due to intensified ascending motion or weakened descending motion at the mid and high latitudes. In the SH, however, summer temperature change was very weak, regionally and zonally. At the same time, ocean-induced change in summer temperature was stronger in the land than in the ocean areas, resulting in an overall decrease (increase) in the land-sea thermal contrast in the NH, except for at approximately 60° N (in the SH), which was unfavorable (favorable) to inland winds and moisture transport, and thus monsoon precipitation intensity, over the land monsoon areas. Regionally, summer temperature increased in East and South Asia but decreased in the adjacent oceans, inducing an increase in both zonal and meridional land-sea thermal contrast, which was favorable to anomalous southerly winds and thus monsoon precipitation over East and South Asia.
 | Figure 3 Summer (MJJAS for the NH and NDJMF for the SH) temperature changes (units: K) due to ocean feedback, with the corresponding changes in the zonal mean of summer temperature (units: K; blue line) and land minus ocean surface temperature (units: K; red line) in the right panel. |
However, the summer vertically integrated water vapor flux diverged over those monsoon regions (Fig. 2d), corresponding to decreased precipitation over the East and South Asian monsoon regions (Fig. 2c).
With respect to the pre-industrial period, the mid-Holocene ocean feedback on global monsoon area, monsoon precipitation, and monsoon precipitaiton intensity was investigated by a set of numerical experiments performed with CCSM4. Results showed that ocean feedback had a substantial impact on the mid-Holocene GMA changes. On the one hand, the dynamic ocean induced an increase in land monsoon area over northern Africa, but a decrease over Asia as well as North and South America. On the other hand, ocean feedback led to an increase in ocean monsoon area over the western Indian Ocean and the southeastern Pacific, but a decrease over the eastern Indian Ocean, tropical western Pacific, and tropical West Atlantic. At the global scale, dynamic ocean-induced change in GMP and GMPI was 10.9× 10⁹ m3 d-1 and -0.11 mm d-1, respectively. Ocean feedback induced decreases in monsoon precipitation and intensity over the global land areas, but increases over the global ocean areas. Similarly, at the hemispheric scale, ocean feedback showed consistent (opposite) change in monsoon precipitation (monsoon precipitation intensity) between the NH and SH land or ocean, but opposite (consistent) change between the land and ocean in the NH or SH monsoon areas. In response to the mid-Holocene forcing, ocean- induced changes in meridional summer temperature gradient and land-sea thermal contrast collectively led to the changes in monsoon area and precipitation.
| 1 |
|
| 2 |
|
| 3 |
|
| 4 |
|
| 5 |
|
| 6 |
|
| 7 |
|
| 8 |
|
| 9 |
|
| 10 |
|
| 11 |
|
| 12 |
|
| 13 |
|
| 14 |
|
| 15 |
|
| 16 |
|
| 17 |
|
| 18 |
|
| 19 |
|