
Assessment of the Summer South Asian High in Eighteen CMIP5 Models
[HE Bian1, 2 , HU Wen-Ting1, *  ]
]
]
|
|


The South Asian High (SAH) is one of the most important components of the Asian summer monsoon system. To understand the ability of state-of-the-art general circulation models (GCMs) to capture the major characteristics of the SAH, the authors evaluate 18 atmospheric models that participated in the Coupled Model Intercomparison Project Phase 5/Atmospheric Model Intercomparison Project (CMIP5/AMIP). Results show that the multi-model ensemble (MME) mean is able to capture the climatological pattern of the SAH, although its intensity is slightly underestimated. For the interannual variability of the SAH, the MME exhibits good correlation with the reanalysis for the area and intensity index, but poor skill in capturing the east-west oscillation of the SAH. For the interdecadal trend, the MME shows pronounced increasing trends from 1985 to 2008 for the area and intensity indexes, which is consistent with the reanalysis, but fails to capture the westward shift of the SAH center. The individual models show different capacities for capturing climatological patterns, interannual variability, and interdecadal trends of the SAH. Several models fail to capture the climatological pattern, while one model overestimates the intensity of the SAH. Most of the models show good correlations for interannual variability, but nearly half exhibit high root-mean-square difference (RMSD) values. Six models successfully capture the westward shift of the SAH center in the interdecadal trends, while other models fail. The possible causes of the systematic biases involved in several models are also discussed.
The South Asian High (SAH) is a large semi-permanent anticyclonic circulation system in the upper troposphere over the Eurasian continent. At one time, the SAH was referred to as the Tibetan High (Ye and Gao, 1979), as its generation is closely related to the heating effect of the Tibetan Plateau during boreal summer (Yeh et al., 1957). Its center often oscillates in an east-west direction above the Tibetan Plateau and Iranian Plateau (Tao and Zhu, 1964), in close association with the local weather variations over East Asia. For example, an increase in East Asian rainfall often accompanies an eastward shift of the center of the SAH, while a decrease in East Asian rainfall is accompanied by a westward shift of the center (Qian et al., 2002). Therefore, variability in the SAH is often regarded as an important index for short-term climate and weather forecasting in China (Hu et al., 2010).
One of the key requirements for improved predictions of Asian weather and climate change is the development of improved general circulation models (GCMs). For this purpose, model-to-model intercomparisons, such as those of the Atmospheric Model Intercomparison Project (AMIP) and Coupled Model Intercomparison Project (CMIP), have been performed to establish the level of certainty of different models in capturing the major features of the climate system (Gates, 1992; Meehl et al., 2000). Many studies have documented the ability of state-of-the- art models to capture extensive aspects of the major modes of Asian summer monsoon precipitation (Gadgil and Sajani, 1998; Liang et al., 2001; Kang et al., 2002; Zhou et al., 2009a, b; Feng et al., 2014). However, few studies have been conducted on the ability of state-of-the- art models to simulate the upper-troposphere climate in boreal summer.
The aim of this study is to investigate the ability of state-of-the-art atmospheric general circulation models (AGCMs) to capture the major features of the SAH in boreal summer, including the climatological spatial pattern, the interannual variability, and the interdecadal trends, based on the latest CMIP5 model outputs. The paper is organized as follows. Section 2 introduces the models, datasets, and methods employed to evaluate the simulation skill of the multiple models. Section 3 presents the results of the multi-model intercomparisons of the climatological spatial pattern, interannual variability, and interdecadal trends. Additionally, the possible causes of systematic biases in capturing the climatological pattern of the SAH are considered for several special cases. Finally, a discussion and conclusions are given in section 4.
Because there are discrepancies between reanalysis datasets in capturing the major mode of the SAH (Fu and Li, 2012), here we use two kinds of reanalysis to make our intermodel comparison more reasonable. The European Centre for Medium-Range Weather Forecasts (ECMWF) Re-Analysis (ERA) Interim dataset (Dee et al., 2011), and the National Center for Enviromental Prediction-Department of Energy (NCEP-DOE) Reanalysis 2 dataset (NCEP2) (Kanamitsu et al., 2002) are used in this study. Both of the datasets cover the period 1979 to the present day with monthly mean values. The Ensemble Mean of the two Reanalysis datasets (EMR) is regarded as the reference for the comparison.
The CMIP5/AMIP experiments for 18 state-of-the-art models are analyzed in this paper. The standard AMIP simulations are forced by the observed global sea surface temperature (SST) and sea ice data from the Hadley Centre for Climate Prediction for the period 1979-2008 (Taylor et al., 2012). The corresponding model names and horizontal and vertical resolutions are shown in Table 1. In order to make an objective comparison, data from these models are interpolated onto a 1.5° × 1.5° grid.
| Table 1 Information on the 18 models referred to in this study |
Quantitative measures of the extent and intensity of the SAH are calculated using three kinds of indexes based on the 200-hPa geopotential height field. The first is the area index (Iarea), defined as the number of grid cells where the geopotential height of the 200-hPa level exceeds 12520 gpm in the region (0-45° N, 0-180° E) during boreal summer. The second is the intensity index (Iint), defined as the sum of the geopotential height anomalies of the 200-hPa surface relative to 12520 gpm within the same region during boreal summer. The third are the position indexes, which have been used in Zhang et al. (2000). The average latitude of the SAH ridge line is defined as the latitude index (Ilat), while on this latitude, the longitude of the maximum geopotential height is defined as the longitude index (Ilon).
The correlation coefficients between EMR and model results are calculated to assess the simulation of interannual variability. Linear regressions are computed to quantify the ability of the models to estimate interdecadal trends. The root-mean-square differences (RMSDs) are computed to quantify the bias of models with respect to the EMR.
The SAH is a steady anticyclonic system in the upper troposphere during boreal summer with closed circulations clearly evident from 50 hPa to 300 hPa. Here, we calculate the June-July-August (JJA) mean 200-hPa geopotential height (HGT) from 1979 to 2008 based on EMR (Fig. 1a). This shows that the closed circulation denoted by the 12460 gpm contour covers the African and Asian continents within the latitude band 15-35° N, while the maximum HGT encloses the south slopes of the Tibetan and Iranian plateaus.
The individual models (Figs. 1c-t) show different skills in reproducing the climatological pattern of the SAH. Most of the models capture the basic pattern of the SAH, but the results of BCC-CSM1.1 (Fig. 1d), CNRM-CM5 (Fig. 1h), FGOALS-g2 (Fig. 1k), and GISS-E2-R (Fig. 1n) seriously underestimate the range and intensity of the SAH, while the results of CSIRO-MK3-6-0 (Fig. 1i) seriously overestimate the SAH compared with the EMR.
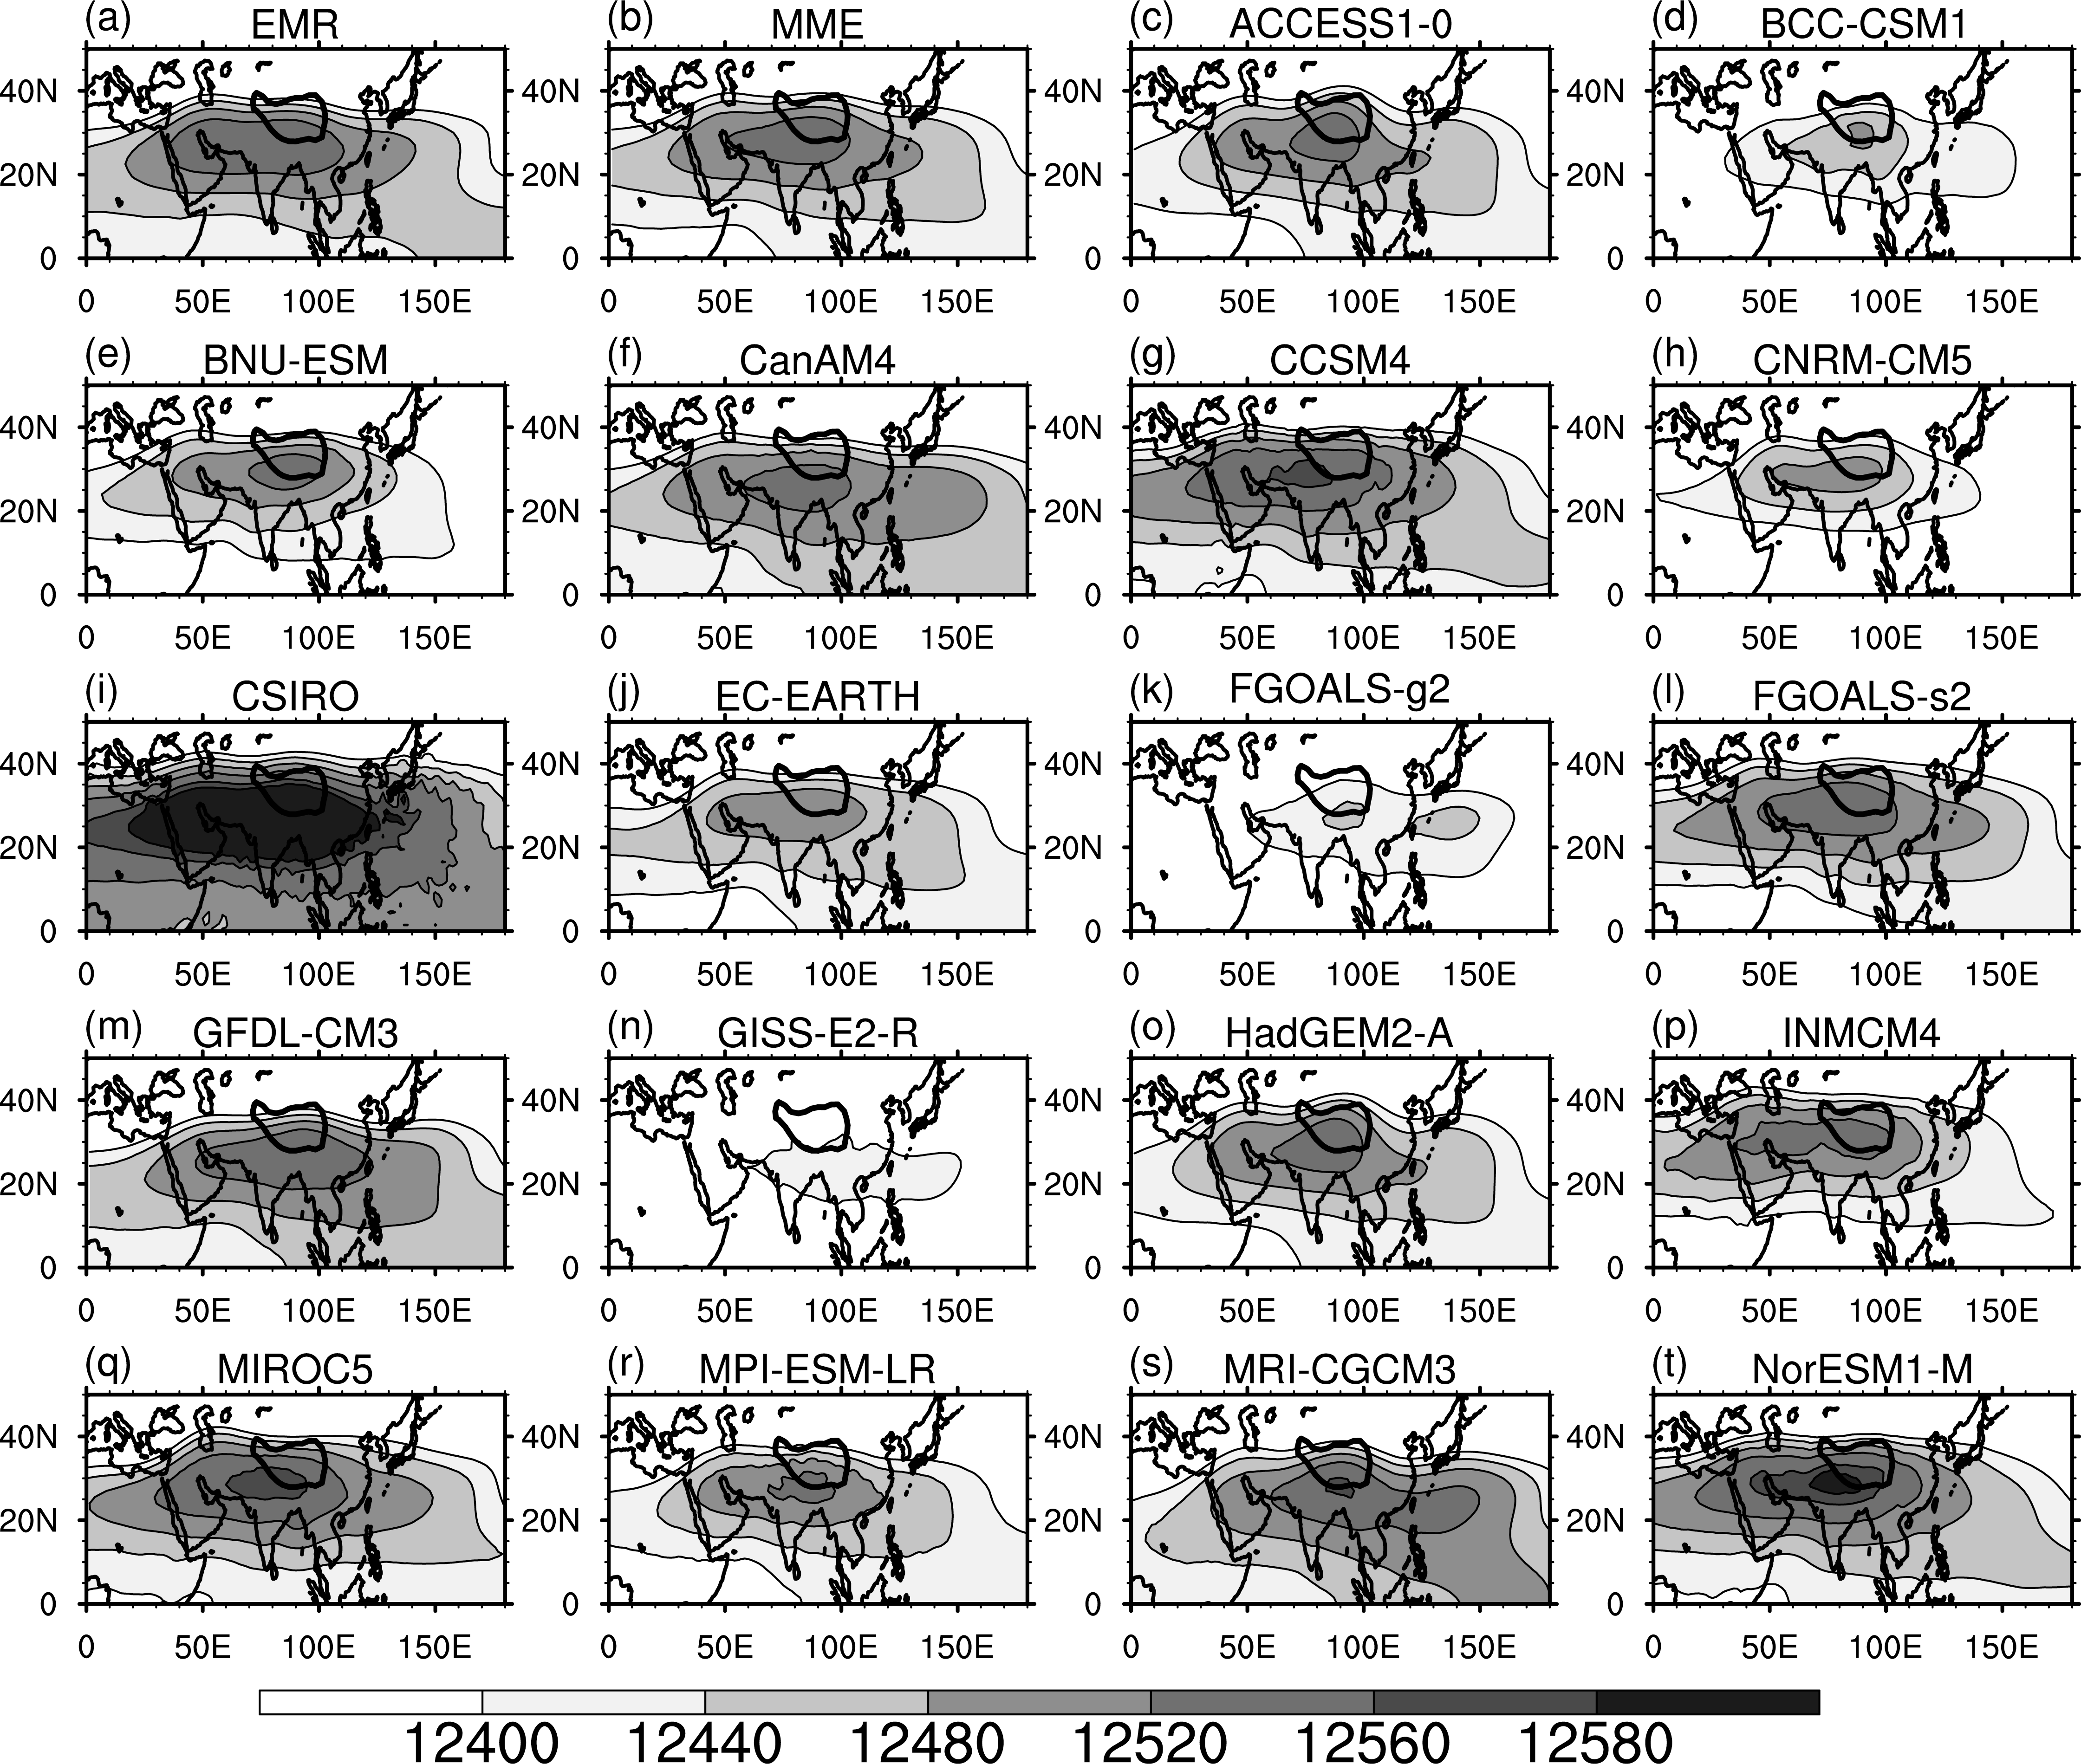 | Figure 1 The 1979-2008 June-July-August (JJA) mean of the 200-hPa geopotential height (units: gpm) of the (a) ensemble mean of the reanalysis (EMR) based on ERA-interim and NCEP2, (b) multi-model mean (results of BCC-CSM1, CNRM-CM5, CSIRO-MK3-6-0, FGOALS-g2, and GISS-E2-R are excluded), and (c-t) the 18 individual models. The topography above 3000 m is contoured with a thick black line. |
To ensure that our evaluation is representative, we calculate the multi-model ensemble (MME) mean of 13 models, with the excluded five models being BCC-CSM1.1, CNRM-CM5, FGOALS-g2, GISS-E2-R, and CSIRO- MK3-6-0. The simulation of the SAH by the MME (Fig. 1b) shows a pattern similar to that observed (Fig. 1a), except that the intensity is a little weaker. Additionally, the MME shows an obvious Tibetan Plateau mode (Zhang et al., 2002) with a maximum of 12560 gpm located over the south slope of the Tibetan Plateau. Thus, the average simulation skill of the state-of-the-art-models is able to capture the major features of the climatological SAH, except that the intensity is slightly underestimated. However, the individual models display obvious differences in ability.
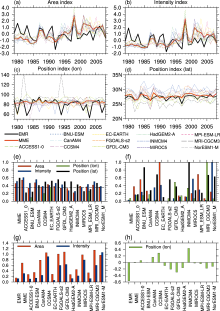
According to the analysis in section 3.1, most of the AGCMs are able to capture the climatological spatial pattern of the SAH. However, their ability to capture the temporal characteristics of the SAH should also be evaluated. We use the area index (Iarea), intensity index (Iint), and the position indexes (Ilon andIlat) as defined in section 2 to evaluate objectively the models’ abilities to capture the interannual and decadal variabilities of the SAH. The five models that fail to capture the basic pattern of the SAH are not included.
Figure 2 shows the time series of Iarea (Fig. 2a), Iint (Fig. 2b), Ilon (Fig. 2c), and Ilat (Fig. 2d) for the EMR (black line), MME (red line), and the 13 individual models. Overall, the MME (red line) underestimates the strength of the SAH in both Iarea and Iint compared with the EMR (black line), especially during the period 1979-97, while it overestimates the area and intensity indexes after 1998. Meanwhile, the MME reaches its maximum during 1997-98 for both Iarea andIint, consistent with the EMR. This maximum is highly correlated with the El Niñ o-Southern Oscillation (ENSO) phenomenon during 1997-98. An observational study (Peng et al., 2009) indicated that the SAH may be intensified through a circulation response when the ENSO reaches its decay phase. Associated with the significant ENSO phenomena during this period (Ren, 2012), the values of Iarea and Iint for MME (red line) show sudden increases in 1982-83, 1986-87, and 1997-98, again consistent with the EMR (black line).
 | Figure 2 (a) Time series of the standardized SAH area index (Iarea) during 1979-2008 for EMR, the MME, and 13 individual models. (b) The same as (a), except for the SAH intensity index (Iint). (c) The same as (a), except for the position index of the longitude (° E, Ilon). (d) The same as (a), except for the position index of the latitude (° N, Ilat). (e) Bar chart of the correlation coefficients between individual models and the EMR for theIarea, Iint, Ilon, andIlat. (f) The same as (e), except for the standardized RMSD. (g) The standardized linear trends of Iarea and Iint from 1985 to 2008 for EMR, MME, and 13 individual models. (h) The same as (g), except for theIlon. |
The position indexes of Ilon and Ilat are also important for the evaluation of the CMIP5 models’ abilities. Figure 2c shows that the east-west oscillation of the SAH center is obvious in EMR, with a range between 50° E and 100° E, while the south-north shift of the SAH center is not significant (Fig. 2d). This result is consistent with previous studies (e.g., Zhang et al., 2000). More importantly, the MME almost fails to simulate such oscillation but steadily holds the position at about 80° E. Additionally, the Ilon of MRI-CGCM3 even shows two displacements to 140° E in 1982 and 1994, which is opposite to the EMR.
To achieve a quantitative and objective assessment of the individual models, we calculate the correlation coefficients and RMSD between individual models and the EMR based on the above three types of indexes. Figure 2e shows the calculated correlation coefficients for Iarea (red bars), Iint (blue bars), Ilon (green bars), and Ilat (black bars). A correlation coefficient of 0.349 represents a 95% confidence level. It shows that most models capture good time correlations for both Iarea andIint, but none of the models capture a good correlation forIlon. Furthermore, the MME shows the best simulation skill, with a correlation of 0.42 for Iarea, 0.51 forIint, and 0.6 forIlat. Among the 13 individual models, CanAM4, CCSM4, EC-EARTH, FGOALS-s2, and MRI-CGCM3 show higher correlations than other models forIarea, Iint, andIlat.
The RMSD is a measure of the bias between the models and the EMR. We show the standardized RMSD of the MME and the 13 individual models in Fig. 2f. It is clear that taking the MME can efficiently reduce the biases associated with the individual models. The standardized RMSDs of the four indexes are all less than 0.1 for the MME. Additionally, CanAM4 and HadGEM2-A show the best simulation skills, with RMSDs less than 0.3 for all the indexes. However, ACCESS1-0, BNU-ESM, EC- EARTH, and MPI-ESM-LR show obvious deviations for Iarea andIint, while GFDL-CM3, INMCM4, and MRI- CGCM3 show obvious deviations for Ilon andIlat.
Global warming is considered to be the most significant climatic event of the latter half of the 20th century. In response to global warming, the interdecadal variability of the SAH also shows a long-term increasing trend (Fig. 2a) in the EMR from 1985 to 2008, although there is a slight decrease during 1979-84. We calculate the linear regressions of the EMR, the MME, and the individual models during 1985-2008 for the indexes of Iarea and Iint in Fig. 2g and Ilon in Fig. 2h. The Iarea and Iint both increase and pass the 95% confidence level with Student’ s t-test for EMR. All the models capture this increasing trend. However, the results of ACCESS1-0, EC-EARTH, HadGEM2-A, and MPI-ESM-LR show similar magnitudes, while other models obviously overestimate the linear trends of these two indexes. For the position indexes of the SAH, the SAH is stable in the south-north direction, but more active in the east-west oscillation. Therefore, we show Ilon in Fig. 2h and find that the EMR shows a significant westward shift during this period. Only EC-EARTH, FGOALS-s2, GFDL-CM3, HadGEM2-A, MRI-CGCM3, and NorESM1-M capture this feature, while other models do not.
Based on the analysis in section 3.1, there are several models that show systematic biases in capturing the major features of the SAH. As seen in Fig. 1, BCC-CSM1, CNRM-CM5, FGOALS-g2, and GISS-E2-R seriously underestimate the strength and extent of the SAH, and in fact FGOALS-g2 and GISS-E2-R almost fail to reproduce the basic pattern of the SAH. The CSIRO-MK3-6-0 model, however, seriously overestimates the intensity of the SAH compared with the MME. Why do these models show such extreme and opposite systematic biases in capturing the major features of the SAH?
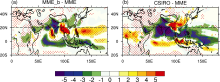
Liu and Wu (2000) reviewed studies of the subtropical highs and concluded that several factors control the formation and activity of the SAH. One of the most important factors is the condensation heating over the Tibetan Plateau and East Asia. Liu et al. (2001) suggested that the inhomogeneous vertical condensation heating over East Asia triggers a north wind in the upper troposphere based on the Sverdrup balance, and the anticyclone thus forms to the west of the heating in the upper layer. According to this theory, we examine the possible cause of the systematic biases by investigating these models. Here, we define the MME_b as the ensemble mean of FGOALS-g2, GISS-E2-R, BCC-CSM1, and CNRM-CM5, which fail to reproduce the basic pattern of the SAH. Because the spatial pattern of condensation heating is consistent with the precipitation, we calculate the spatial fields of precipitation differences between the MME_b and the MME (Fig. 3a), and between CSIRO-MK3-6-0 and the MME (Fig. 3b), to identify the possible causes. Figure 3a shows that the MME_b seriously underestimates the monsoon precipitation over the south slope of the Tibetan Plateau and East Asia. This result suggests that these models underestimate the local condensation heating, which leads to the negative systematic bias in capturing the climatological SAH. In contrast, although its precipitation anomaly is negative over the west of the Tibetan Plateau in Fig. 3b, the CSIRO-MK3-6-0 model produces much more precipitation over the south slope of the Tibetan Plateau and over East Asia than the MME. This result indicates that the positive bias of the condensation heating over East Asia is the primary cause of the abnormally intensified SAH simulated by CSIRO-MK3-6-0.
 | Figure 3 (a) June-July-August (JJA) mean precipitation (mm d-1) difference between MME_b and MME. (b) The same as (a), except for the difference between CSIRO-MK3-6-0 and MME. The dashed line denotes 20° N latitude. The red dots indicate the values that pass the Student t-test at the 95% confidence level. |
To determine the skill of state-of-the-art AGCMs in capturing the major features of the SAH in boreal summer, 18 AGCMs from CMIP5 are evaluated by comparison with the EMR. Their skills in simulating the climatological spatial pattern, interannual variability and interdecadal variability are investigated accordingly. The possible causes of the systematic biases in several models are also discussed. The main results are as follows.
The MME is able to capture the major characteristics of the climatological spatial pattern of the SAH, except that the intensity is a little weak compared with the EMR. Most of the models simulate a Tibetan Plateau mode with the maximum center of the SAH located over the south slope of the Tibetan Plateau. The individual models show a wide range of simulation skill. The CSIRO-MK3-6-0 model overestimates the intensity of the SAH, while FGOALS-g2, GISS-E2-R, BCC-CSM1, and CNRM-CM5 almost fail to reproduce the basic pattern of the climatological SAH.
Based on the objective indexes that depict the area, intensity, and position of the SAH, the interannual and interdecadal variabilities of the state-of-the-art models are investigated. It is found that the MME shows the best skill in capturing the interannual variability with a correlation coefficient of 0.42 for Iarea and 0.51 forIint, but fails to capture the correlations for Ilon, which indicates that the current state-of-the-art models are still unable to capture the east-west oscillation of the SAH. Furthermore, most of the models capture the strengthening of the SAH in response to the ENSO phenomenon in 1997-98. However, they overreact to the ENSO in 2002-03. The MME also shows a considerable level of skill in the standardized RMSD, with a value less than 0.2 for all the indexes. Of all the models, HadGEM2-A shows the lowest RMSD for all the indexes. As for the interdecadal variability, the MME captures the increasing trend of the SAH from 1985 to 2008 for Iarea andIint, but fails to capture the westward shift of the SAH center. The individual models show different skills: ACCESS1-0, BNU-ESM, EC-EARTH, HadGEM2-A, and MPI-ESM-LR capture the linear trends reasonably well, while other models overestimate the increase in magnitude of the SAH. For the position indexes, FGOALS-s2 and GFDL-CM3 show the best skill in capturing the westward shift of the SAH, while most of the models cannot.
Finally, the possible causes of the systematic biases in simulating the climatological SAH for FGOALS-g2, GISS-E2-R, BCC-CSM1, CNRM-CM5, and CSIRO- MK3-6-0 are investigated by analyzing their precipitation differences with the MME. The results indicate that FGOALS-g2, GISS-E2-R, BCC-CSM1, and CNRM-CM5 fail to capture the Asian monsoon precipitation over the south slope of the Tibetan Plateau and East Asia, resulting in their poor skill in capturing the SAH. In contrast, the CSIRO-MK3-6-0 model simulates too strong a monsoon precipitation over the south Tibetan Plateau and East Asia, which leads to the abnormal intensification of the SAH.
Acknowledgments
This study was jointly funded by the National Basic Research Program of China (Grant No. 2014CB953904), the National Natural Science Foundation of China (Grant Nos. 91337110, 41405091, and 41305065), and the State Key Laboratory of Loess and Quaternary Geology (Grant No. SKLLQG1216).
| 1 |
|
| 2 |
|
| 3 |
|
| 4 |
|
| 5 |
|
| 6 |
|
| 7 |
|
| 8 |
|
| 9 |
|
| 10 |
|
| 11 |
|
| 12 |
|
| 13 |
|
| 14 |
|
| 15 |
|
| 16 |
|
| 17 |
|
| 18 |
|
| 19 |
|
| 20 |
|
| 21 |
|
| 22 |
|
| 23 |
|