Quadrant-Averaged Structure and Evolution Mechanisms of a Northeast Cold Vortex during Its Mature Stage
[LI Wei1, 2 , SHEN Xin-Yong1 , FU Shen-Ming3, *  , LI Wan-Li
4 ]
, LI Wan-Li|
|


A Northeast China cold vortex (NCCV) that maintained from 0200 UTC 3 July to 0500 UTC 3 July 2013 and caused several heavy rainfall events was analyzed in detail to reveal its quadrant-averaged structure and main maintaining mechanisms during its mature stage. Results indicated the vortex’s intensity, divergence, ascending motions, precipitable water (PW), and thermal structures were all characterized by significant unevenness, and their main pattern changed gradually during the mature stage. Mechanisms accounting for the maintenance of the NCCV were also characterized by remarkable unevenness. Within different quadrants, dominant factors for the vortex’s evolution may have differed from each other significantly. The NCCV-averaged vorticity budget revealed that the vertical advection of vorticity, which is closely related to convective activities, was the most favorable factor for maintaining the NCCV, whereas the tilting effect, which is closely related to the vertical shear of the horizontal wind (horizontal vorticity), was the most detrimental factor.
Cut-off lows (COLs) are closed lows with significant cold centers/troughs in the middle and upper troposphere (Palmen and Newton, 1969; Price and Vaughan, 1992). This type of low system is closely related to disaster weathers such as torrential rainfall events, cold damage, and severe convective activities (Matsumoto et al., 1982; Singleton and Reason, 2007; Zhao and Sun, 2007; Hu et al., 2010). In addition, COLs play an important role in the tropospheric ozone balance process through the troposphere-stratosphere exchanges (Gimeno et al., 1998; Yang and Lu, 2003).
Generally, COLs last for about two to three days, with very few persisting for more than five days, and most COLs are slow-moving (Price and Vaughan, 1992; Nieto et al., 2005). In the Northern Hemisphere, there are three active regions (Nieto et al., 2005; Singleton and Reason, 2007) and Chinese meteorologists call the COLs over Northeast China as the Northeast China cold vortices (NCCVs; Zheng et al., 1992). NCCVs can produce disaster weathers that influence Northeast China, Korea, East Russia, and even Japan (Zhao and Sun, 2007; Hu et al., 2010); moreover, NCCVs account for the weather for up to 40% of the total number of days from April to October (Zheng et al., 1992; Sun et al., 1994). Therefore, the NCCV has formed a focus for many studies over a long time. These studies include three main areas. The first area looks at climatological and statistical features of NCCVs (Zheng et al., 1992; Zhao and Sun, 2007; Hu et al., 2010). The second area focuses on the background environmental conditions and disaster weathers associated with NCCVs (Tao, 1980; Zheng et al., 1992; Sun et al., 1994). The third area examines the structure, evolution mechanisms, and energy features of NCCVs (Mao and Qu, 1997; Fu and Sun, 2012; Xia et al., 2012).
It should be noted that the horizontal structure and maintaining mechanisms of the NCCV are characterized by significant unevenness (Tao, 1980; Zheng et al., 1992; Fu and Sun, 2012; Xia et al., 2012). The unevenness may determine the distribution of disaster weathers within different quadrants of the NCCV. Although some studies focus on the horizontal structure of the NCCV (Zheng et al., 1992; Fu and Sun, 2012), the main features of the horizontal unevenness are less discussed. Therefore, the purpose of this study is to investigate the unevenness of the NCCV’ s horizontal structure and main persisting mechanisms using a quadrant-average method under the polar coordinate, and this will be helpful to the understanding of NCCVs.
In this study, six-hourly climate forecast system (CFS) reanalysis data (with a resolution of 0.5° × 0.5° ) from the National Centers for Environmental Prediction (Saha et al., 2010) were used for the calculations. Three-hourly surface observations and hourly temperature of black body (TBB) data (with a resolution of 0.1° × 0.1° ) of the Fengyun satellite (FY)-2E were also used in this study.
The method from Rudeva and Gulev (2007, 2011), which was proven to be very effective in determining cyclone size features, was used in this study. The main procedures for determining the NCCV size were as follows:(1) Transform the original coordinate system by collocating the polar coordinate center with the NCCV center.
(2) Use the method from Akima (1970) to interpolate the geopotential height (GH) at 500 hPa onto the 36 radii (0° represents east, with 10° angular step) relative to the vortex center.
(3) Along the 36 radii, calculate 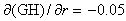
(4) Use the minimum of the 36 critical GH values to interpolate the location of the minimum critical GH along all other radii to determine the critical position. Therefore, a curve M connecting all 36 critical positions was determined, and the geometry of the NCCV was characterized by this curve. Calculate the area SM surrounded by the curve M, and the vortex effective radius ref was defined as: 
The vorticity budget equation from Kirk (2003) was used in this study to investigate the evolution mechanisms of the NCCV: 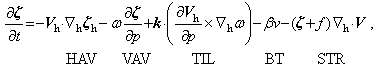
where Ξ is the vertical vorticity; Vh=ui+vj is the horizontal velocity vector (u is the zonal wind and v is the meridional wind), i, j, and k are unit vector points to the east, north, and zenith, respectively; 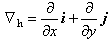


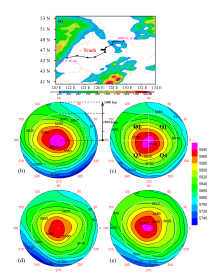
In this study, the NCCV formed at 0200 UTC 3 July 2013, maintained for about 72 hours, and dissipated at 0500 UTC 3 July. As Fig. 1a illustrates, the NCCV moved eastward quickly during its developing stage, remained quasi-stationary during its mature stage (0000 UTC 3 July to 1800 UTC 3 July 2013), and moved northeastward during its decaying stage. Within the NCCV’ s lifetime, several torrential rainfall events were triggered; the maximum 6-h precipitation was 124 mm and the minimum TBB was less than -50° C (not shown). In addition to the heavy rainfall events, in the southern part of the NCCV, thunderstorms and strong wind at a speed greater than 10.8 m s-1 were also observed during the mature stage.
In this study, ref at each time step of the NCCV’ s lifetime was calculated as discussed in section 2.2. All effective radii during the NCCV’ s lifetime were averaged, and the time-mean ref was approximately 750 km (Fig. 1b). In order to focus on the NCCV, the effective area (EA) of the NCCV was determined by the time-mean ref. In order to describe the unevenness of the NCCV, four quadrants (counterclockwise) were defined: Q1 (0° -90° ), Q2 (90° -180° ), Q3 (180° -270° ), and Q4 (270° -360° ). The quadrant-average was calculated within Q1-Q4, respectively; and the vortex-average was calculated within the EA (Fig. 1).
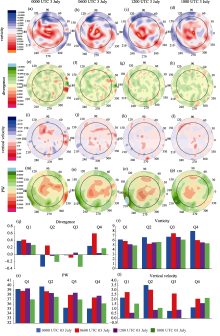
During the mature stage of the NCCV, the vortex was strong, and its closed GH center was below 5540 gpm (Figs. 1b-e). Intense positive vorticity mainly appeared within the EA (Figs. 2a-d), particularly around the vortex center, whereas negative vorticity mainly occurred around the vortex’ s circumference. The vortex-averaged vorticity decreased gradually, and the positive vorticity within Q3-Q4 was generally more intense than that within Q1-Q2 (Fig. 2r). The distribution of divergence within the EA was in a somewhat spoke-like pattern (Figs. 2e-h). Overall, Q2-Q3 was mainly characterized by convergence (Fig. 2q), whereas Q1 and Q4 were generally characterized by significant divergence.
The EA of the NCCV was mainly dominated by ascending motions and, around the NCCV center, ascending motions were stronger (Figs. 2i-l). As Fig. 2t illustrates, during the earlier period of the mature stage, ascending motions within Q1-Q2 were much stronger than those within Q3-Q4. During the later period, ascending motions were maximized within Q4, whereas Q3 was mainly characterized by weak ascending motions. Precipitable water (PW) of the entire atmospheric column is shown in Figs. 2m-p, from which it can be seen that the PW center was mainly located around the NCCV center. PW within Q1-Q2 was generally higher than that within Q3-Q4 (Fig. 2s), and PW within different quadrants of the NCCV gradually became homogeneous. From the configuration of the PW and ascending motions (Figs. 2s and 2t) during the earlier period of the mature stage, precipitation was more likely to occur within Q1-Q2; whereas, during the later period, precipitation was more likely to occur within Q4. This result can also be identified by the precipitation observation (not shown).
 | Figure 1 (a) The terrain around Northeast China (shaded, units: m) and the track of the Northeast China cold vortex (NCCV), where circles denote the developing stage, rectangles denote the mature stage, and the triangles denote the decaying stage. Panels (b-e) show the geopotential height at 500 hPa (shading and contours; units: gpm), where the white dashed circles stand for the mean effective radius during the mature stage: (b) 0000 UTC 3 July; (c) 0600 UTC 3 July; (d) 1200 UTC 3 July; (e) 1800 UTC 3 July 2013. |
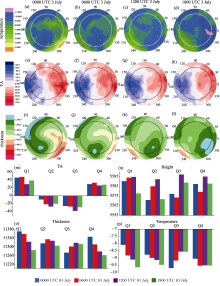
The cold center of the NCCV rotated slowly (counterclockwise) around the vortex’ s center (Figs. 3a-d), and the cold region within the EA gradually became larger, implying that the thermal structure of the NCCV changed slowly. During the earlier period of the mature stage, Q1-Q2 was warmer than Q3-Q4 (Fig. 3p); whereas during the later stage, Q3 was the warmest quadrant. As Figs. 3e-h show, temperature advection (TA) was nearly axisymmetric relative to the diameter across 100° . Q2-Q3 was mainly dominated by the cold TA (Fig. 3m), whereas Q1 and Q4 were mainly characterized by a strong warm TA. Moreover, warm TA maximized within Q1 and cold TA reached maxima within Q3. Since the NCCV mainly stretched in the layer of 900-200 hPa during the mature stage, the difference of GH at 200 and 900 hPa was used to describe the thickness of the NCCV. From Figs. 3i-l, the distribution of the thickness was very similar to that of the temperature at 500 hPa (Figs. 3a-d). During the earlier period of the mature stage, thickness minimized within Q3 and maximized within Q1 (Fig. 3o); whereas, during the later period, thickness minimized within Q4.
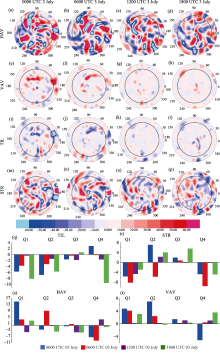
As Figs. 4a-d show, HAV within the EA was also characterized by significant unevenness. The net effect of HAV within the EA was beneficial to the NCCV’ s maintenance during the earlier period of the mature stage (Table 1); whereas, during the later period, HAV acted conversely. From Fig. 4s, HAV within Q1 was mainly favorable for the NCCV’ s maintenance, whereas within other quadrants HAV generally acted in an opposite manner. The distribution of VAV (Figs. 4e-h) was very similar to that of the vertical velocity (Figs. 2i-l), and the net effect of VAV within the EA was generally favorable for the NCCV’ s persistence (Table 1). During the earlier period of the mature stage, VAV within Q1-Q2 was much more favorable for the NCCV’ s maintenance than other quadrants (Fig. 4t), whereas during the later period conditions within Q4 were the most favorable.
 | Figure 2 (a-d) Vorticity (units: 10-5 s-1), (e-h) divergence (units: 10-5 s-1), (i-l) vertical velocity (units: cm s-1) at 500 hPa, and (m-p) whole-atmosphere precipitable water (PW) (units: kg m-2) during the mature stage of the NCCV (0000 UTC 3 July to 1800 UTC 3 July 2013), where the dashed circles stand for the effective region of the cyclone. Panels (q-t) show quadrant-averaged divergence (units: 10-5 s-1), vorticity (units: 10-5 s-1), PW (units: kg m-2), and vertical velocity (cm s-1), respectively. Typical regions for divergence and ascending motions are marked with dotted areas. |
 | Figure 3 (a-d) Temperature (units: ° C), (e-h) TA at 500 hPa (units: 10-5 K s-1), and (i-l) the thickness of 900-200 hPa (units: gpm) during the mature stage of the NCCV (0000 UTC 3 July to 1800 UTC 3 July 2013), where the dashed circles stand for the effective region of the cyclone. Panels (m-p) show quadrant-averaged temperature advection (TA) (units: 10-5 K s-1), geopotential height (units: gpm), thickness of 900-200 hPa (units: gpm), and temperature (units: ° C), respectively. |
Negative TIL dominated the EA of the NCCV (Figs. 4i-l), and its net effect was mainly detrimental for the NCCV’ s maintenance (Table 1). From Fig. 4q, negative TIL within Q1-Q2 was generally more intense than that within Q3-Q4. STR within the EA was also characterized by significant unevenness (Figs. 4m-p), and its distribution was very similar to that of the divergence (Figs. 2e-h). STR within Q1 and Q4 were mainly detrimental for the NCCV’ s maintenance; whereas, within Q2-Q3, STR mainly favored the vortex’ s persistence (Fig. 4r). Overall, the net effect of STR within the EA of the NCCV was detrimental for the NCCV’ s maintenance (Table 1).
 | Figure 4 Vorticity budget results (units: 10-10 s-2) during the mature stage of the NCCV (0000 UTC 3 July to 18 UTC 3 July 2013): (a-d) HAV; (e-h) VAV; (i-l) TIL; and (m-p) STR. Panels (q-t) show the quadrant-averaged vorticity budget terms (units: 10-10 s-2) at 500 hPa. |
| Table 1 The NCCV-averaged vorticity budget terms during the mature stage. |
As shown in Table 1, the total effect (TOT) was mainly negative within the EA, which indicates that the intensity of the NCCV weakened gradually during the mature stage. Term TIL was the most detrimental factor for the vortex’ s persistence (Table 1); whereas, term VAV, which is closely related to the convective activities, was the most favorable factor for the maintenance of the vortex.
In this study, an NCCV that lasted for about three days and caused several heavy rainfall events was analyzed in detail to reveal the quadrant-averaged horizontal structure and main maintaining mechanisms of the NCCV. Results indicated that the NCCV was more intense within Q3-Q4. Convergence mainly occurred within Q2-Q3, whereas divergence mainly appeared within Q1 and Q4. The configuration of ascending motions and PW indicated that during the earlier period of the mature stage, precipitation was more likely to occur within Q1-Q2; whereas, during the later period, precipitation was more likely to occur within Q4. The thickness associated with the NCCV changed gradually: during the earlier period of the mature stage, thickness minimized within Q3 and maximized within Q1; whereas during the decaying stage, thickness minimized within Q4.
Mechanisms accounting for the maintenance of the NCCV were characterized by remarkable unevenness. HAV within Q1 generally favored the NCCV’ s maintenance, whereas within other quadrants HAV mainly acted conversely. VAV was mainly conducive to the NCCV’ s persistence: during the earlier period of the mature stage, VAV within Q1-Q2 was much more favorable for the NCCV’ s maintenance than that within Q3-Q4; whereas during the later stage, VAV within Q4 was the most favorable. TIL generally acted as resisting the NCCV’ s maintenance, and TIL within Q1-Q2 was generally more detrimental for the NCCV’ s persistence than in other quadrants. The net effect of STR within the EA was detrimental for the NCCV’ s maintenance: STR within Q1 and Q4 was generally detrimental for the vortex’ s maintenance, whereas STR within Q2-Q3 mainly acted in an opposite manner.
Acknowledgments
The authors thank the National Centers for Environmental Prediction (NCEP) and China Meteorological Administration (CMA) for providing the data. This research was supported by the National Natural Science Foundation of China (Grant Nos. 41205027, 41375053, and 41375058).
| 1 |
|
| 2 |
|
| 3 |
|
| 4 |
|
| 5 |
|
| 6 |
|
| 7 |
|
| 8 |
|
| 9 |
|
| 10 |
|
| 11 |
|
| 12 |
|
| 13 |
|
| 14 |
|
| 15 |
|
| 16 |
|
| 17 |
|
| 18 |
|
| 19 |
|
| 20 |
|