On the Relationship between the Northern Limit of Southerly Wind and Summer Precipitation over East China
MEI Shuang-Li1, 2  , CHEN Wen
1 , CHEN Shang-Feng1
, CHEN Wen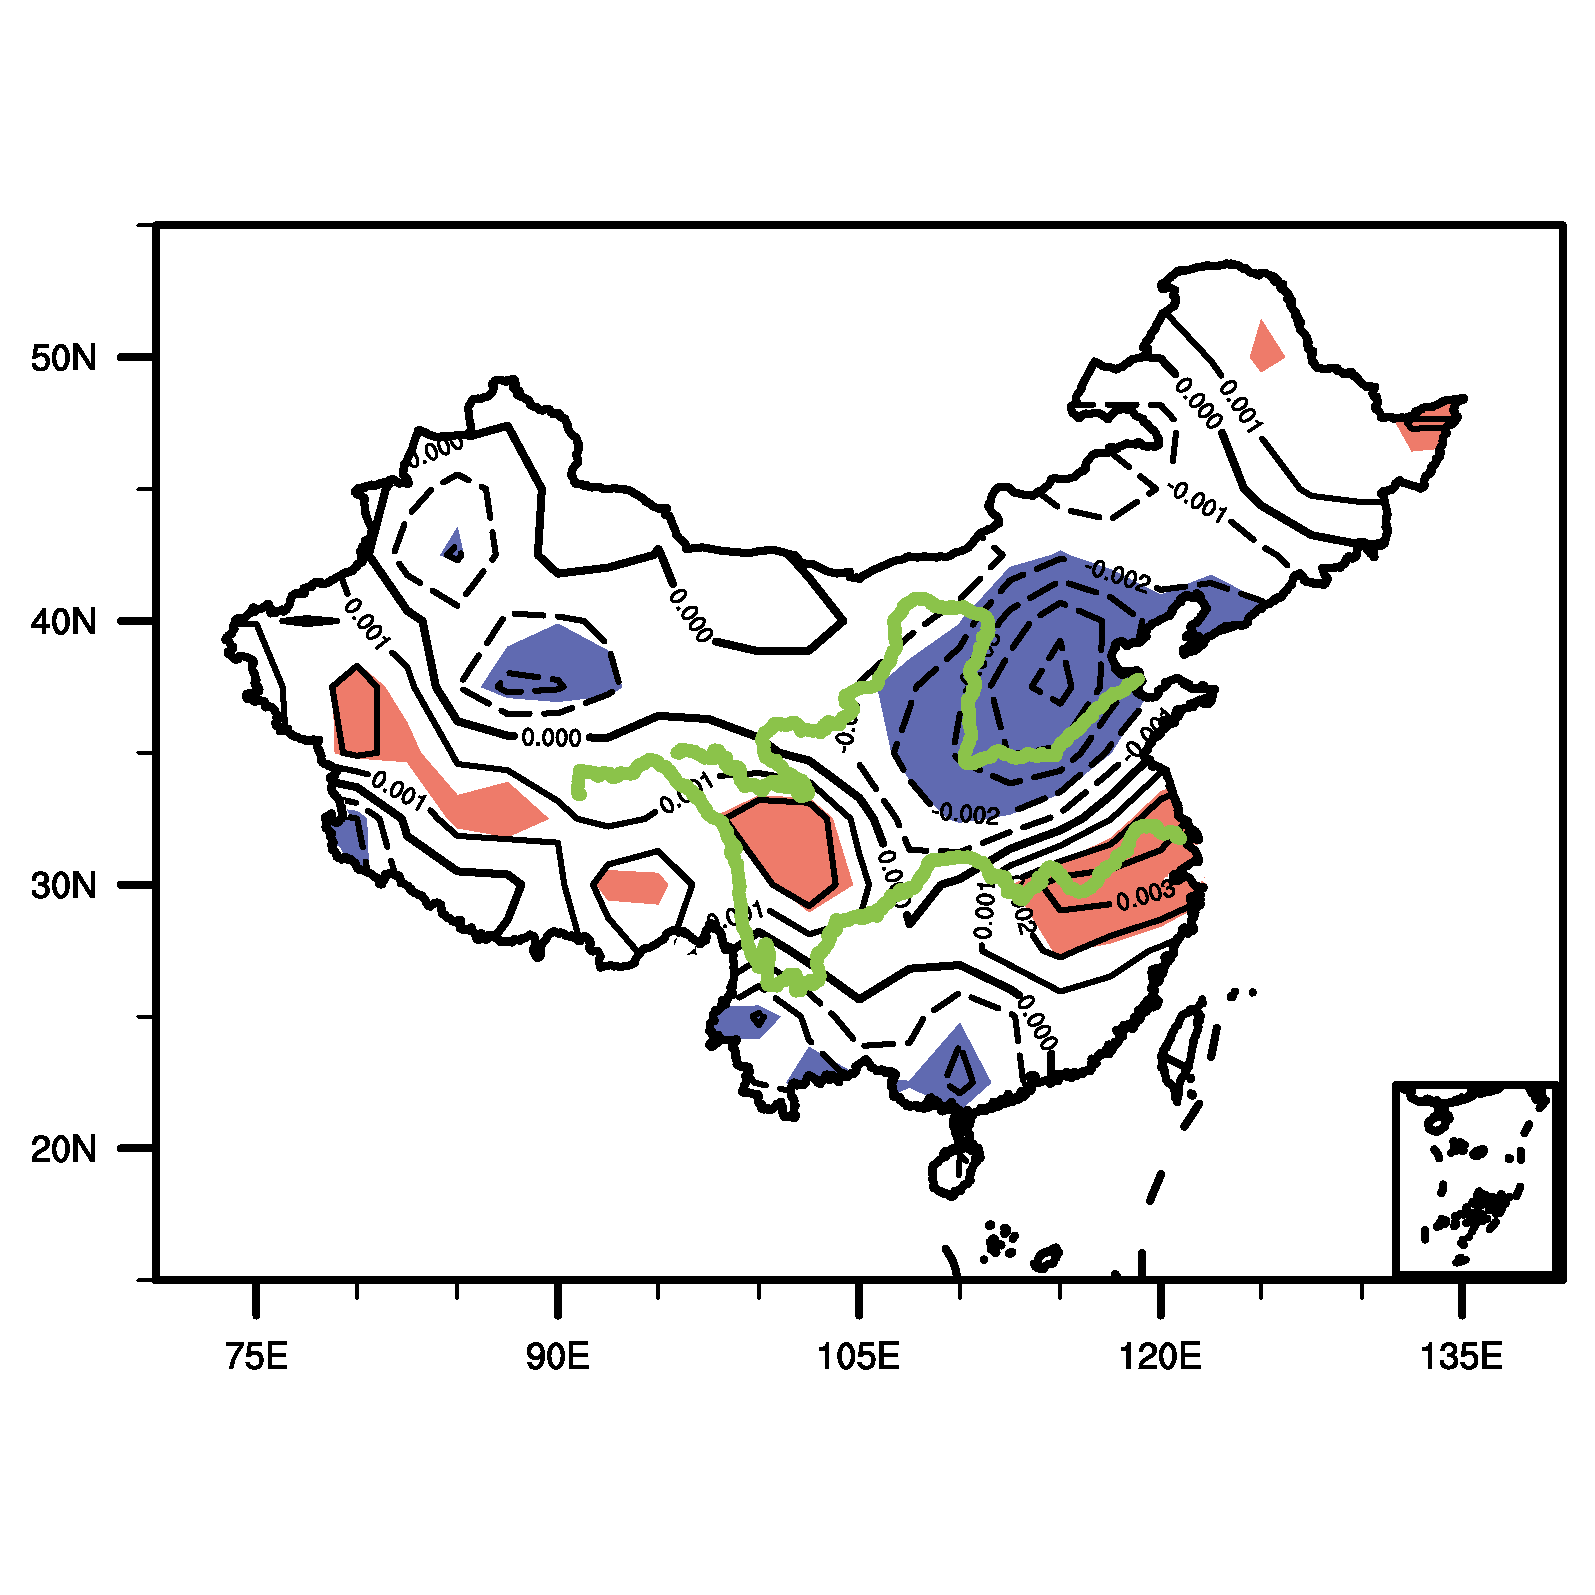
On the Relationship between the Northern Limit of Southerly Wind and Summer Precipitation over East China |
|
MEI Shuang-Li
, CHEN Wen |
| Figure 3 Anomalies of vertical velocity at 500 hPa in JJA regressed on the I NLSSW during 1958-2001. Red Blue shading denotes positive negative anomalies that are significantly different from zero at the 95% confidence level. Contour interval is 0.001 Pa s -1 . Note that positive negative values of vertical velocity represent downward upward motion. |
| |