Trends of Lower- to Mid-Stratospheric Water Vapor Simulated in
Chemistry-Climate Models
HU Ding-Zhu1 , HAN Yuan-Yuan1 , SANG Wen-Jun1 , XIE Fei2, * 
Trends of Lower- to Mid-Stratospheric Water Vapor Simulated in Chemistry-Climate Models |
|
HU Ding-Zhu
|
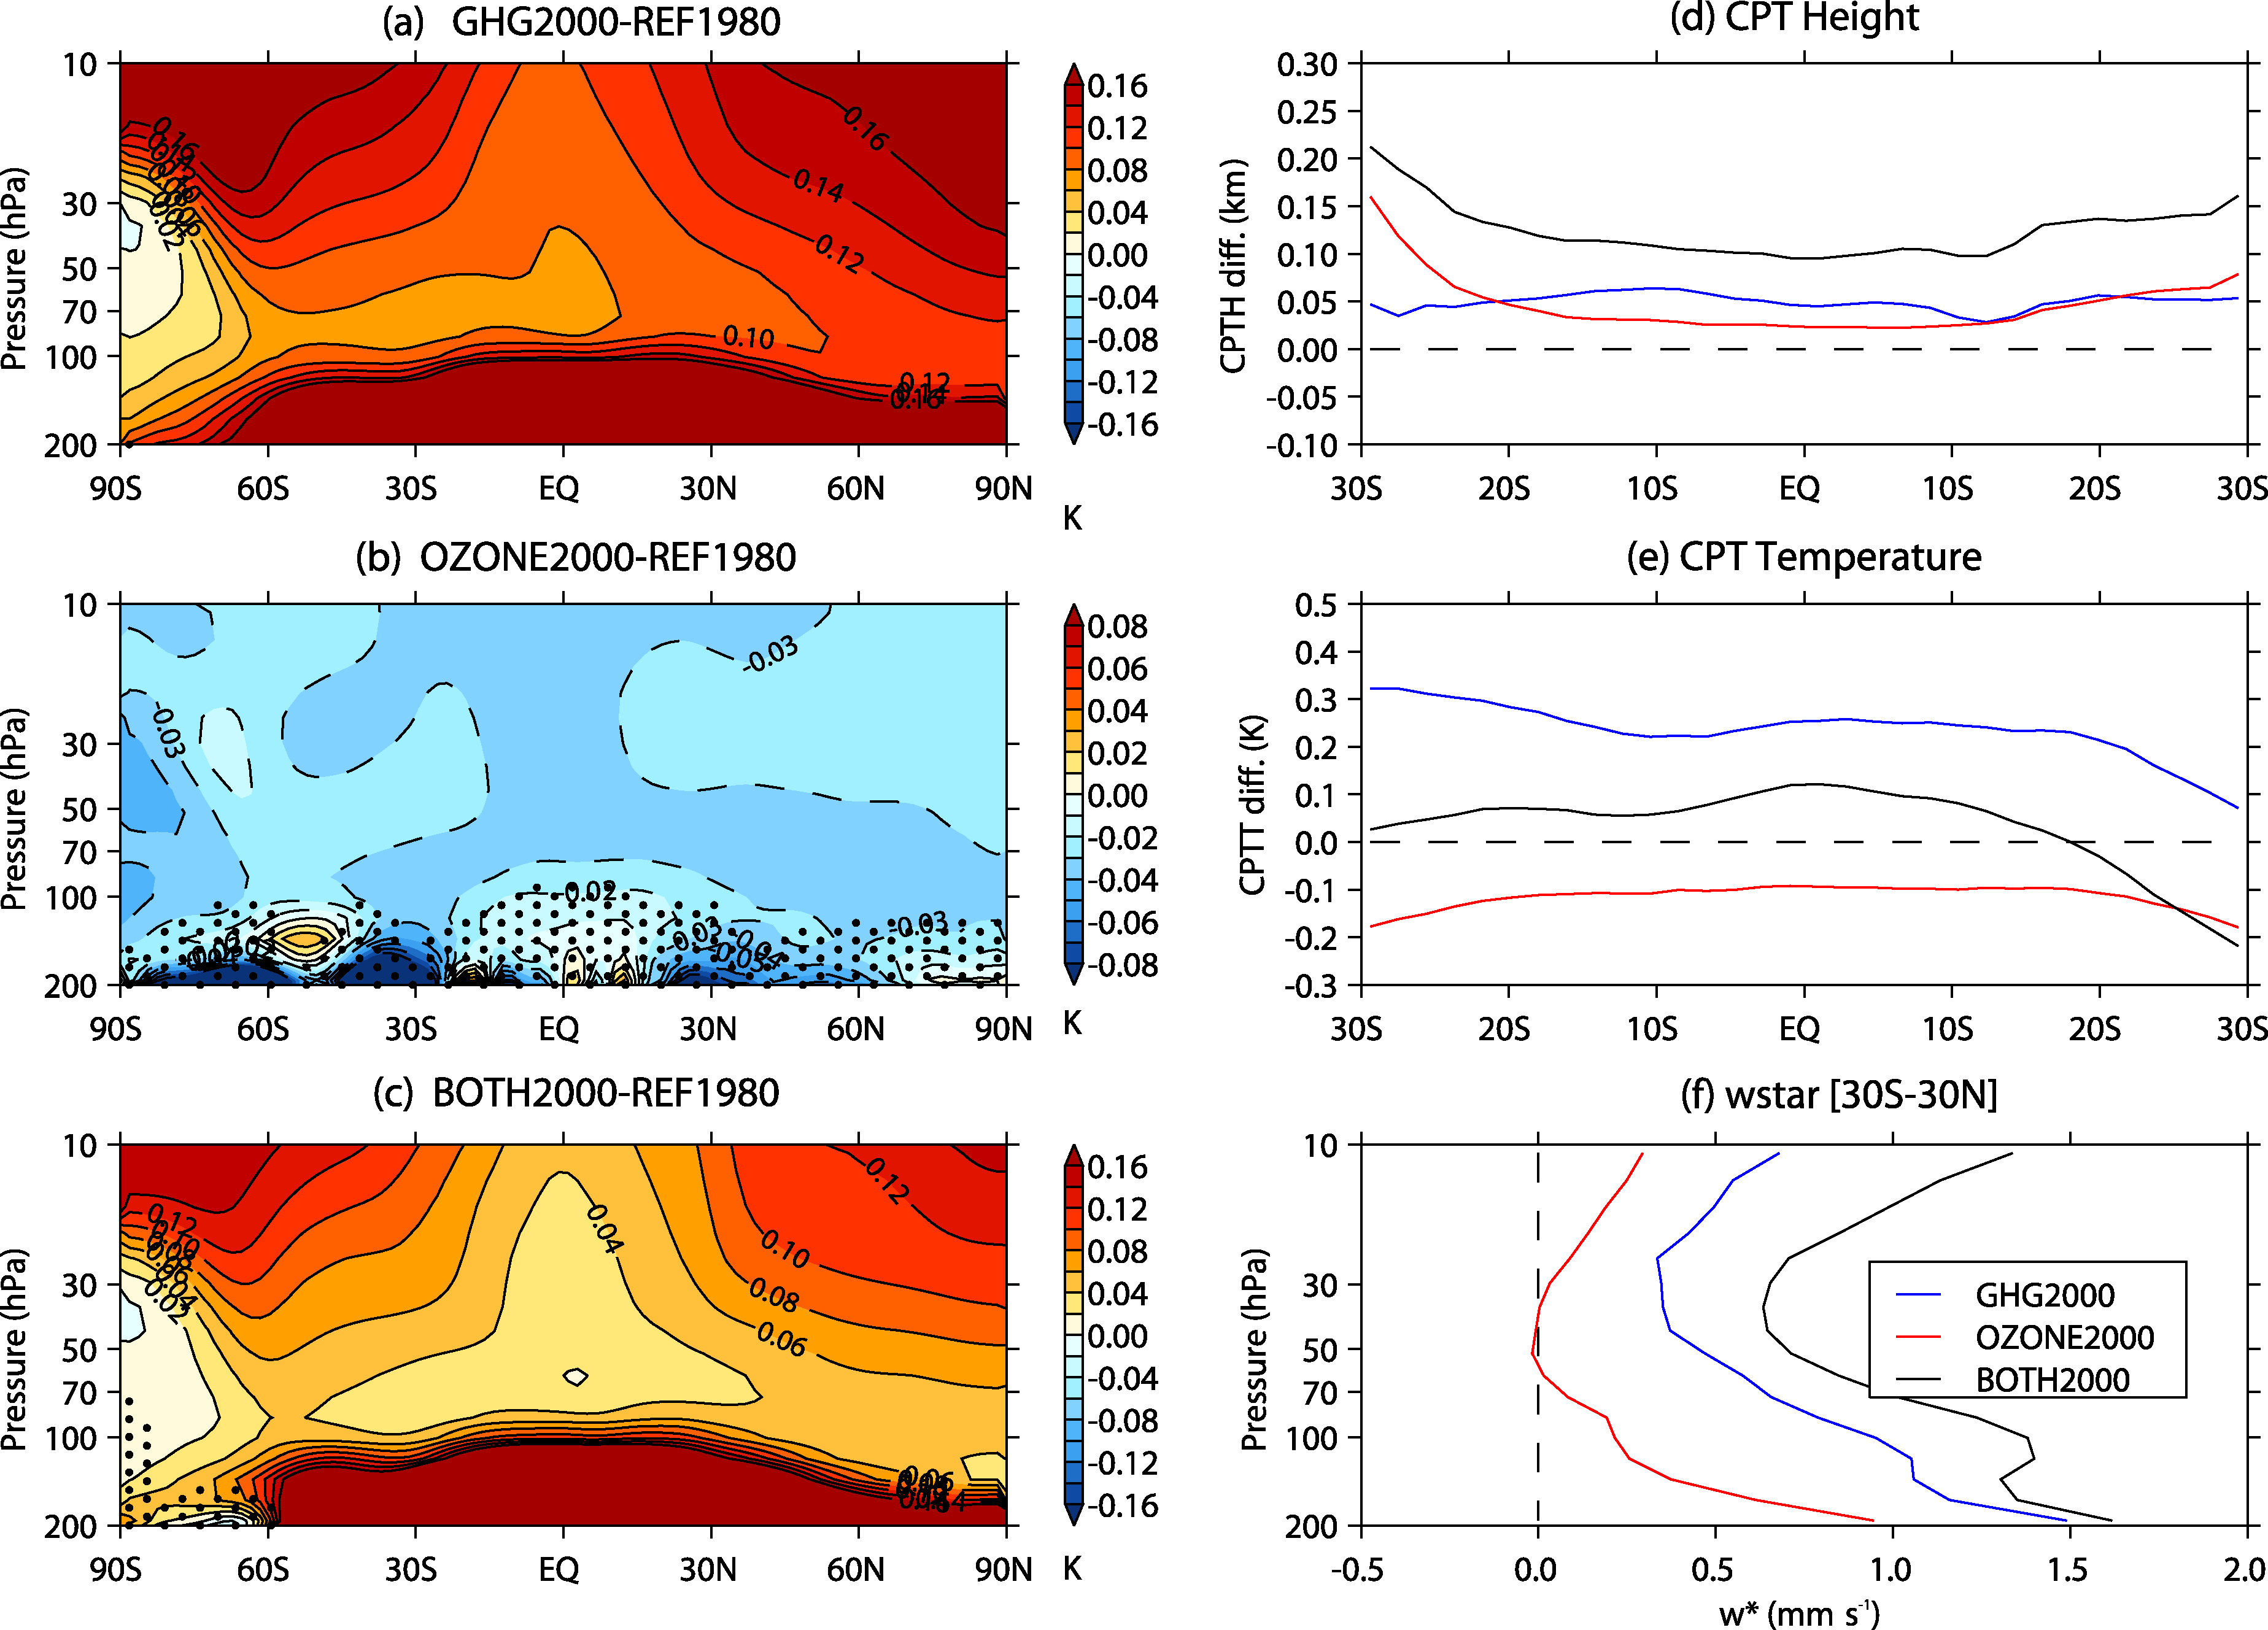
| Figure 4 Zonal and annual mean water vapor differences between runs a GHG2000 and REF1980, b OZONE2000 and REF1980, and c BOTH2000 and REF1980. The dotted areas indicate regions where the statistically does not exceed the 99% confidence level. The contour intervals for a, c are 0.02 ppmv and for b are 0.01 ppmv. The positive and negative contours in a-c are represented by solid and dashed lines, respectively. Differences in zonal and annual mean d cold-point tropopause CPT height, e CPT temperature, and f w #cod#x0002A; vertical velocity components of Brewer-Dobson Circulation averaged over 30#cod#x000b0;S-30#cod#x000b0;N between the runs of GHG2000, OZONE2000, BOTH2000, and REF1980. |
| |