A Preliminary Evaluation of Global and East Asian Cloud Radiative Effects in Reanalyses
[LI Jian-Dong1, 2  , MAO Jiang-Yu
1, 3 ]
, MAO Jiang-Yu|
|


Citation: Li, J.-D., and J.-Y. Mao, 2015: A preliminary evaluation of global and East Asian cloud radiative effects in reanalyses, Atmos. Oceanic Sci. Lett., 8, 100-106.
doi:10.3878/AOSL20140093.
Received:22 December 2014; revised:11 February 2015; accepted:3 March 2015; published:16 March 2015
Cloud radiative effects (CREs) at the top of the atmosphere (TOA) in three reanalysis datasets (the European Center for Medium-Range Weather Forecasts Interim Reanalysis (ERA-Interim), the Japanese 55-yr Reanalysis Project (JRA-55), and the Modern-Era Retrospective Analysis for Research and Applications (MERRA)) are evaluated using recent satellite-based observations. The reanalyses can basically capture the spatial pattern of the annual mean shortwave CRE, but the global mean longwave CRE in ERA-Interim and JRA55 is weaker than observed, leading to overestimations of the net CRE. Moreover, distinct CRE biases of the reanalyses occur in the Intertropical Convergence Zone (ITCZ), coastal Pacific and Atlantic regions, and East Asia. Quantitative examination further indicates that the spatial correlations of CREs and TOA upward radiation fluxes with corresponding observations in ERA-Interim are better than in the other two reanalyses. Although MERRA has certain abilities in producing the magnitudes of global mean CREs, its performance in terms of spatial correlations in winter and summer are worse than for the other two reanalyses. The ability of JRA55 in reflecting CREs lies between the other two datasets. Compared to the global mean results, the spatial correlations of shortwave CRE in East Asia decrease and the biases of regional mean CREs increase in the three reanalyses. This implies that, currently, it is still difficult to reproduce East Asian CREs based on these reanalyses. Relatively, ERA-Interim describes the seasonal variation of East Asian CREs well, albeit weaker than observed. The present study also suggests that in-depth exploration of the ability of reanalysis data to describe aspects relating to cloud properties and radiation is needed using more comprehensive observations.
Clouds strongly regulate the radiation processes and hydrological cycles of the climate system, and are the most important contributors to the radiation balance of Earth’ s climate (Stephens, 2005; Wild et al., 2013). On the one hand, clouds cool the earth by increasing outgoing shortwave (SW) radiation; while on the other hand, they have a warming effect on the climate system by increasing downward longwave (LW) radiation. Current satellite retrievals show that the net radiative effect caused by clouds is negative and close to -21.1 W m-2 (Loeb et al., 2009), and this magnitude is much larger than that of the warming effect due to greenhouse gases (Boucher et al., 2013). Moreover, clouds and associated climate effects exhibit remarkable regional characteristics due to different circulation systems and external forcings. In East Asia, regional climate and its variation are highly influenced by the monsoon systems of the region (Wang, 2006). The thermal and dynamical effects triggered by the Tibetan Plateau (TP) also modulate the Asian, or even global, climate (Wu et al., 2012). Thus, cloud effects are quite complicated and show distinct spatiotemporal distributions. Understanding cloud characteristics, climate effects and changes is therefore a key issue for the climate research community.
Among the many efforts being made in this field of research, one of the most important aspects is to quantify how clouds affect the radiation budget at the top of the atmosphere (TOA). In particular, researchers are increasingly concerned about the present effects of cloud on climate and their regional variations (Stubenrauch et al., 2013). The concept of cloud radiative effects (CREs) is widely used to quantitatively evaluate the effects of cloud on climate. CREs are determined by the differences in radiation fluxes with and without clouds at the TOA or surface (Ramanathan et al., 1989), and they are generally divided into LW CREs (LWCREs) and SW CREs (SWCREs) due to their different properties. Through CREs, cloud effects are described and validated using satellite observations and climate models. Strong CREs are observed in the ITCZ, subtropical storm track, and Southern Ocean regions (Boucher et al., 2013). In the last two decades, CRE characteristics have been extensively investigated using global climate models (GCMs). However, representing clouds and relevant radiation feedbacks remains a big challenge for current GCMs. Although most GCMs can reproduce the global pattern of CREs and net radiative balance at the TOA, more recent studies (Wang and Su, 2013; Dolinar et al., 2014) show that current GCMs still possess evident CRE biases, e.g. with respect to tropical convection, in some key regions, including in East Asia (Li et al., 2009; Zhang et al., 2013). Furthermore, individual LWCREs or SWCREs and radiative fluxes are also considerably difficult to simulate in GCMs due to their imperfect model processes.
Since current models only possess limited performance in simulating CREs, it is important to obtain a clear understanding of the abilities of the most commonly-used reanalysis datasets in representing CREs. Reanalysis products are continually improving in terms of their capability to reflect atmospheric circulation states, and thus numerous climate phenomena at various temporal scales are extensively studied through the use of such data (Simmons et al., 2010). However, little attention has been paid in this regard with respect to CREs, especially at regional scales. Currently, the best CRE estimations and associated analyses are based on satellite-retrieved radiative fluxes. However, the period of time covered by satellites is too short to provide researchers with long-term knowledge of CRE changes. Thus, it is necessary to examine how and to what extent reanalysis datasets describe CREs, both at the global and East Asian scales. Such research can not only provide more helpful information for cloud studies, but also test the possibility that reanalyses can be used for climatological and long-term CRE studies.
The objective of the present study is to preliminarily evaluate the ability of reanalysis data to describe CREs by comparing the latest satellite retrievals with three popular reanalysis datasets. We attempt to answer the following questions in this work: (1) How well do current reanalysis data reproduce TOA CREs at the global and regional scales? (2) Are reanalysis data able to capture East Asian CREs and their seasonal variations? The focus of the present study is on climatological CRE characteristics, with the behavior of LWCREs and SWCREs evaluated separately.
The satellite-retrieval radiative flux data are taken from the National Aeronautics and Space Administration (NASA) Clouds and the Earth’ s Radiant Energy System (CERES) experiment. The most recent CERES Energy Balanced and Filled at the TOA (EBAF-TOA) Ed2.8 dataset (Doelling et al., 2013) is used for the TOA radiative fluxes and CRE evaluations in this study. The CERES EBAF-TOA dataset has been widely used in studying the role of clouds and the energy cycle in the earth-climate system. Thus, it is considered as the observational dataset herein. Given that the CERES observations began in March 2000, our analysis period is from January 2001 to December 2010. Due to the limited scope of this study, only monthly results are analyzed. The spatial resolution of the CERES dataset is 1.0° latitude × 1.0° longitude.
The reanalysis datasets evaluated include the European Center for Medium-Range Weather Forecasts Interim Reanalysis (ERA-Interim), the Japanese 55-yr Reanalysis Project (JRA-55), and the Modern-Era Retrospective Analysis for Research and Applications (MERRA). Aside from the fact that they are commonly-used products, these reanalyses are chosen because they possess complete cloud and radiative output fields and thus their CREs are easily obtainable. Detailed information on the three reanalyses is listed in Table 1.
The climatology of each component of the radiative fluxes at the TOA is calculated by taking the 10-year (2001-10) average from the reanalyses and satellite-retrieved products. In the quantitative evaluations, the entire dataset is interpolated to a standard 1.5° × 1.5° grid for side-by-side comparison. The CREs are defined as follows:
LWCRE = OLRCS - OLR, (1)
SWCRE = RSUTCS - RSUT, (2)
Net CRE = LWCRE + SWCRE, (3)
where OLRCS and OLR are the outgoing LW radiative fluxes at the TOA in clear-sky and all-sky conditions, respectively; RSUTCS and RSUT are the corresponding outgoing SW radiative fluxes; and Net CRE is the arithmetic sum between LWCRE and SWCRE.
In this study, the spatial distribution is mainly described in terms of the annual mean result. The results for winter and summer are analyzed quantitatively. We restrict the global evaluation to 60° N-60° S to avoid large radiation biases between the satellite retrievals and reanalyses at high latitudes. The domain of East Asia is selected as (20-45° N, 100-150° E). The relative bias ratio of the reanalyses to the observation and the spatial correlation coefficient (SCC) are calculated as key statistical parameters to quantitatively describe the performances of the reanalysis datasets.
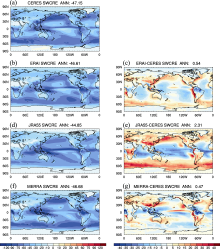
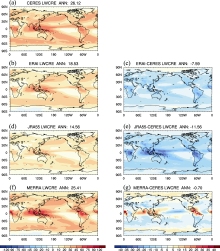
Figures 1 and 2 show the global distributions of the
| Table 1 Basic information on the three reanalyses used in this study. |
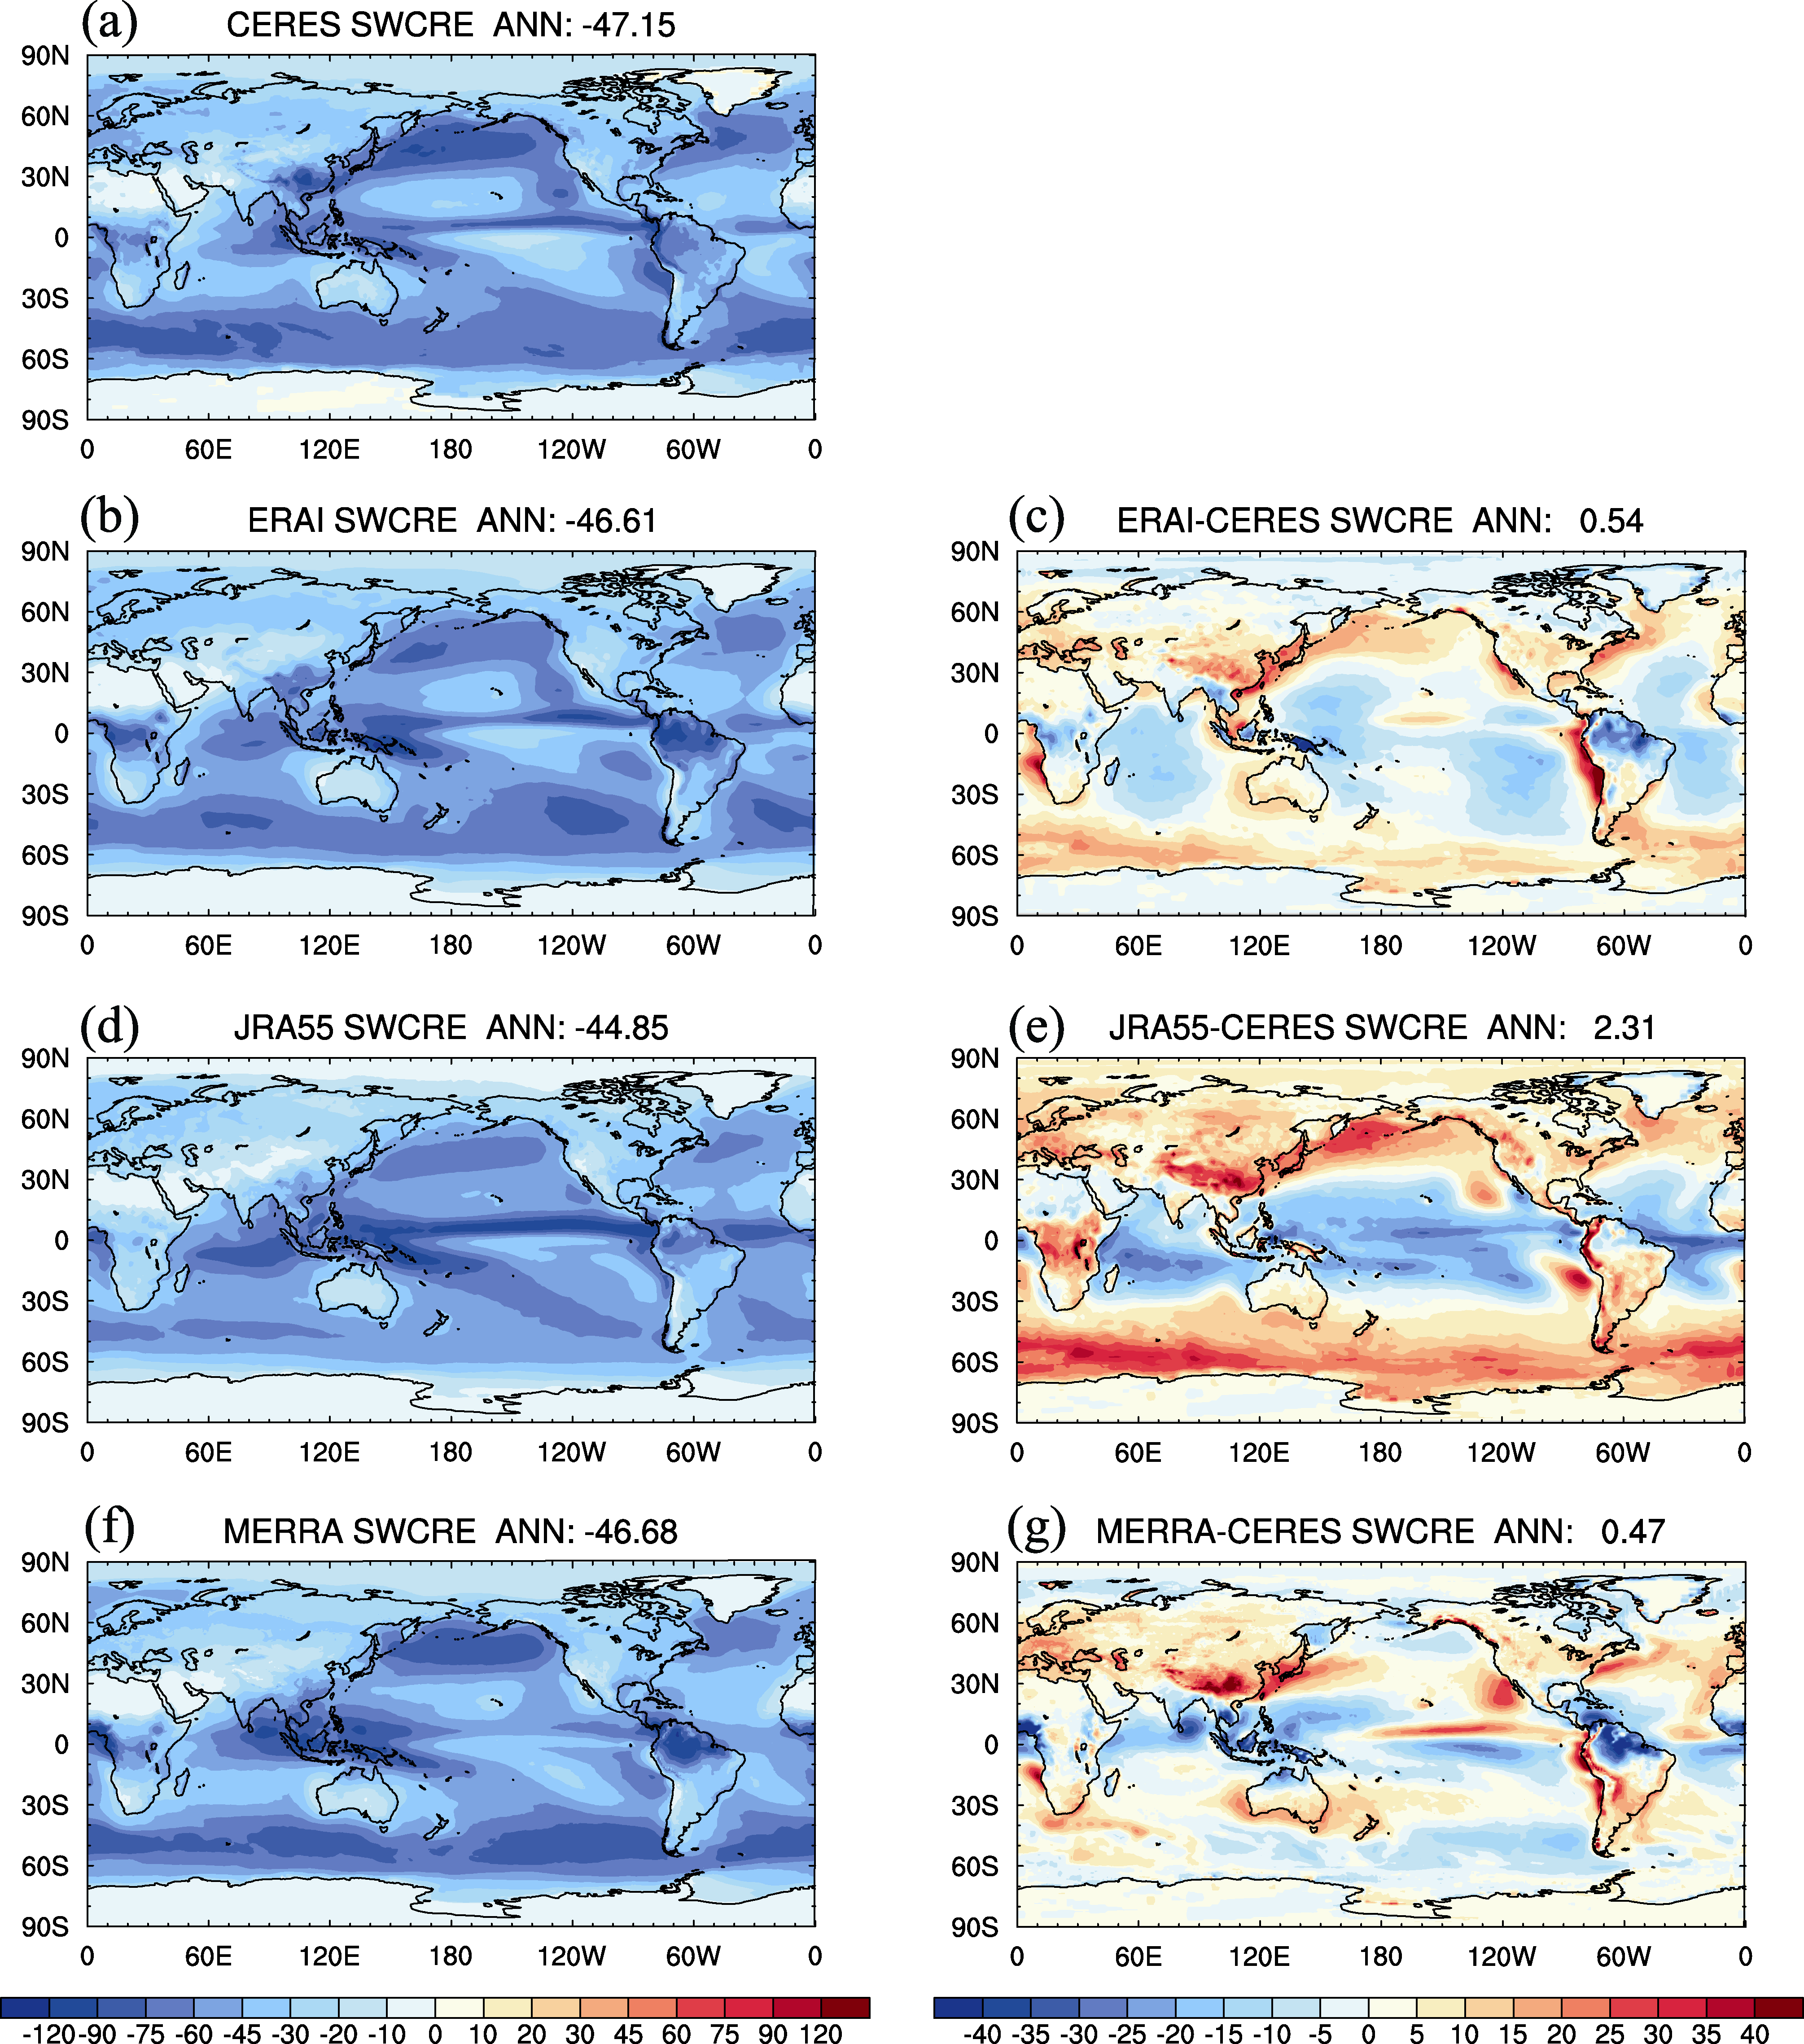 | Figure 1 Geographical distributions of the annual mean shortwave cloud radiative effect (SWCRE) (color shading; units: W m-2) in (a) Clouds and the Earth’ s Radiant Energy System (CERES), (b) European Center for Medium-Range Weather Forecasts Interim Reanalysis (ERA-Interim), (d) Japanese 55-yr Reanalysis Project (JRA55), and (f) Modern-Era Retrospective Analysis for Research and Applications (MERRA). Panels (c, e, g) are the differences between CERES and the corresponding reanalyses, respectively. The value of the globally averaged SWCRE is marked at the top of each panel. The climatology is based on the 10-year average from 2001 to 2010. |
annual mean SWCRE and LWCRE based on observational and reanalysis data. The globally averaged annual mean values of observed CREs are -47.15 and 26.12 W m-2 for SWCRE and LWCRE, respectively, leading to a net cooling CRE of -21.03 W m-2. Large CREs are distributed in the ITCZ and midlatitude oceans, such as the Maritime Continent, North Pacific, and Southern Ocean, where CREs are closely related to cloud fraction (not shown). The largest LWCRE concentrates within the tropics due to convective activities. In addition, a large SWCRE also exists in eastern China— much larger than that in other continental areas at the same latitude, possibly because of the dynamical and thermal effects of the TP on downstream cloud properties (Yu et al., 2004; Zhang et al., 2013). Unlike the LWCRE results, the magnitudes of the SWCREs in the reanalyses are more consistent with those in the observation. Basically, the three reanalyses are able to capture the spatial pattern of SWCREs, albeit with evident biases in some areas. Compared with the observation, the SWCRE in ERA-Interim and JRA55 is much weaker over the Southern Ocean and North Pacific, while all of the reanalyses have a considerably weaker SWCRE in eastern China and the coastal areas of the eastern Pacific. Meanwhile, the globally averaged LWCRE in ERA-Interim and JRA55 is 18.53 and 14.56 W m-2, respectively, both of which are significantly weaker than observed, mainly because of their intrinsic overestimations of OLR. Note that JRA55 even exhibits the weakest LWCRE in the ITCZ. The global annual mean net CREs of ERA-Interim and JRA55 are therefore -28.08 and -30.29 W m-2, respectively, both of which are much stronger than observed because of their weaker LWCREs. In contrast, the globally averaged CREs from MERRA (SWCRE: -46.68 W m-2; LWCRE: 25.41 W m-2; Net CRE: -21.27 W m-2) are most consistent with the observation, but the spatial pattern of MERRA illustrates that the larger biases of CREs exist in the tropics, such as in the Maritime Continent and Central America. In addition to the global averages, the East Asian annual mean Net CRE of -4.75 W m-2 in MERRA is also much worse than the observed value of -16.36 W m-2; the corresponding regional Net CREs in ERA-Interim and JRA55 are -13.99 and -17.55 W m-2, respectively, closer to the East Asian observational average.
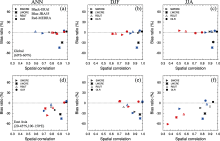
Figure 3 further shows quantitative results regarding the global and East Asian CREs and TOA radiative fluxes. In terms of the global annual mean results between 60° S and 60° N, ERA-Interim exhibits the best performance for LWCRE and SWCRE according to their bias ratios and SCCs; the performance of JRA55 is the worst among the three reanalyses with respect to CREs, OLR, and RSUT. MERRA’ s abilities regarding these variables lie between those of the other two reanalysis datasets. It is also very clear in Fig. 3a that the magnitudes of LWCRE from ERA-Interim and JRA55 are about 30% weaker than observed, but their SCCs are above 0.8 and exceed the 99% confidence level. Furthermore, the radiative variables from these two analyses are much better than MERRA in winter and summer, when the SCCs of the CREs and TOA fluxes from MERRA are below 0.8. It therefore seems that the relative better performance in the global annual mean MERRA results does not reflect the real states of radiative variables in each season. Similar situations also occur in East Asia. ERA-Interim still performs best in terms of East Asian CREs and TOA radiative fluxes. However, compared to the global averages, the CRE biases of the reanalyses increase in East Asia. In summer, the SCCs of many radiative variables are below 0.8. The SCCs of OLR and SWCRE in MERRA are less than 0.4, indicating that it is still considerably difficult for the three reanalyses, especially MERRA, to reproduce summer CREs in East Asia. Besides, most of the radiative variables are weaker in the reanalyses than in the observation over East Asia. These underestimations are likely caused by relatively poor representation of cloud amount and relevant microphysical properties over East Asia (Wang et al., 2014).
 | Figure 2 Geographical distributions of the annual mean longwave cloud radiative effect (LWCRE) (color shading; units: W m-2) in (a) CERES, (b) ERA-Interim, (d) JRA55, and (f) MERRA. Panels (c, e, g) are the differences between CERES and the corresponding reanalyses, respectively. The value of the globally averaged LWCRE is marked at the top of each panel. |
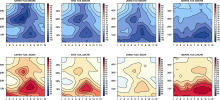
Figure 4 shows the seasonal change of zonal-mean CREs in East Asia and southern tropical regions. In the observation, a strong annual cycle of CREs occurs in two regions. The first is to the east of the TP, especially in the latitudinal range of 20-35° N, where a strong SWCRE exists from wintertime and subsequently increases to a maximum of up to -100 W m-2 by May. With the beginning of the rainy season, a strong-SWCRE belt extends and moves to the north of 40° N; with the end of the rainy season in East Asia (20-45° N), the associated SWCRE starts to rapidly decrease after August. The other remarkable CRE region is located to the south of 20° N, including the South China Sea and the tropical western Pacific. In this region, seasonal changes of CREs almost agree with those of precipitation, with maximum CREs in July and August, when the largest amounts of rain and total cloud occur.
Of the three reanalyses, ERA-Interim shows the best ability. Although the magnitudes of the CREs are somewhat underestimated, ERA-Interim can capture the temporal evolution of CREs in East Asia and tropical regions well. JRA55 can reproduce the northward evolution of CREs well, but it underestimates the CREs east of the TP in winter and early spring. MERRA shows the worst performance. Compared to observations and the other two reanalyses, MERRA’ s SWCRE magnitude in East Asia is considerably weaker; the peak of the CREs in MERRA occurs in autumn, and later than that in the observation. MERRA biases in relevant surface radiation fluxes are also quite large over East Asia, and cloud processes account for these biases (Wang and Dickinson, 2013). Moreover, the strongest SWCRE in JRA55 and MERRA appears during summertime, which implies that their influencing system relevant to CREs is dominated by rain processes.
In addition to seasonal change, the annual variation in the three reanalyses is also examined. ERA-Interim still performs best among the three datasets in terms of the global and East Asian annual variations of CREs, especially in SWCRE, but its monthly LWCRE is weaker than observed due to overestimations of all-sky OLR. Detailed analysis in this regard is beyond the scope of the present work, but will be reported in subsequent studies. Our results indicate that the CRE biases of the reanalyses, as mentioned above, very likely arise from unreasonable descriptions in cloud and radiation processes, because cloud properties and radiative effects in reanalysis data depend on further assimilation modeling. In fact, current climate models possess evident biases in cloud microphysical processes and their radiative calculations (Li et al., 2013). The complexity of the East Asian climate system also poses great challenges for climate models and relevant data assimilation processes (Zhou et al., 2009; Boo et al., 2011).
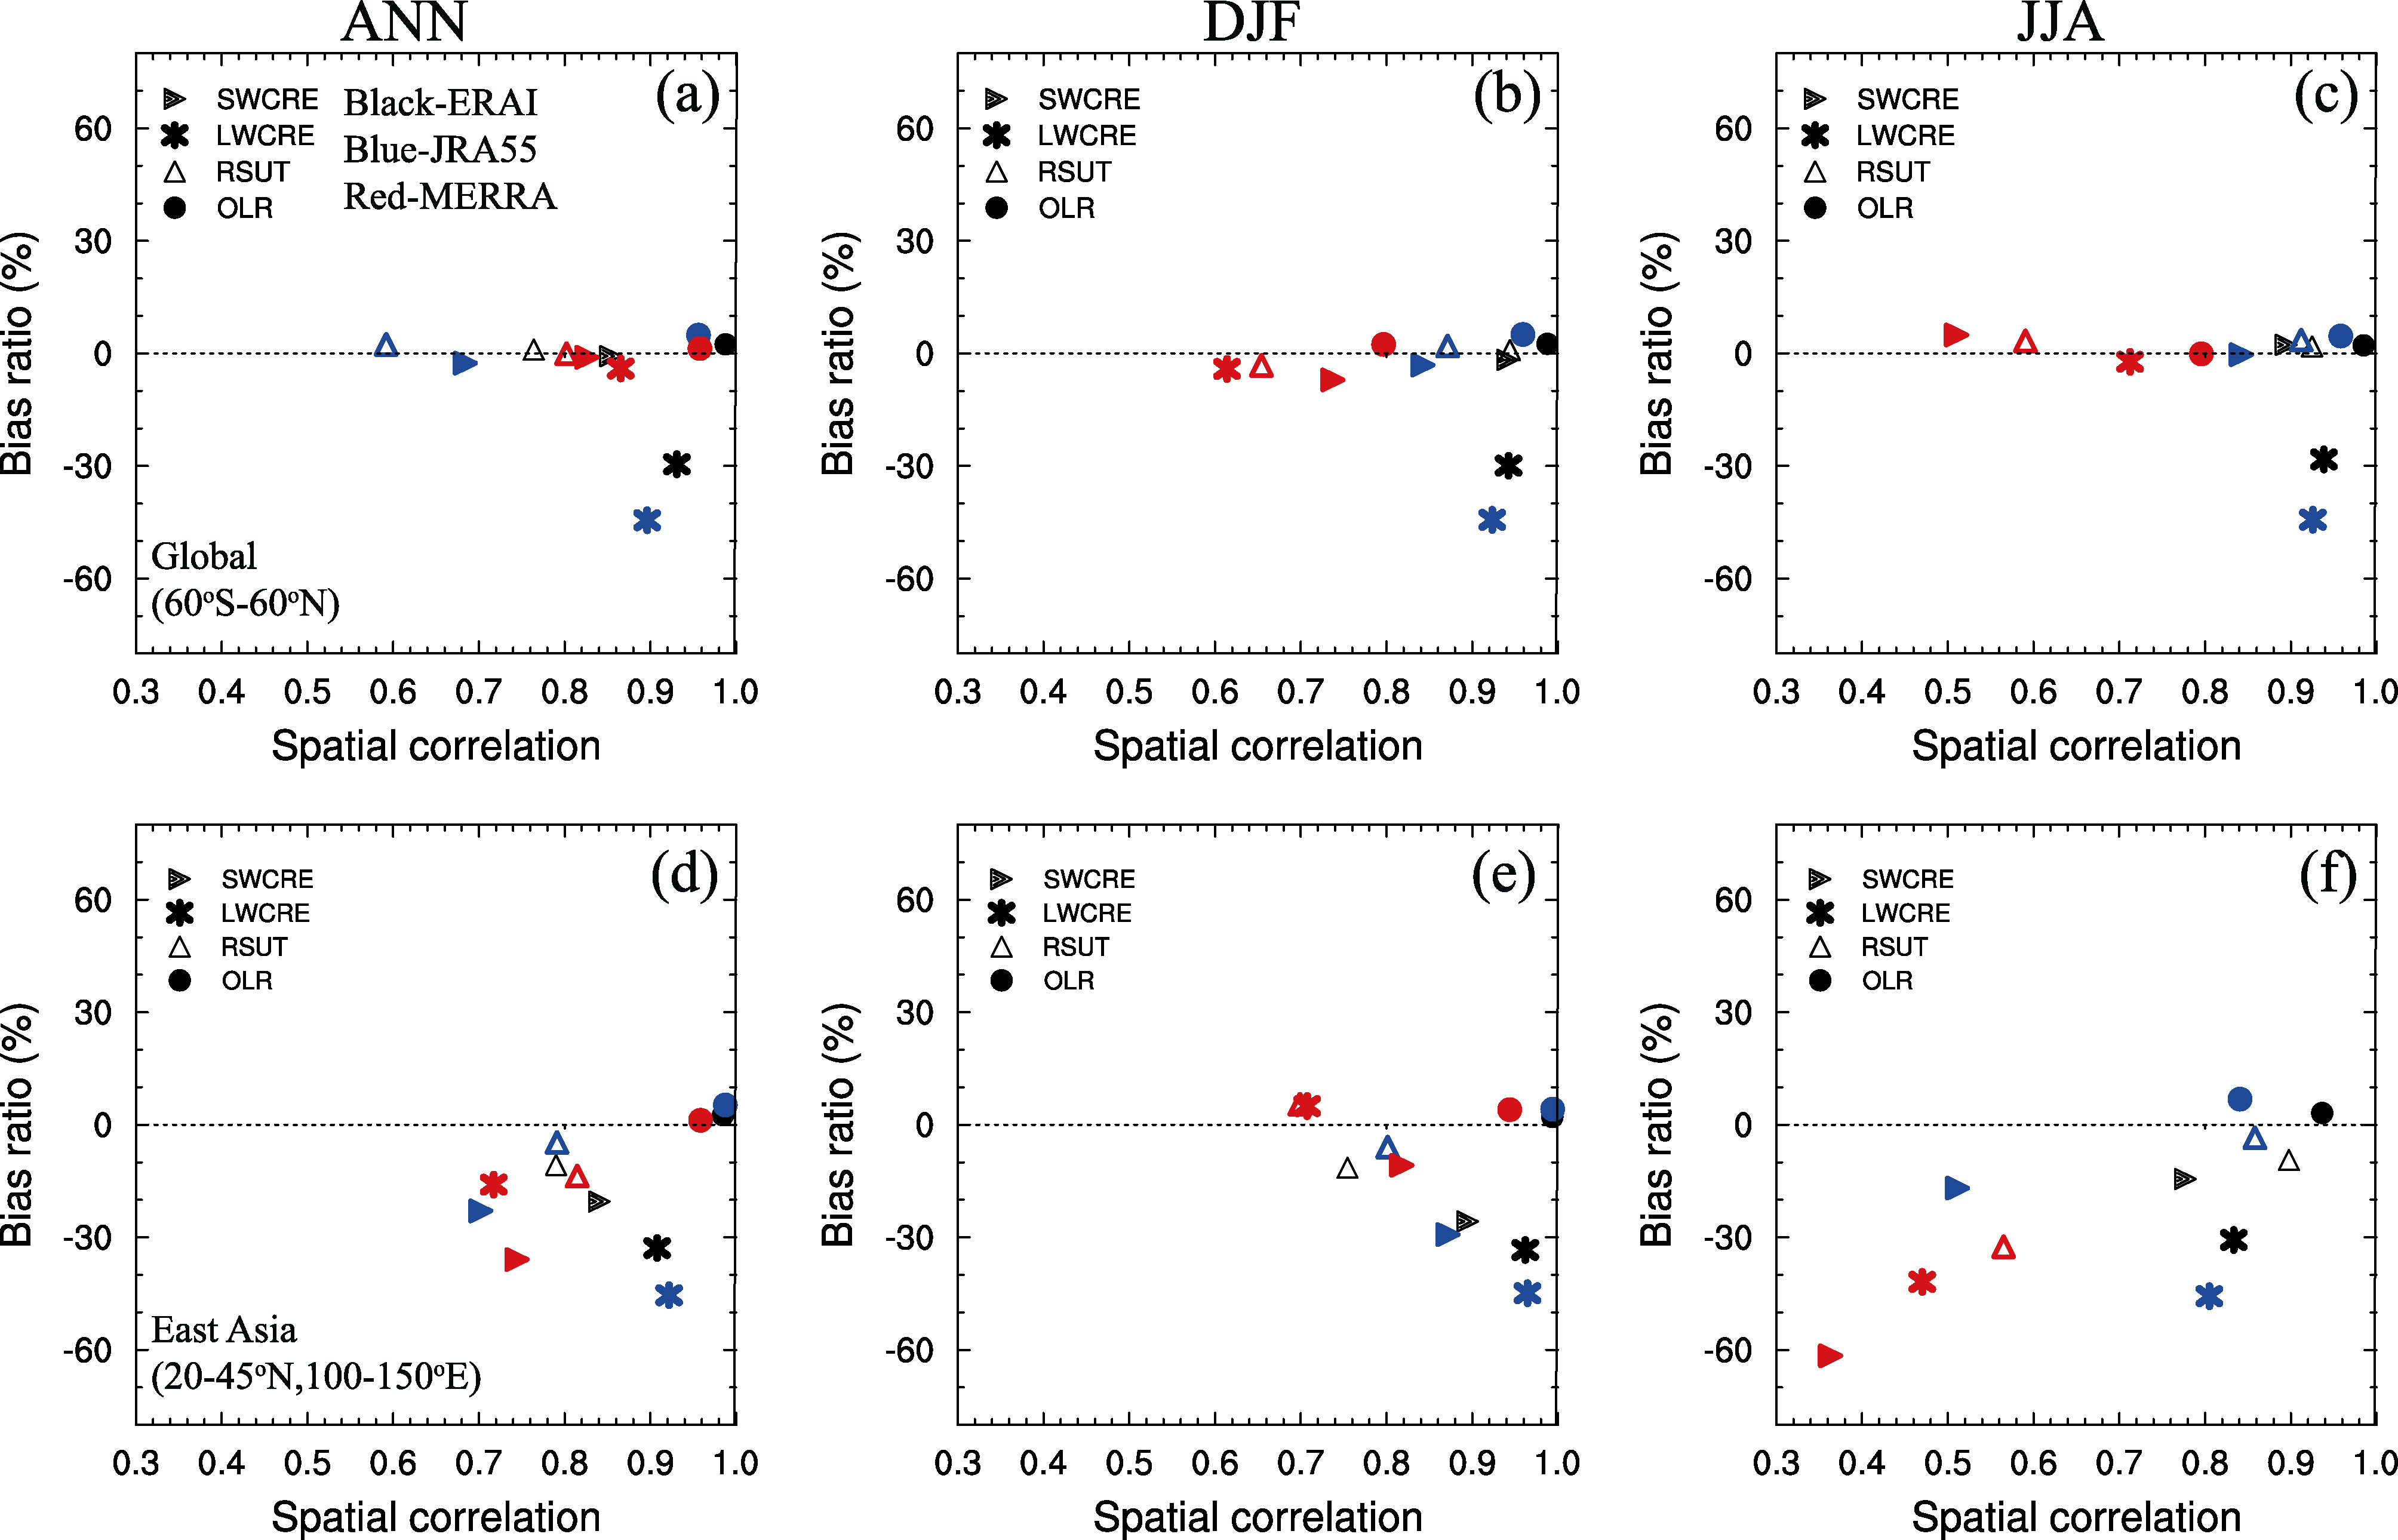 | Figure 3 Relative bias ratios and spatial correlations between the three reanalyses and the observation regarding radiative fluxes and cloud radiative effects (CREs) at the top of the atmosphere. Panels (a-c) are the global (60° S-60° N) annual, winter, and summer mean results, while (d-f) are the corresponding East Asian (20-45° N, 100-150° E) results. The x-axis denotes the spatial correlation coefficient between the reanalyses and observations; the y-axis is the bias ratio of the variables in the reanalyses to those in the observation; black, blue, and red markers are for ERA-Interim, JRA55, and MERRA, respectively; correlation coefficients exceed the 99% confidence level. |
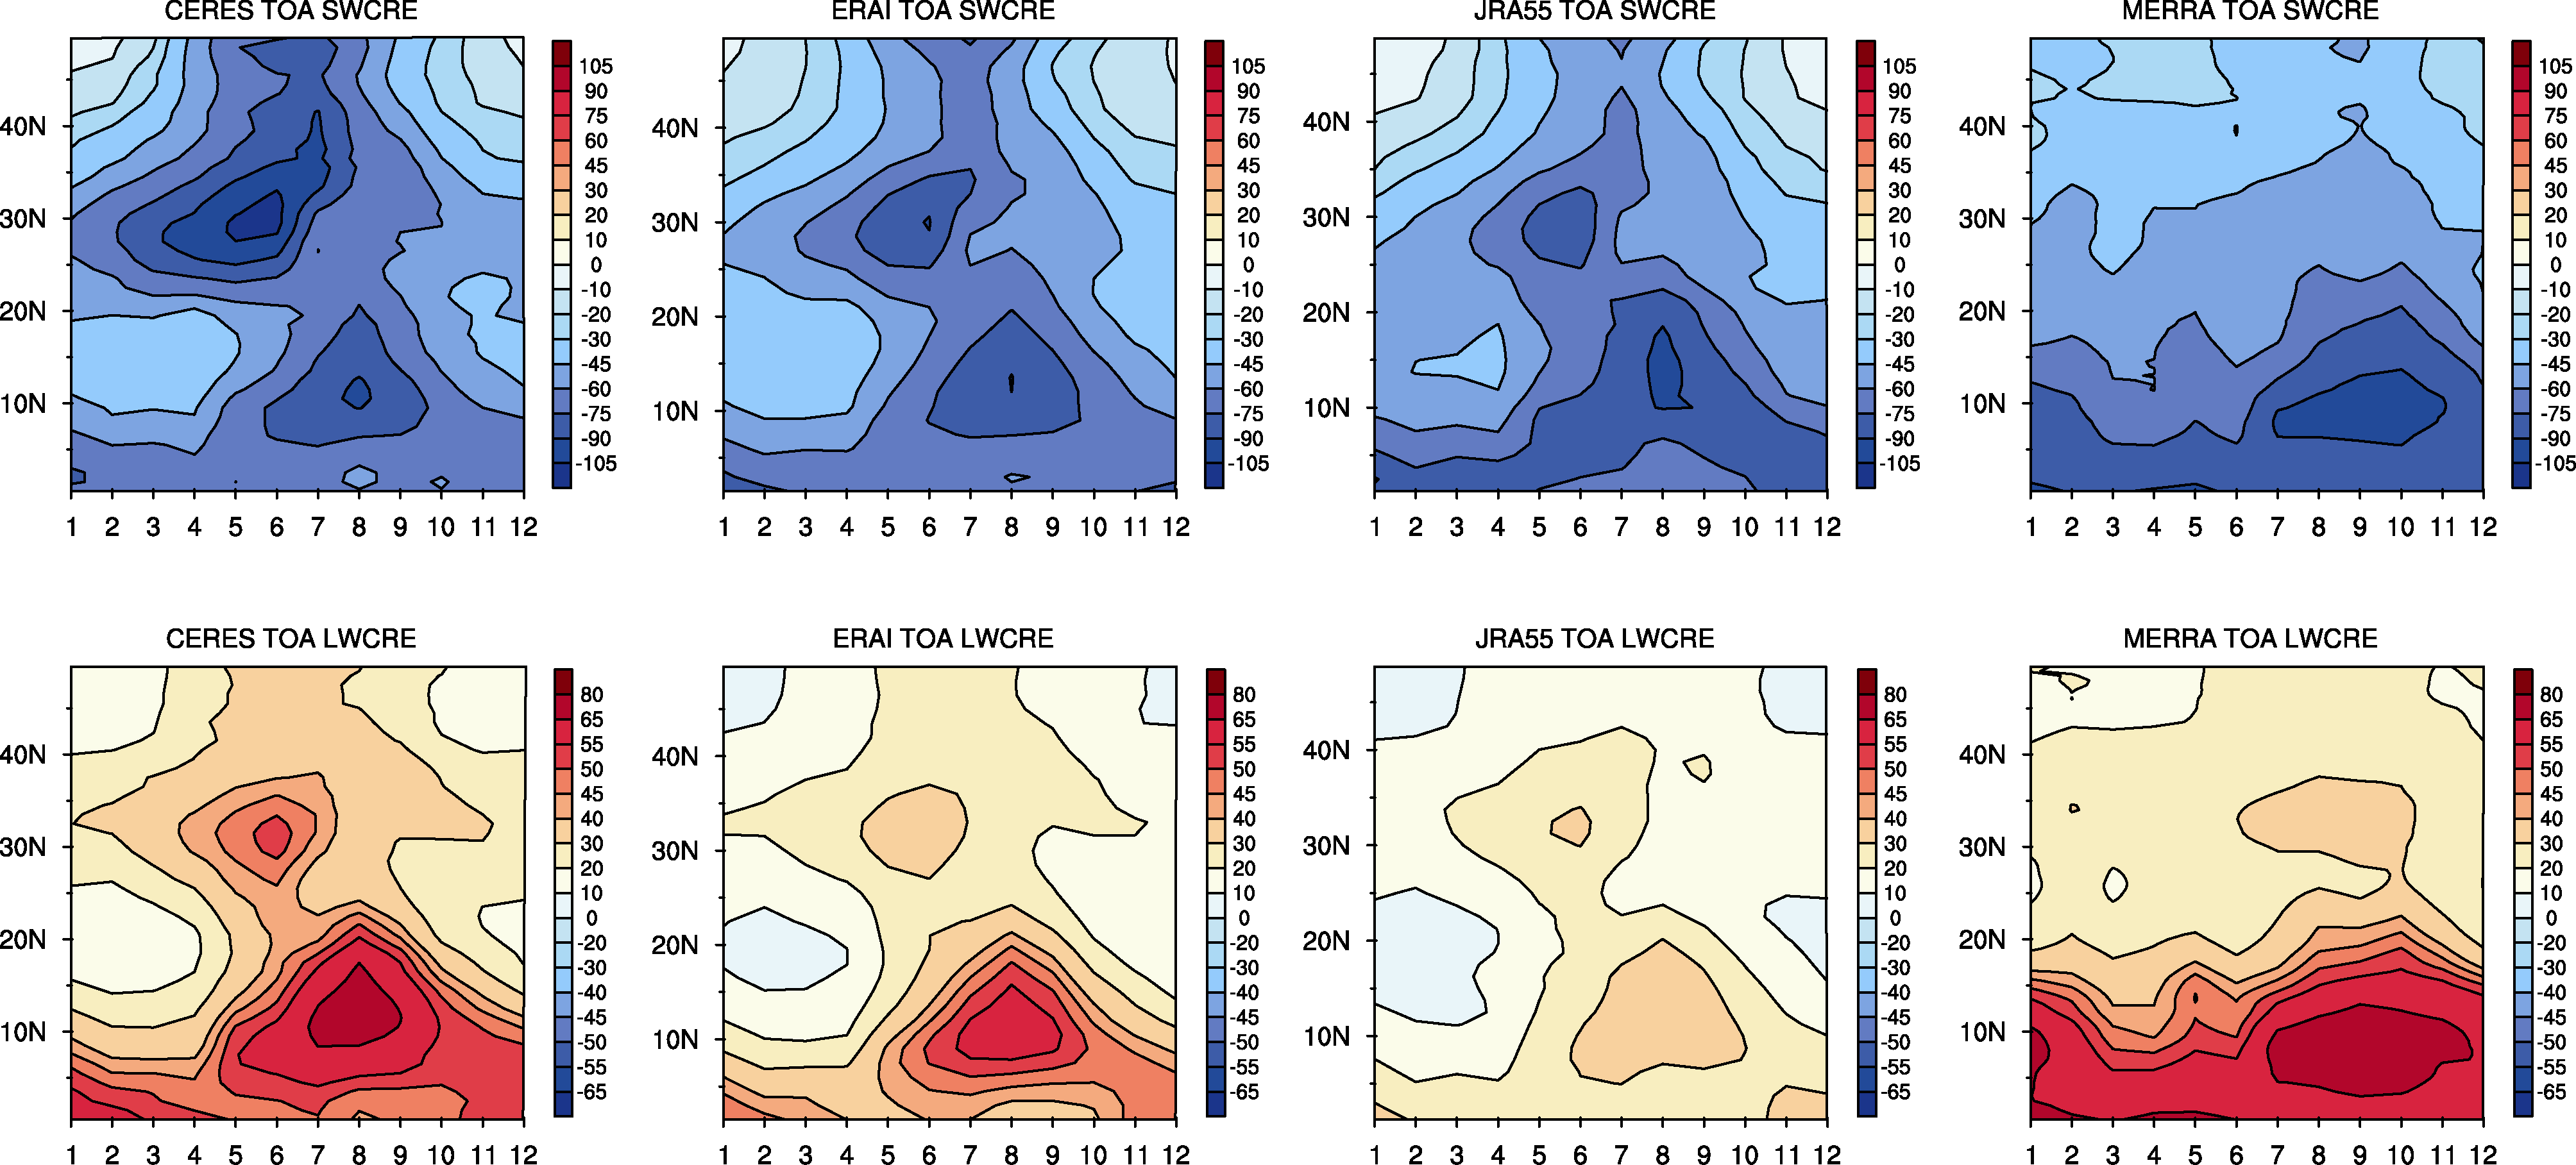 | Figure 4 Seasonal variations of observational and reanalysis CREs (color shading; units: W m-2) in East Asia and southern tropical regions (100-150° E). The upper panels refer to the SWCRE, while the lower panels refer to the LWCRE. The numbers marked on the x-axis denote months. |
In this study we conduct a preliminary evaluation of the CREs as represented in three reanalysis datasets through comparison with the latest satellite observations.
On the global scale, the reanalyses can basically capture the spatial pattern of CREs, and produce the magnitudes of the global annual mean SWCRE relatively well. The global mean LWCRE in ERA-Interim and JRA55 is weaker than observed, leading to overestimations of Net CRE in these two reanalyses. Meanwhile, obvious CRE biases occur in the ITCZ, coastal Pacific and Atlantic regions, and East Asia.
The quantitative evaluation performed in this study shows that the spatial correlation of CREs and TOA upward radiation fluxes in ERA-Interim is the best among the three reanalyses. Although MERRA has certain abilities in producing the magnitudes of CREs, its performance in terms of the spatial correlations in winter and summer are worse than in the other two reanalyses. JRA55’ s CRE abilities lie between those of the other two datasets. In East Asia, compared with the global mean results, the spatial correlations of SWCREs decrease and the biases of regional mean CREs and RSUT increase in the reanalyses. This shows that it remains a challenge for reanalysis datasets to successfully reproduce East Asian CREs. Relatively, ERA-Interim describes the seasonal variation of CREs in East Asia and its southern tropical regions well, although its CREs are weaker than observed. MERRA’ s performance in East Asia is considerably worse, especially in the warm season.
Our results suggest that continuously improving relevant cloud processes in reanalysis assimilation models is essential to obtain more reasonable CREs. Comprehensive in-situ and satellite-retrieved cloud properties datasets are also needed for reanalysis processes. These efforts should help to enhance the performance and applicability of reanalysis products in terms of cloud and radiative variables.
| 1 |
|
| 2 |
|
| 3 |
|
| 4 |
|
| 5 |
|
| 6 |
|
| 7 |
|
| 8 |
|
| 9 |
|
| 10 |
|
| 11 |
|
| 12 |
|
| 13 |
|
| 14 |
|
| 15 |
|
| 16 |
|
| 17 |
|
| 18 |
|
| 19 |
|
| 20 |
|
| 21 |
|
| 22 |
|
| 23 |
|