
Effects of Coordinate Rotation on Turbulent Flux Measurements during Wintertime Haze Pollution in Beijing, China
[GUO Xiao-Feng ]
]
]
|
|


Citation: Guo, X.-F., 2015: Effects of coordinate rotation on turbulent flux measurements during wintertime haze pollution in Beijing, China, Atmos. Oceanic. Sci. Lett., 8, 67-71.
doi:10.3878/AOSL20140079.
Received:27 September 2014; revised:17 November 2014; accepted:5 December 2014; published:16 March 2015
Eddy-covariance observations from the Beijing 325-m meteorological tower are used to evaluate the effects of coordinate rotation on the turbulent exchange of momentum and scalars during wintertime haze pollution (
Over recent years, Chinese cities have been afflicted with severe particulate air pollution, which frequently occurs in the form of consecutive episodes of haze within the urban boundary layer (UBL; Lin et al., 2013; Sun et al., 2013; Guo et al., 2014; Ji et al., 2014). To advance mechanistic understanding of persistent haze pollution in Beijing, a multitude of observational and modeling studies have been carried out to investigate various aspects of the UBL. For instance, poor dispersal capacity has been found to be characteristic of the UBL under stagnant meteorological conditions, particularly during prolonged occurrences of haze. Thermally stable stratification tends to prevail under hazy conditions, which not only suppresses the dispersion of air pollutants but also reduces turbulent exchange between the urban terrain and the atmosphere.
The eddy-covariance (EC) method has gained popularity in UBL studies, thanks to its capability in producing direct measurements of both turbulent fluxes and related parameters. Nonetheless, in practice, its deployment in an urban setting is complicated, owing to a number of physical complexities associated with urbanized surfaces, such as tall roughness elements, temporal unsteadiness of airflows, and the heterogeneous distribution of scalar sources/sinks. EC turbulence data thus necessitate a suite of theoretical and empirical corrections, without which calculated fluxes are insufficiently accurate for studies of urban air pollution. Existing techniques of flux correction have, in fact, been established with little regard for all the complexities of the city environment, and so their application to urban areas likely involves inevitable uncertainties (e.g., Feigenwinter et al., 2012). Given the critical importance of correcting turbulent flux measurements over undulating, heterogeneous terrain (e.g., Lee, 1998; Baldocchi et al., 2000), it is necessary to scrutinize the applicability of relevant techniques by using observational data from urban environments.
The topic of the present paper is the calculation of EC fluxes during wintertime haze pollution in Beijing; specifically, the period 6 January to 28 February 2013 (see, for example, Sun et al. (2014) for in-depth investigations). The work presented involves evaluating the effects of coordinate rotation on both the turbulent fluxes and transport efficiencies with regard to momentum, heat, water vapor, and CO2. The conclusions reached herein apply primarily to conditions of haze pollution; a separate investigation is needed to clarify to what extent they apply to clean-air conditions.
The present analysis relies on turbulence data from the Beijing 325-m meteorological tower, which is located in a compact building development (39° 58° N, 116° 22° E; 49 m above sea level). The buildings nearby vary considerably in height (mostly 20-50 m), forming a “ compact midrise” settlement. During 6 January to 28 February 2013, two identical EC systems were in operation at the heights of 140 and 280 m, composed of three-dimensional sonic anemometers (CSAT3) (Campbell Scientific Inc., Logan, Utah, USA) and LI-7500 open-path gas analyzers (Li-Cor Inc., Lincoln, Nebraska, USA). These instruments measured three components of turbulent wind velocity, virtual temperature, and water vapor and CO2 concentrations; all turbulence data were collected at 10 Hz. A total of 1253 hourly measurements were available simultaneously at the two heights, and a subset of 1096 half-hourly segments passed Foken and Wichura’ s (1996) stationarity test, which were involved in the subsequent evaluations.
The following variables serve the analyses of turbulent exchange and transport efficiency at each height (140 and 280 m):
In Eqs. (1)-(4), the friction velocity (
When applying the EC method, two techniques of coordinate rotation are adopted to evaluate their effects on turbulent fluxes and transport efficiencies, which are commonly known as the natural wind coordinate (NWC) and planar fit coordinate (PFC). Details of the algorithm can be found in, for example, McMillen (1988), Lee et al. (2004), and Wilczak et al. (2001). In brief, the NWC involves a two-angle (double) rotation, based on half-hourly mean velocity components measured in the sonic anemometer’ s instrument coordinate system; consequential averages of both the lateral and the vertical components are equal to zero (
where U, V, and W denote half-hourly mean velocity components measured in the instrument coordinate system, which are illustrated in Fig. 1 for each height (140 and 280 m); b0, 1, 2 are regression coefficients used to derive two rotation angles. The PFC has a working assumption that the mean velocity vectors, namely (
1) Overall regression is made by using all of the mean velocity vectors (Ui, Vj, Wk) available in the dataset, viz. without regard to wind direction.
2) Sector-wise regression is made separately for each of the four wind sectors in the U-V plane, as indicated in Fig. 1 by Roman numerals (I, II, III, and IV).
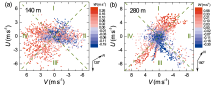
Figure 2 clarifies that, as referenced to the unrotated measurements, adopting the PFC produces a better correlation between the mean vertical velocity (
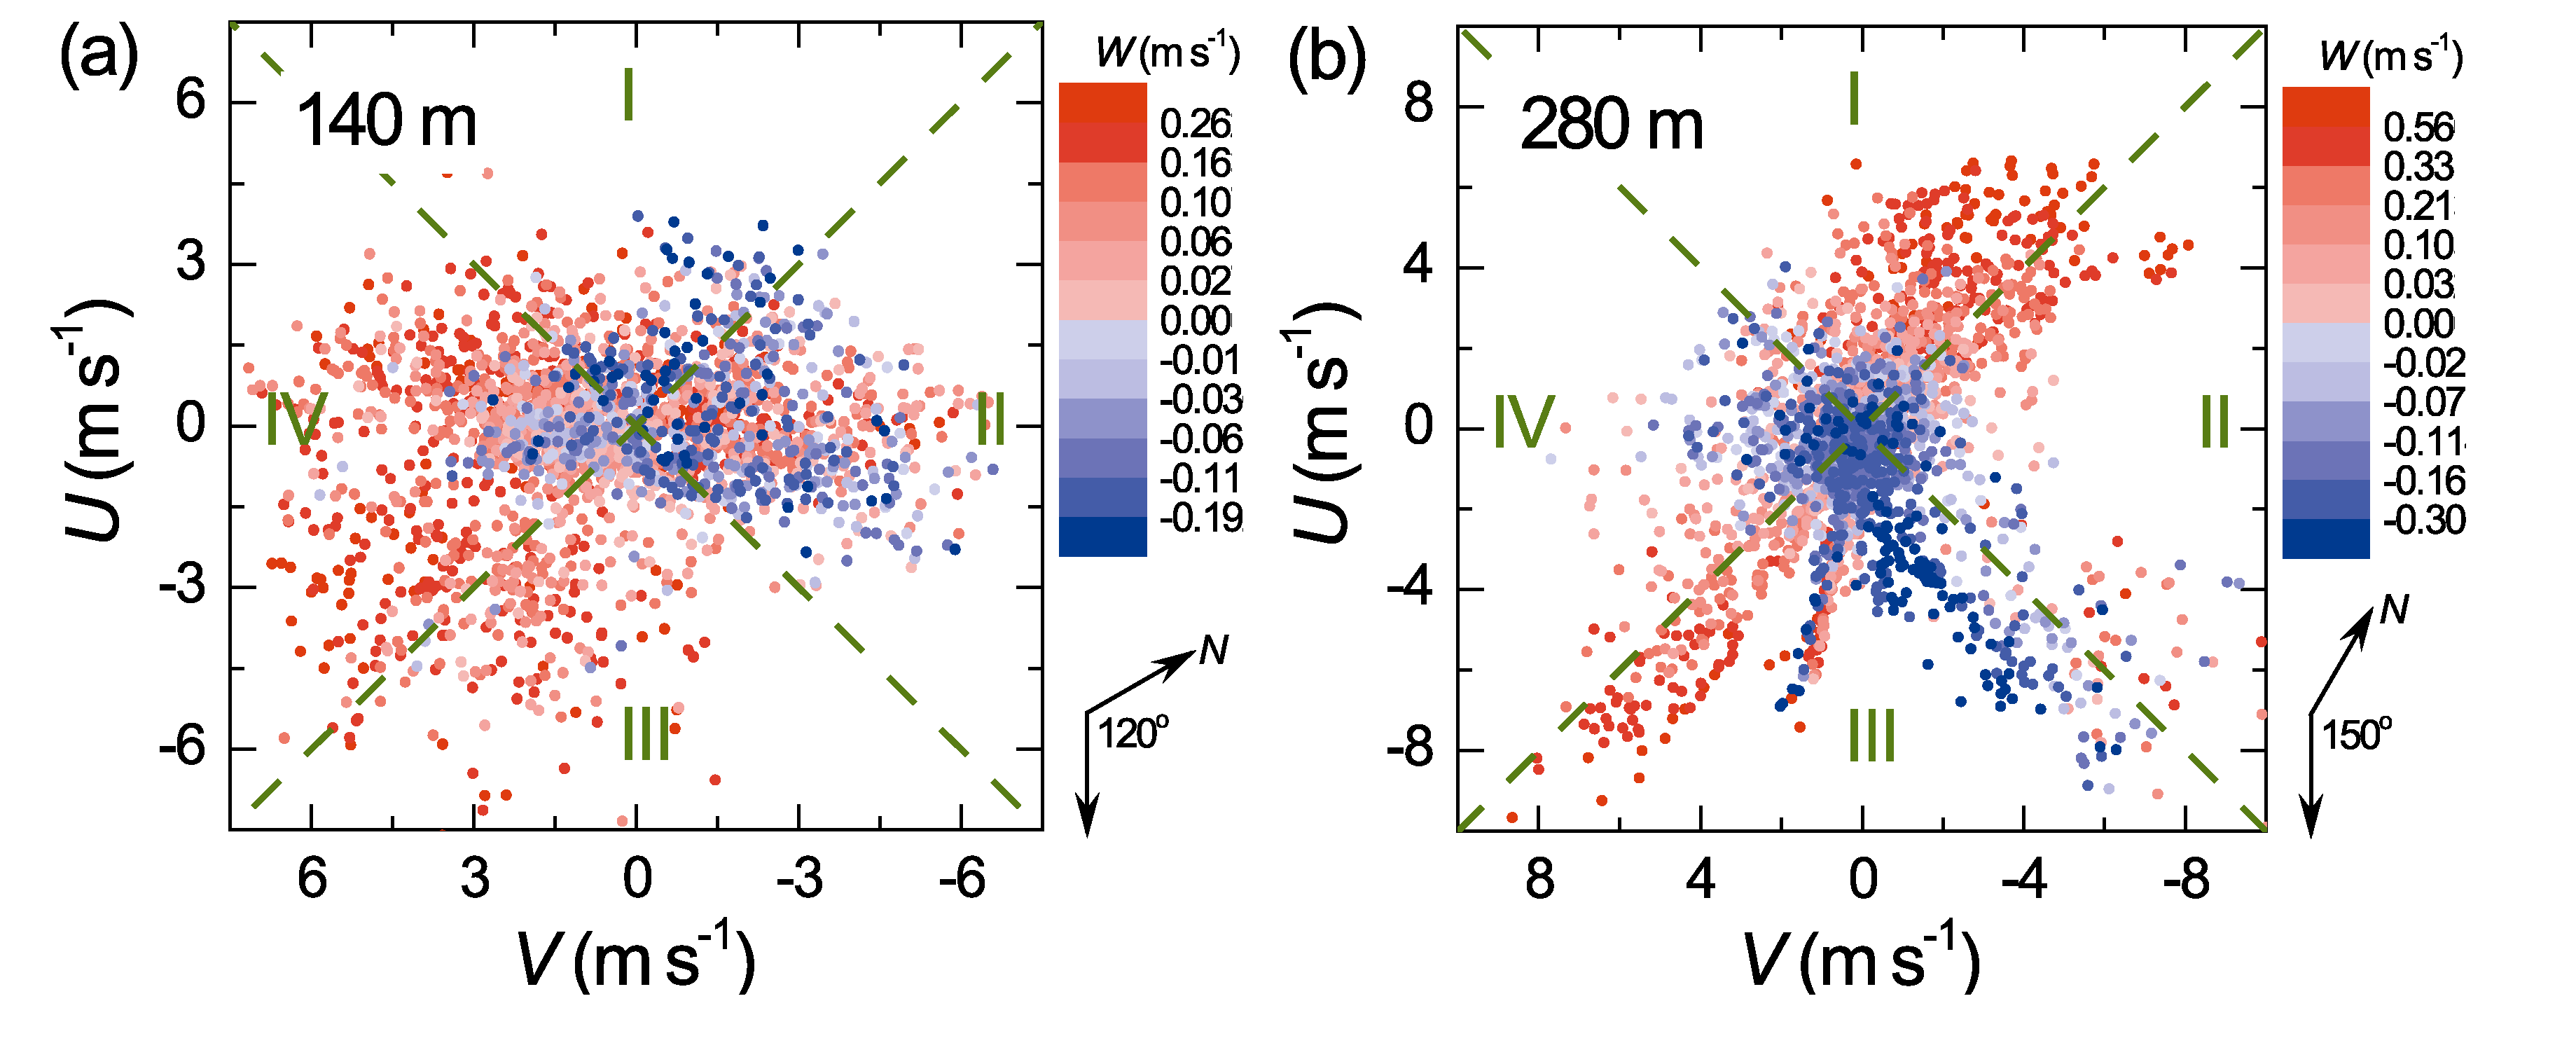 | Figure 1 Scatter plot of horizontal velocity components (U versus V) measured in the instrument coordinate system of sonic anemometers, color-mapped by the vertical component (W): (a) 140 m; (b) 280 m. Data points result from half-hourly mean values, which fall into four sectors in the U-V plane. Note that the sonic anemometers are oriented towards the minus U-axis, namely 120° and 150° clockwise from north at the 140- and 280-m heights, respectively. |
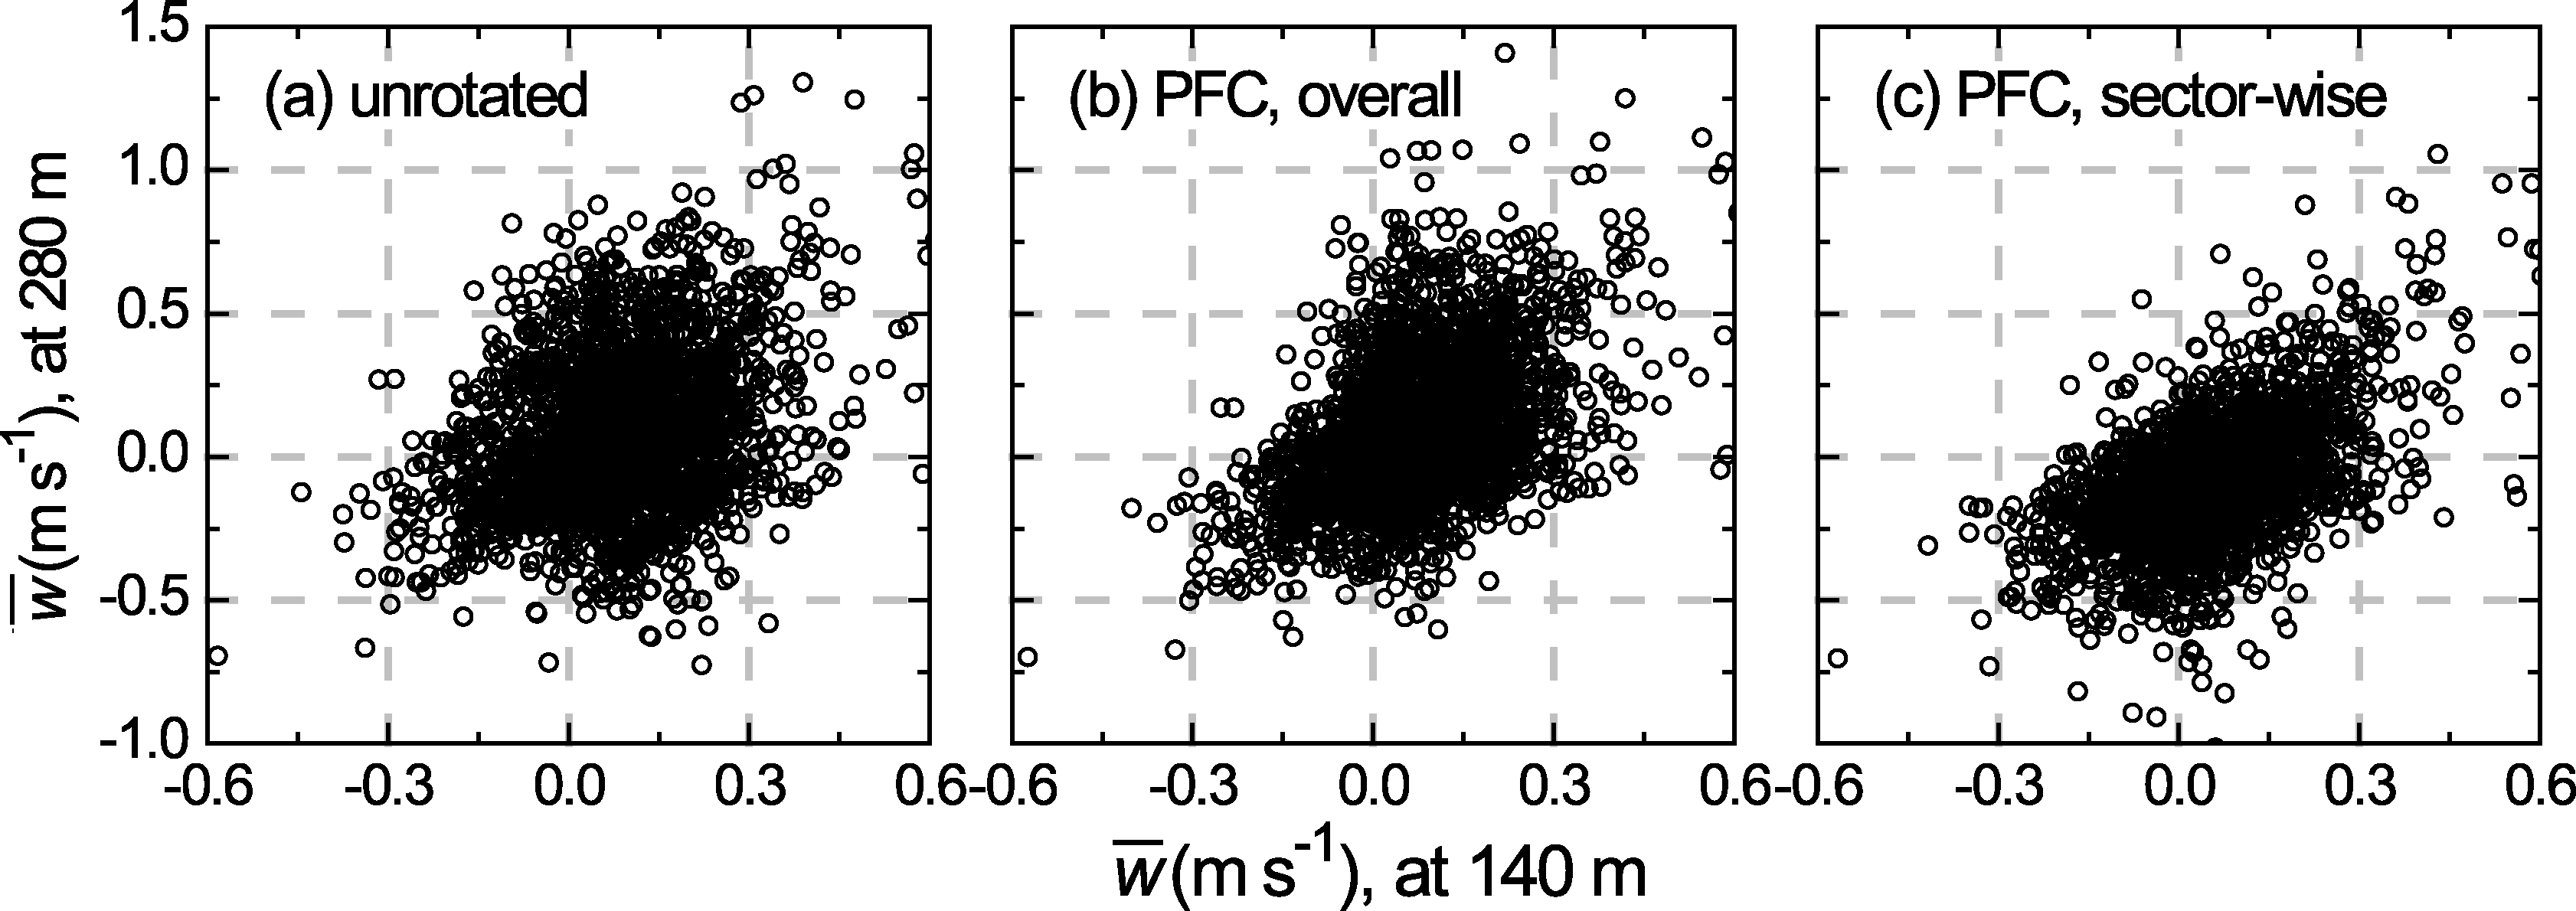 | Figure 2 Scatter plot of half-hourly mean vertical velocity ( |
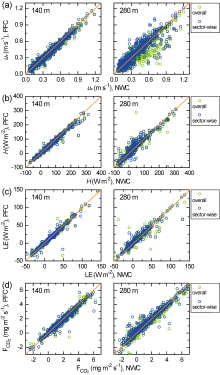
An appropriate technique of coordinate rotation ought not only to produce accurate fluxes but to give accurate estimates of transport efficiency. Figure 3 compares flux measurements (i.e.,
As Fig. 3 shows, there is an overall agreement in the turbulent fluxes (i.e.,
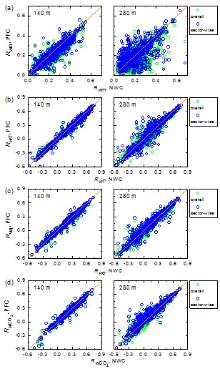
Figure 4 shows that vertical transport efficiencies of both momentum (i.e., Rwm) and scalars (i.e., RwT, Rwq, andRwCO2) are in good agreement between different techniques of coordinate rotation. At both the 140- and 280-m heights, results derived from the PFC lead, overall, to a negligible bias relative to those derived from the NWC (viz. the MBE values in Table 1 are almost zero, for instance). Associated values of MAPD, moreover, suggest that the selection of a technique for coordinate rotation (NWC or PFC) is less of a concern for calculating transport efficiencies at a lower level in a haze-polluted UBL (i.e., 140 m herein); nonetheless, their average effects approach or even exceed 20% at a higher level (i.e., 280 m herein). There are two potential explanations: (1) compared to 140 m, flux ‘ source areas’ for 280 m have a larger spatial extent and probably a more heterogeneous distribution of the source/sink, rendering turbulence parameters more sensitive to the orientation of a coordinate system; and (2) turbulence measurements are demanding with respect to instrument set-up, whereas the observation data at 280 m might be more significantly influenced by mechanical shaking of this tall tower.
 | Figure 3 Effects of coordinate rotation on flux measurements: (a) u* ; (b) H; (c) LE; and (d) FCO2. Separately for each height (140 or 280 m), results derived from the PFC are compared against those derived from the NWC. |
| Table 1 Height-specific comparative statistics for flux measurements (u* , H, LE, and FCO2) and transport efficiencies (Rwm, RwT, Rwq, andRwCO2) between the PFC and the NWC. MAD, MBE, and RMSE have the units of m s-1 for u* , W m-2 for H and LE, and mg m-2 s-1 for FCO2; all are non-dimensional for Rwm, RwT, Rwq, andRwCO2. |
Using UBL turbulence data of the Beijing 325-m meteorological tower, this paper provides a brief evaluation of the coordinate rotation effects on turbulent momentum and scalar exchange during haze pollution in the boreal winter of 2013. Candidate techniques include the NWC and PFC, with the latter being applied by means of two regression methods (i.e., overall and sector-wise). A general agreement is found between the different techniques, with regard to both turbulent fluxes and transport efficiencies; in particular, at a lower level above the ground (i.e., 140 m, as compared with 280 m). Such agreement appears interesting for an extremely complex urban environment. Regarding applications of the PFC, sector-wise regression of Eq. (7) is recommended so as to improve the correlation between the mean vertical velocity (
 | Figure 4 Effects of coordinate rotation on turbulent transport efficiencies: (a) Rwm; (b) RwT; (c) Rwq; and (d) RwCO2. |
| 1 |
|
| 2 |
|
| 3 |
|
| 4 |
|
| 5 |
|
| 6 |
|
| 7 |
|
| 8 |
|
| 9 |
|
| 10 |
|
| 11 |
|
| 12 |
|
| 13 |
|
| 14 |
|
| 15 |
|
| 16 |
|
| 17 |
|