

Relationship between the Periodic Fluctuations of Pressure and Precipitation during a Rainstorm
[WU Li-Ji1 , WEN Zhi-Ping2, *  , HE Hai-Yan
2 ]
, HE Hai-Yan|
|


Citation: Wu, L.-J., Z.-P. Wen, and H.-Y. He, 2015: Relationship between the periodic fluctuations of pressure and precipitation during a rainstorm, Atmos. Oceanic Sci. Lett., 8, 78-81.
doi:10.3878/AOSL20140082.
Received:2 November 2014; revised:25 December 2014; accepted:27 January 2015; published:16 March 2015
The relationship between periodic fluctuations of pressure and precipitation was investigated using the continuous wavelet transform and wavelet coherence transform methods for a rainstorm case that occurred during 19-25 June 2005 in Guangdong Province, China. The results show that a period of 2-4 h existed in both pressure and precipitation fluctuations. Furthermore, this high frequency pressure fluctuation was closely related to the fluctuation of precipitation with a similar period, and the fluctuation of pressure was about two hours ahead of the precipitation fluctuation variation. Since the high frequency pressure fluctuation implies the existence of gravity wave activity, the results suggest that gravity wave activities with a 2-4 h period in the atmosphere exerted an important influence on precipitation during this rainstorm.
Previous studies have revealed the existence of gravity waves that have significant effects on mesoscale weather features such as convective storms and heavy rainfall (e.g., Curry and Murty, 1974; Li, 1978; Chao, 1980; Ding and Wang, 1994; Lac et al., 2002). Uccellini’ s (1975) research showed that gravity waves existing in severe thunderstorms. Observed gravity waves are capable of lifting air parcels to their level of free convection and thus initiating and modulating thunderstorm activities.
In the past several decades, progress has been made in understanding the characteristics of gravity waves, with most studies having been carried out based on surface pressure perturbations, usually detected by station pressure recorders. It has been found that gravity waves can cause extraordinary pressure jumps and thunderstorm initiation. Until now, gravity waves with various wave lengths and periods have been detected, including an ~20 min period with horizontal wavelength of ~30 km (Bachandran, 1980), 2.5-4 h period with amplitudes of a few milibars and horizontal wavelengths of 400-500 km (Uccellini, 1975), and gravity wave periods of 6-15 h with longer wavelengths (Eom, 1975; Miller and Sanders, 1980). Other studies have also found different kinds of periods with respect to gravity waves (Koch, 1979; Stobie et al., 1983; Fritts and Luo, 1992).
Mesoscale gravity waves have been studied not only through weather data collected from observational networks, but also through numerical simulation. For example, Kaplan et al. (1997), as part of the Cooperative Convective Precipitation Experiment, simulated a gravity wave event that occurred during 11-12 July 1981. Additional simulation research has subsequently been carried out to reveal the activities of mesoscale gravity waves (Zhang and Koch, 2000; Wu and Zhang, 2004; Kuester et al., 2008; Stechmann and Majda, 2009; Peng and Zou, 2010). However, because of the current lack of understanding regarding the general characteristics of mososcale gravity waves, especially the periodic connection between the activity of gravity waves and the variability of precipitation still being unclear, poor precipitation forecasts continue to be commonplace in model simulations when related with gravity waves.
Therefore, to contribute to a better understanding of gravity waves and their effect on heavy rainfall, the periodic relationship between gravity waves and heavy rainfall is investigated in this paper by studying a rainstorm that occurred in Guangdong Province, China.
The data used were collected from Chinese meteorological stations when the heavy rainfall event in Guangdong Province occurred (18-25 June 2005). Accumulated precipitation reached 1300 mm at Longmen Station. Since the instruments at Longmen Station were damaged during the heavy rainfall process, hourly pressure and rainfall data at the nearby station of Heyuan were used in the present study. Accumulated precipitation during 18-25 June reached 722 mm at Heyuan Station.
The continuous wavelet transform (CWT) of time series is its convolution with the local basis function. The CWT of time series d with respect to wavelet Ψ is defined as
where t is time and Ψ s is the wavelet at scale s. The wavelet power is defined as
where the asterisk denotes complex conjugation. The cross- wavelet power is defined as
To measure how coherent the covariance of the two series is in time-frequency space, we further define the coherence as
where S is a smoothing operator, n is the length of data,
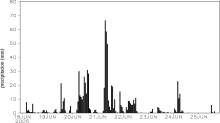
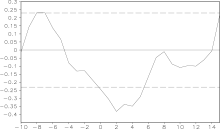
Figure 1 shows the hourly precipitation during 18-25 June 2005 at Heyuan Station. Daily rainfall reaches 100-200 mm during 20-22 June, with maximal hourly rainfall of around 70 mm occurring during 0700-0900 UTC 21 June. The corresponding pressure variation (trend of pressure removed with a least-squares fit) is shown in Fig. 2, indicating a continual decline during the severest rainy period. The distribution of lead and lag correlation coefficients between rainfall and pressure at Heyuan Station during 20-22 June are shown in Fig. 3. Negative correlation exists between pressure and rainfall when pressure leads precipitation. The maximum negative correlation coefficient occurs when rainfall variation lags pressure variation by two hours (exceeding the 99.9% confidence level).
To depict the periodic signals of pressure and rainfall fluctuations, wavelet transform was applied to analyze the periods of the two time series during 19-22 June 2005. Figure 4a presents the different periods of rainfall fluctuation, which include a 20 h period from 20 to 22 June, a 4-12 h period around 21 June, and a less than 4 h period on 19, 20, and 21 June, separately. In the case of pressure CWT analysis, the prominent peak of pressure fluctuation is 12 h, which runs through the whole process (Fig. 4b). Another peak of pressure fluctuation is around 2-4 h (during 20-21 June), but this fluctuation does not reach the 95% confidence level. According to the research of Figure 4 The continuous wavelet power spectra of (a) rainfall and (b) pressure from 0000 UTC 19 to 2400 UTC 22 June 2005 at Heyuan Station. Thick black contours designate the 95% confidence level against red noise. Thin black contours show the edge effects.
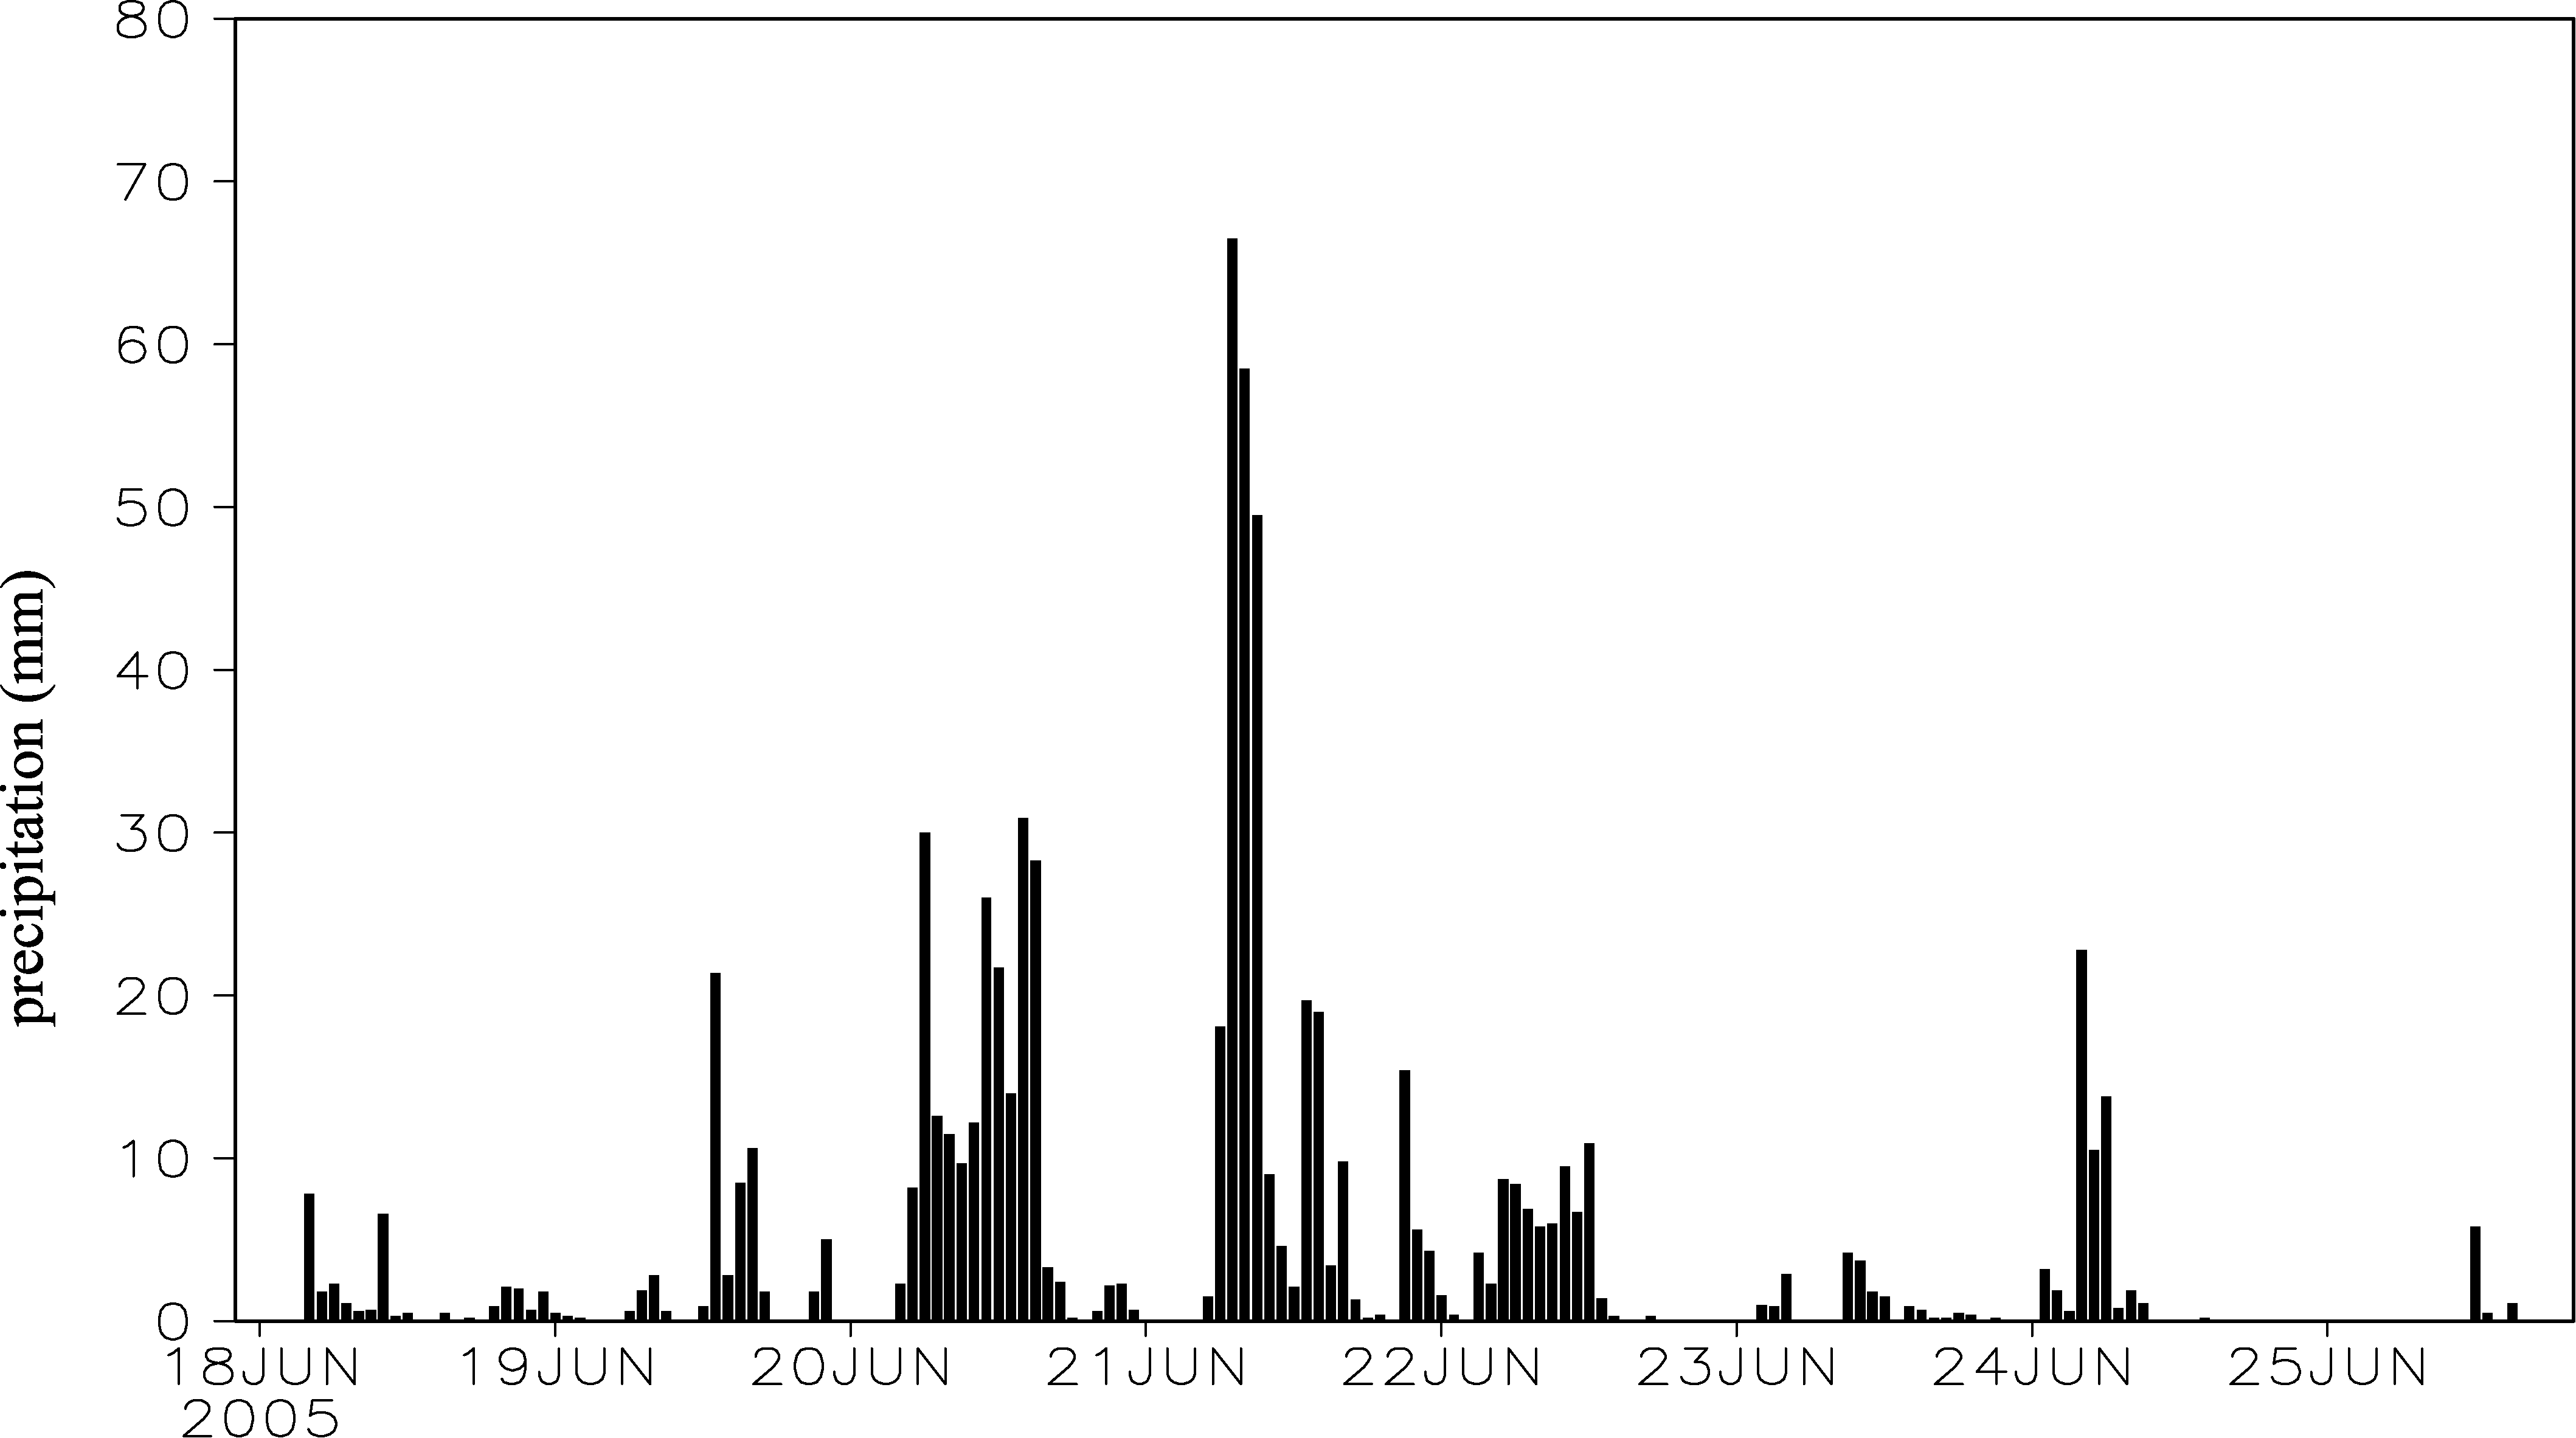 | Figure 1 Precipitation from 2200 UTC 17 to 2000 UTC 25 June 2005 at Heyuan Station (units: mm). |
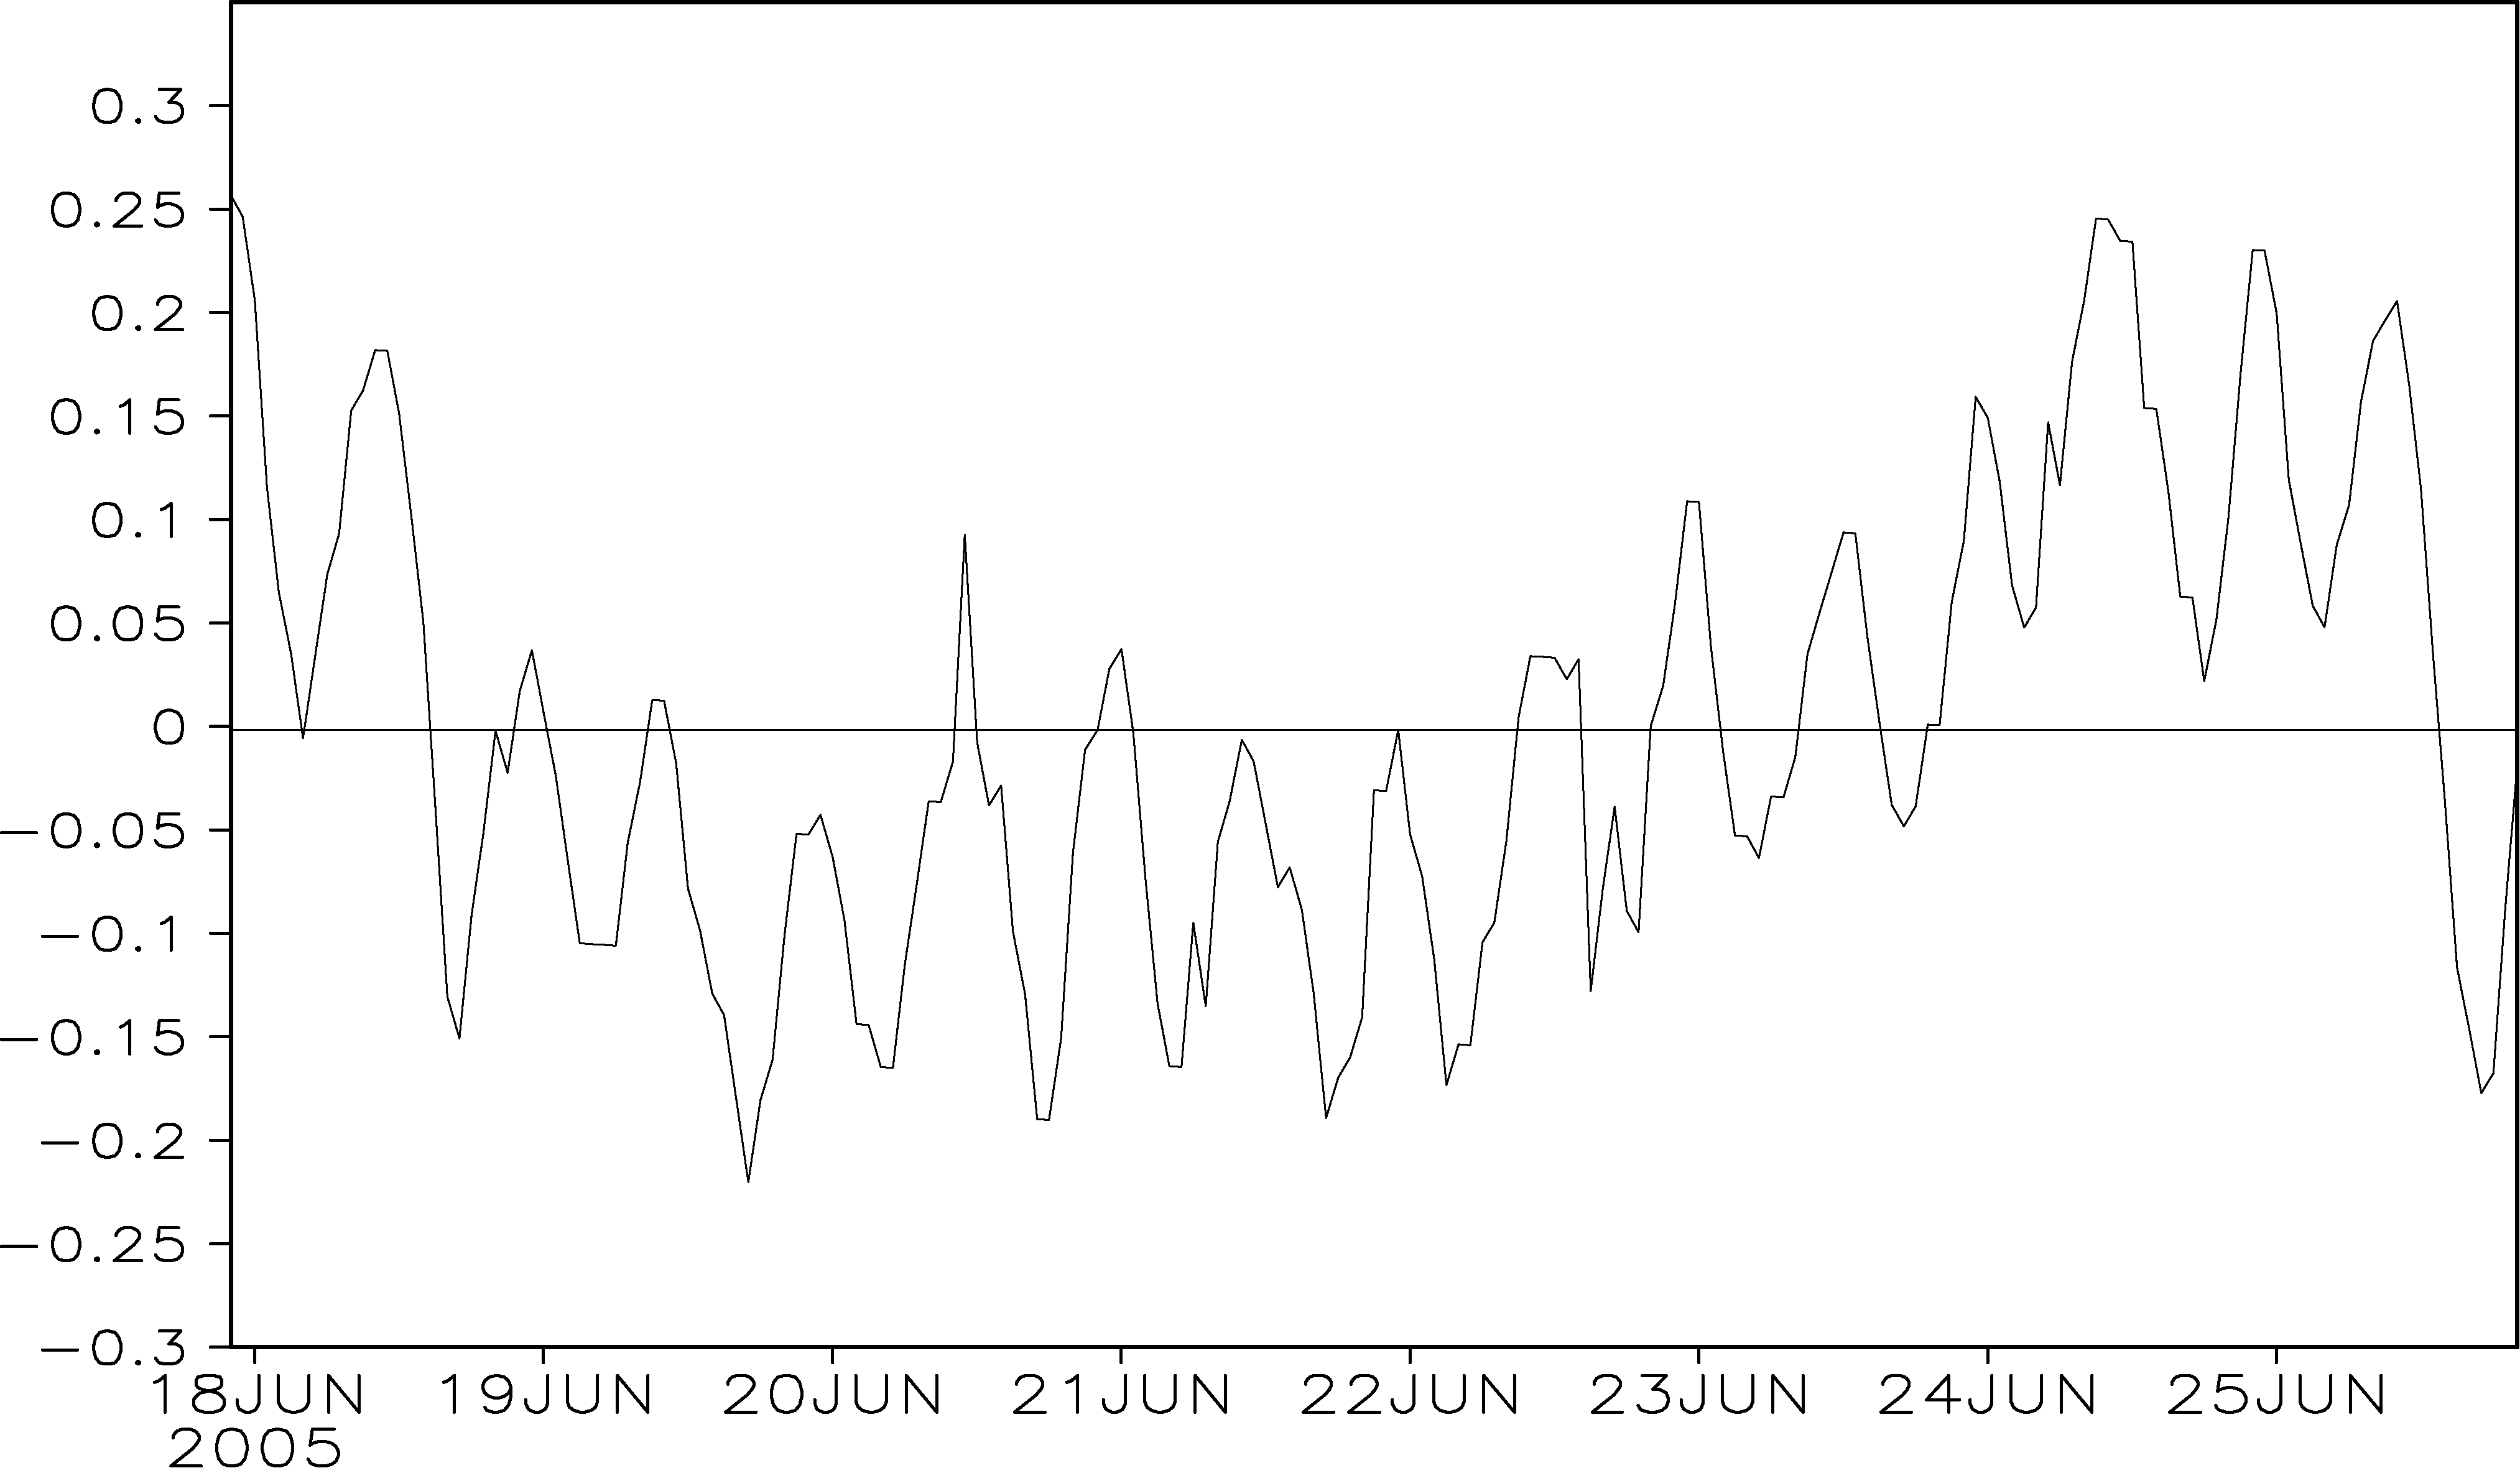 | Figure 2 Hourly pressure variation from 2200 UTC 17 to 2000 UTC 25 June 2005 at Heyuan Station (trend of pressure is removed with a least-squares fit). |
 | Figure 3 Correlation between rain and pressure at Heyuan Station (0000 UTC 20 to 2300 UTC 22 June 2005). The positive (negative) abscissa means pressure leading (lagging) rainfall. Dashed lines denote the 95% confidence level. |
 | Figure 4 The continuous wavelet power spectra of (a) rainfall and (b) pressure from 0000 UTC 19 to 2400 UTC 22 June 2005 at Heyuan Station. Thick black contours designate the 95% confidence level against red noise. Thin black contours show the edge effects. |
Uccellini (1975), gravity waves in the atmosphere have a period of 2-4 h, which can be described by the fluctuation of pressure. And according to our CWT analysis, pressure shows a fluctuation period of 2-4 h, suggesting the activity of gravity waves during this rainstorm, but the power of the pressure period below 4 h cannot reach the 95% confidence level. Therefore, it is hard to tell whether the pressure fluctuation period below 4 h is related to that of rainfall or is merely a coincidence. The wavelet coherence (WTC) transform helps in this regard.
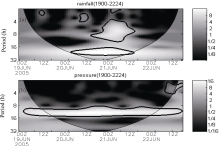
Wavelet coherence transform can be used to reveal how coherent two time series are in time-frequency space. Figure 5 presents the rainfall during 20-22 June 2005 at Heyuan Station and the wavelet coherence between the rainfall and pressure time series. The WTC transform indicates that in the time-frequency plot only the 2-4 h band around 21 June reaches the 95% confidence level, and the phase angles between rainfall and pressure are out of phase (Fig. 5b). This result suggests that the high frequency pressure fluctuation (with period below 4 h) is closely related to rainfall fluctuation, though the power of the period below 4 h in the pressure fluctuation analysis of CWT is not significant. In addition, every rainfall peak at Heyuan Station (Fig. 5a) occurs with a high correlation coefficient between the pressure and rainfall. On 21 June in particular, the high correlation coefficient occurs slightly ahead of the rainfall increasing. Since the fluctuation of pressure can be regarded as the gravity wave activity, this result implies that the gravity wave activity exerted a significant impact on the heavy rainfall during this rainstorm.
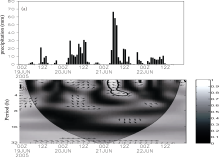
To better understand the relationship between the high frequency fluctuations of pressure and rainfall, harmonic filtering was used to study the pressure fluctuations with a period below 4 h. Figure 6 indicates that there are four active times for the pressure fluctuations with period below 4 h during the rainfall process. Each active period corresponds to an increase in precipitation, particularly on 21 June. Furthermore, the phase of the pressure wave seems to be ahead of that of precipitation. This harmonic filtering result further confirms the WTC analysis.
 | Figure 5 (a) Rainfall from 0000 UTC 20 to 2400 UTC 22 June 2005 at Heyuan Station and (b) wavelet coherence between the rainfall and pressure time series. Thick black contours designate the 95% confidence level against red noise. Thin black contours shows the edge effects. The relative phase relationship is shown as arrows, with in-phase pointing right and out-of-phase pointing left. |
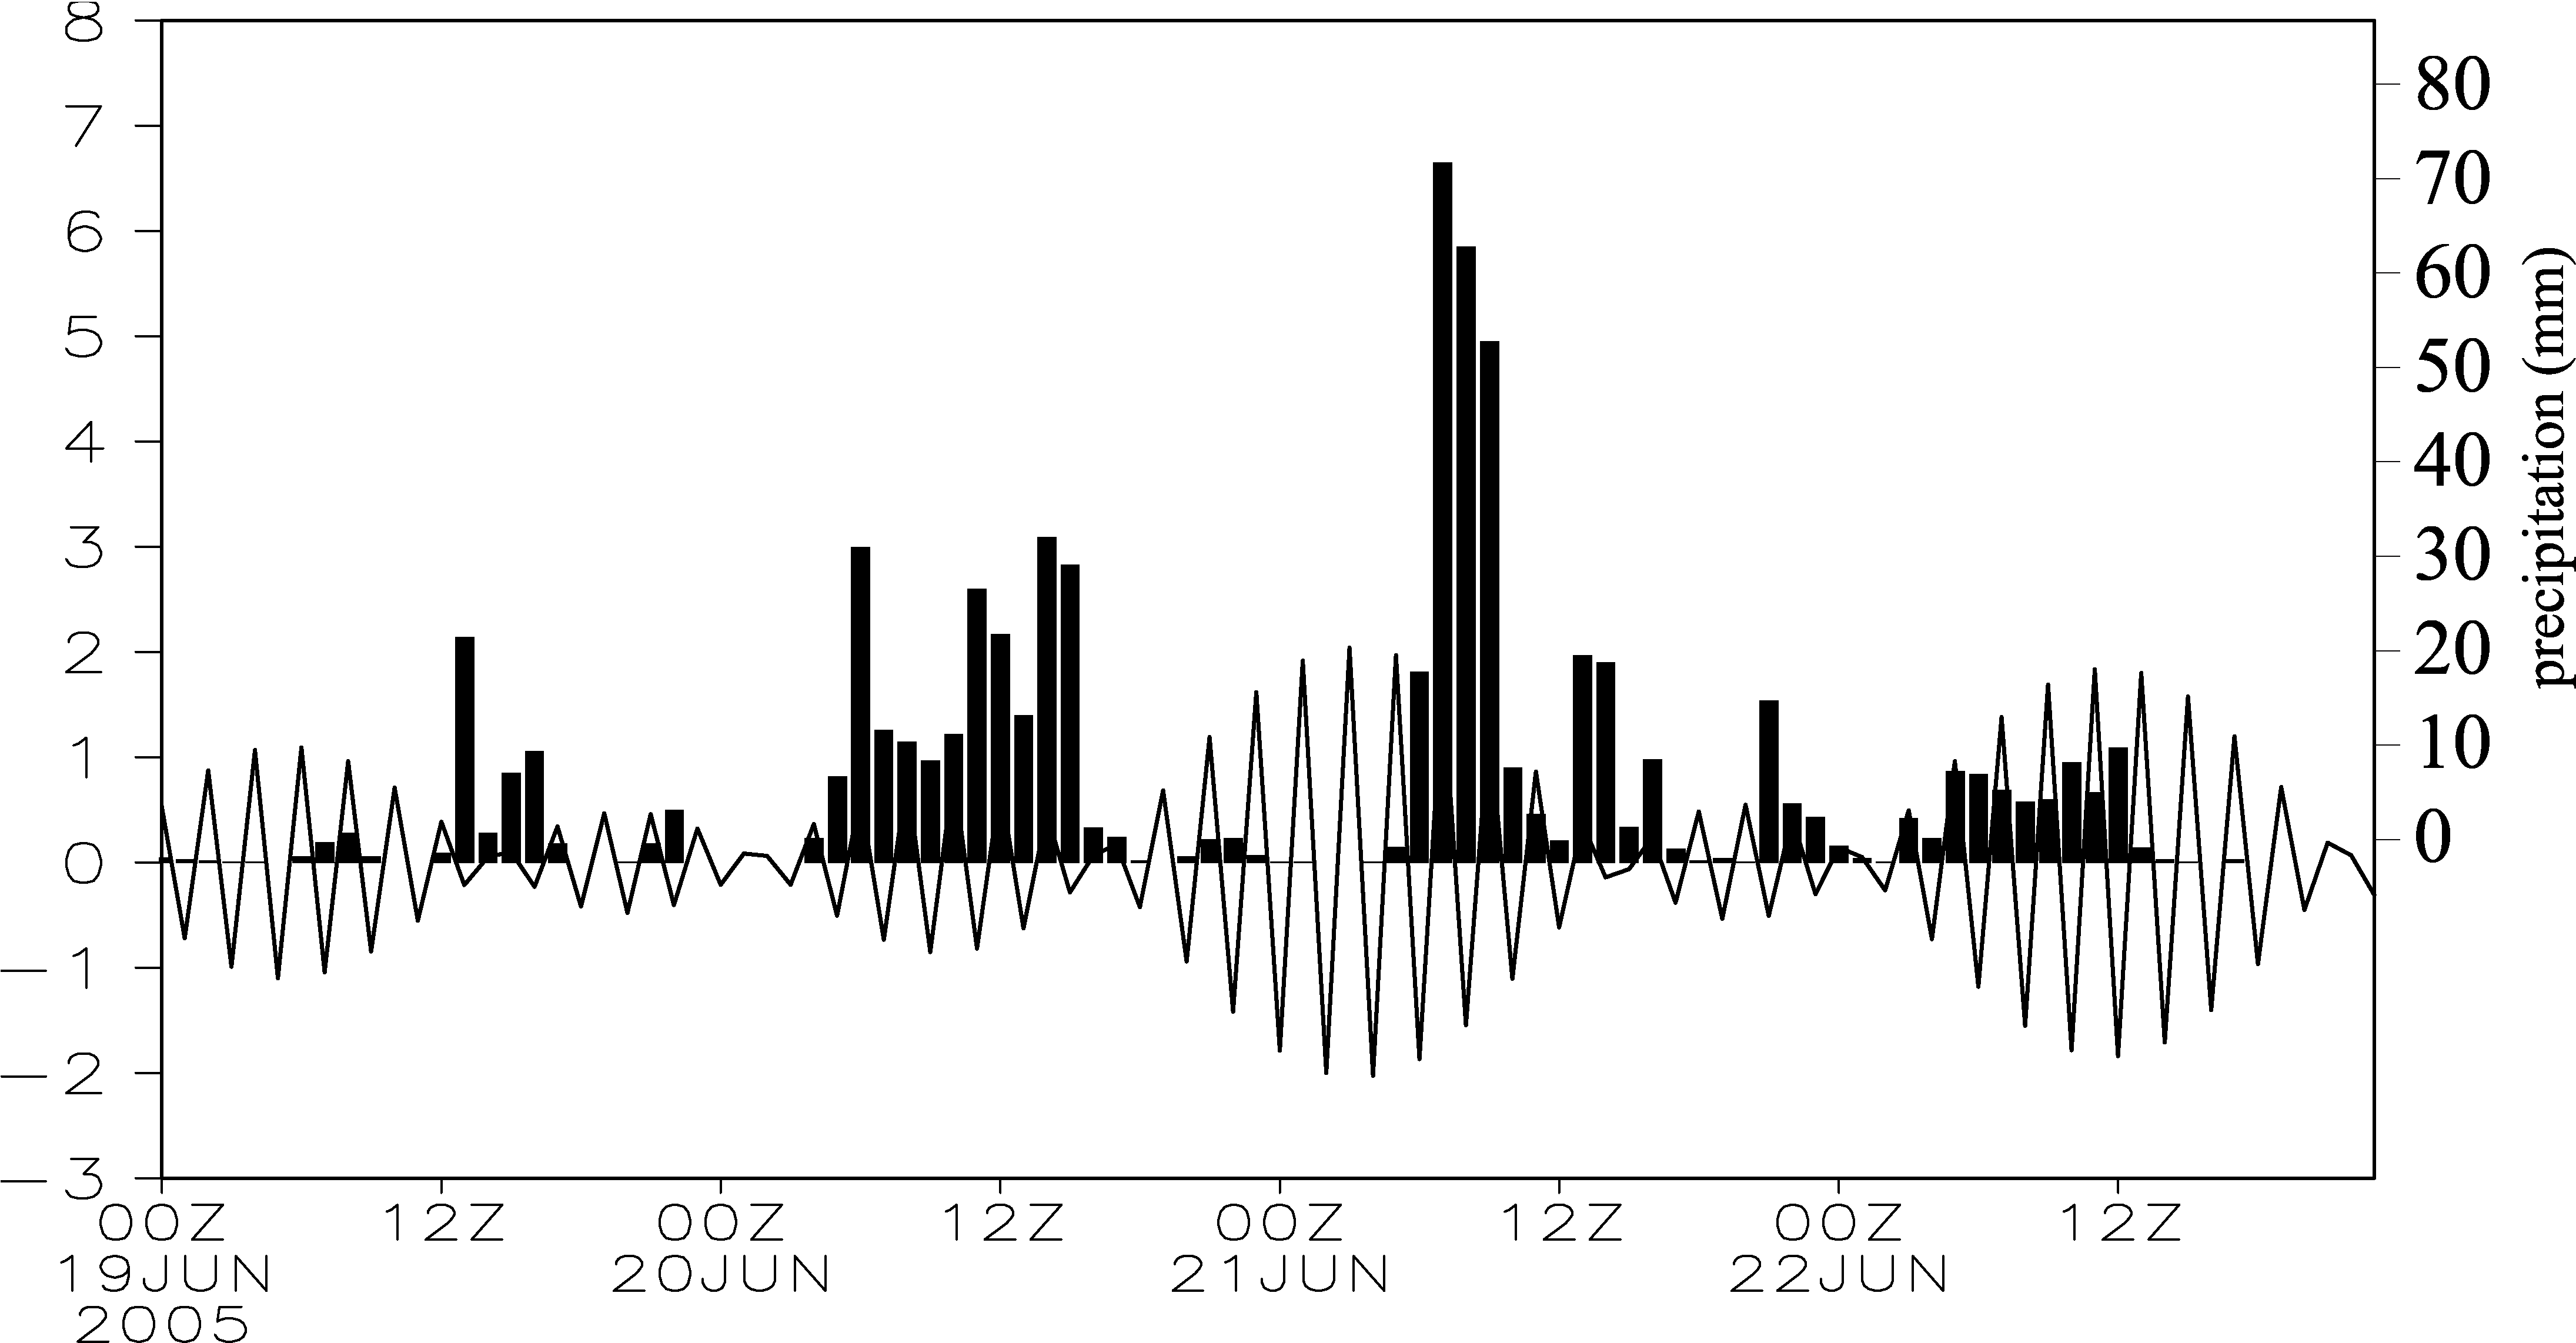 | Figure 6 Harmonic analysis of pressure fluctuation below 4 h at Heyuan Station. The histogram is rainfall (right y-axis) from 0000 UTC 19 to 2400 UTC 22 June 2005. The thick line is the pressure fluctuation (left y-axis) below 4 h at Heyuan Station. |
This study used the continuous wavelet transform and wavelet coherence transform methods to investigate the relationship between periodic fluctuations of pressure and precipitation during 19-25 June 2005 at Heyuan Station, Guangdong Province, China. The results show that there was a fluctuation of pressure with a 2-4 h period, reflecting the activities of gravity waves. This high frequency pressure fluctuation was closely related to the fluctuation of precipitation. Furthermore, the WTC and harmonic filtering analyses both showed a periodic fluctuation of pressure (2-4 h) that was slightly ahead of the phase of precipitation fluctuation, especially during the heaviest precipitation on 21 June 2005. The results suggest that the activities of gravity waves with a 2-4 h period in the atmosphere exerted a significant impact on the rainfall of this rainstorm and thus played a pivotal role.
| 1 |
|
| 2 |
|
| 3 |
|
| 4 |
|
| 5 |
|
| 6 |
|
| 7 |
|
| 8 |
|
| 9 |
|
| 10 |
|
| 11 |
|
| 12 |
|
| 13 |
|
| 14 |
|
| 15 |
|
| 16 |
|
| 17 |
|
| 18 |
|
| 19 |
|
| 20 |
|