Improving Simulation of the Terrestrial Carbon Cycle of China in Version 4.5 of the Community Land Model Using a Revised Vcmax Scheme
[WANG Yuan-Yuan1, 2 , XIE Zheng-Hui1, *  , JIA Bing-Hao
1 , YU Yan3 ]
, JIA Bing-Hao|
|


Citation: Wang, Y.-Y., Z.-H. Xie, B.-H. Jia, et al., 2015: Improving simulation of the terrestrial carbon cycle of China in version 4.5 of the Community Land Model using a revised Vcmax scheme, Atmos. Oceanic Sci. Lett., 8, 88-94.
doi:10.3878/AOSL20140090.
Received:8 December 2014; revised:16 February 2015; accepted:16 February 2015; published:16 March 2015
The maximum rate of carboxylation ( Vcmax) is a key photosynthetic parameter for gross primary production (GPP) estimation in terrestrial biosphere models. A set of observation-based Vcmax values, which take the nitrogen limitation on photosynthetic rates into consideration, are used in version 4.5 of the Community Land Model (CLM4.5). However, CLM4.5 with carbon-nitrogen (CN) biogeochemistry (CLM4.5-CN) still uses an independent decay coefficient for nitrogen after the photosynthesis calculation. This means that the nitrogen limitation on the carbon cycle is accounted for twice when CN biogeochemistry is active. Therefore, to avoid this double nitrogen down-regulation in CLM4.5-CN, the original Vcmax scheme is revised with a new one that only accounts for the transition between Vcmax and its potential value (without nitrogen limitation). Compared to flux tower- based observations, the new Vcmax scheme reduces the root-mean-square error (RMSE) in GPP for mainland China by 13.7 g C m-2 yr-1, with a larger decrease over humid areas (39.2 g C m-2 yr-1). Moreover, net primary production and leaf area index are also improved, with reductions in RMSE by 0.8% and 11.5%, respectively.
The terrestrial carbon cycle is an important aspect of global change, and modeling it has been an effective tool in understanding its processes. Gross primary production (GPP) is a key component of the terrestrial carbon balance, which needs to be simulated as accurately as possible to ensure the most reliable values of the latter’ s simulated fluxes and biomass, such as net primary production (NPP) and leaf area index (LAI) (Schaefer et al., 2012). Most terrestrial biosphere models commonly use a variant of the Farquhar et al. (1980) photosynthesis model coupled to the Ball-Berry stomatal conductance model (Collatz et al., 1991). A key term in the equations for the calculation of GPP is the photosynthetic parameter Vcmax, which describes the maximum rate of carboxylation by the photosynthetic enzyme Rubisco at leaf-level (Bonan et al., 2012). Some studies suggest that model structural errors could be compensated by parameter adjustment, and this may explain the lack of consensus in values of Vcmax used in different photosynthesis models (Bonan et al., 2011, 2012; Chen et al., 2011).
The photosynthetic parameter values of Vcmaxused in version 4.5 of the Community Land Model (CLM4.5) were obtained from the results of Kattge et al. (2009), which were based on a meta-analysis of photosynthetic measurements extrapolated to field vegetation, using observed foliage content, and those values are included in the TRY global database of plant traits (Kattge et al., 2011; see http://www.try-db.org). The parameters already reflect nitrogen limitation on photosynthetic rates. However, for CLM4.5 with carbon-nitrogen (CN) biogeochemistry (denoted as CLM4.5-CN), the nitrogen-induced reduction of GPP is applied after the photosynthesis calculation and is independent of Vcmax, which means that the potential
CLM4.5 is the latest version of the CLM model family and is the land component of version 1.2 of the Community Earth System Model (Oleson et al., 2013). It succeeds CLM4 with updates to photosynthesis, soil biogeochemistry, fire dynamics, cold region hydrology, the lake model, and the biogenic volatile organic compounds model (Li et al., 2014). The resulting model is fully prognostic with respect to all water, energy, carbon, and nitrogen variables in the terrestrial ecosystem (Oleson et al., 2013). A detailed description of its biogeophysical and biogeochemical parameterizations and numerical implementation is given in Oleson et al. (2013).
CLM4 and CLM4.5 can both be run with or without an active CN. When CN is active, i.e., nitrogen limitation is prognostic, potential GPP is calculated from the leaf photosynthetic rate without nitrogen constraint. The nitrogen required to achieve this potential GPP is then diagnosed, and the actual GPP is decreased if there is insufficient nitrogen to maintain the potential biomass increment. The nitrogen inducing the reduction of GPP is applied after the photosynthesis calculation and is independent of Vcmax, but does implicitly decrease Vcmax(Bonan et al., 2011, 2012). When CN is inactive, i.e., nitrogen limitation is prescribed, the potential
where f(N) is scaled between zero and one so that GPP is similarly decreased for nitrogen availability.
In CLM4.5, the original potential
An accurate land cover map can significantly reduce the uncertainty of land surface modeling. Based on Dempster-Shafer evidence theory, Ran et al. (2012) developed a high-accuracy (1 km) multi-source integrated Chinese land cover dataset (MICLCover), which shows great improvement compared to other popular land cover maps. It was generated using the International Geosphere Biosphere Programme classification system by combining five sets of relevant land cover data: the Vegetation Atlas of China (1:1β 000β 000) (Hou, 2001); a land use map of China (1:100β 000) for the year 2000 (Liu et al., 2002); a glacier distribution map of China (1:100β 000) (Wu and Li, 2004); a swamp-wetland map of China (1:1β 000β 000) (Zhang, 2002); and the Moderate Resolution Imaging Spectroradiometer (MODIS) product for 2001 (MODIS2001) (Friedl et al., 2002). The MICLCover map (http://westdc. westgis.ac.cn/dat) is expressed by the percentages of glaciers, lakes, wetland, urban land, and 16 PFTs in each grid, consistent with the classification in CLM. Yu et al. (2014) and Wang et al. (2015) found that the MICLCover map has the potential to improve land surface modeling with CLM. Here, we upscale the MICLCover map from 1 km to 0.5° by means of an area-weighted average and use it as the land cover data in CLM4.5 (Wang et al., 2015).
| Table 1 PFT (plant functional type)-specific photosynthetic parameters. |
To run CLM in the offline mode, atmospheric forcing data are required. The standard forcing provided with the model is a half-degree 110-year (1901-2010) dataset (CRUNCEP; Viovy, 2011) that includes precipitation, incident solar radiation, temperature, pressure, winds, humidity, and incident longwave radiation. It is a combination of two existing datasets: version 3.2 of the Climate Research Unit Time Series (CRU TS3.2) 0.5° × 0.5° monthly data from 1901 to 2002, and the National Centers for Environmental Prediction (NCEP) reanalysis 2.5° × 2.5° six-hourly data from 1948 to 2010 (Oleson et al., 2013).
Three products are used for benchmarking our comparisons: the global GPP (monthly, 0.5° × 0.5° ), upscaled from FLUXNET observations using the machine learning technique, model tree ensembles (MTE) from 1982 to 2011 (Jung et al., 2009, 2011, denoted as MTE_GPP); the global MODIS NPP product (MODIS17A2, monthly, 0.5° × 0.5° , denoted as MODIS_NPP) from 2000 to 2013; and the MODIS LAI product (MODIS15A2, monthly, 0.5° × 0.5° , denoted as MODIS_LAI) from 2000 to 2013. The MODIS LAI and NPP data are obtained from NASA Earth Observations (http://neo.sci.gsfc.nasa.gov/).
To investigate the effect of the revised Vcmax scheme on terrestrial carbon cycle modeling, two experiments using CLM4.5-CN were conducted with 0.5° × 0.5° resolution using the 20-year (1991-2010) CRUNCEP datasets as atmospheric forcing data and MICLCover map as surface data: (1) a control run with the default Vcmax scheme (denoted as CTL); (2) a new run with the revised Vcmax scheme (denoted as NEW). Besides the difference in the Vcmax schemes of the two experiments, all the other model configurations and input data were exactly the same. Both experiments were spun up for 1500 years for establishing the carbon and nitrogen pools and fluxes (Hudiburg et al., 2013; Kendra et al., 2012), forced circularly by 20 years’ atmospheric forcing. Subsequently, two simulations from 2000 to 2010 are analyzed.
To evaluate the model’ s performance, GPP, NPP, and LAI, which are the dominant components of the terrestrial carbon cycle from the two runs, are analyzed (denoted as CTL_GPP, CTL_NPP, and CTL_LAI, and NEW_GPP, NEW_NPP, and NEW_LAI, respectively). For time consistency, the simulated annual means of GPP, NPP, and LAI from 2000 to 2010 are compared with observations over China for the same time period.
To quantify the performance of the two Vcmax schemes in comparison with observations, we computed the correlation coefficient (R) and root-mean-square error (RMSE), defined as follows:
where x is the model simulation either from CTL or NEW, obs is the corresponding observation,
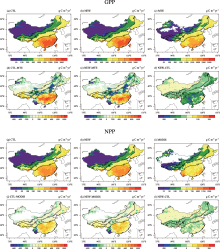
Figure 1 shows the spatial distributions of mean GPP from model simulations (CTL_GPP and NEW_GPP) and observation (MTE_GPP), together with their differences. To examine regional differences in the performance of the Vcmax schemes, four sub-regions over China are defined according to mean annual precipitation, Pmean: arid (Pmean ≤ 200 mm); semi-arid (200 mm < Pmean < 400 mm); semi-humid (400 mm < Pmean < 800 mm); humid (Pmean > 800 mm) (Yu et al., 2014). The spatial patterns of the simulated GPP are very similar (Figs. 1a and 1b), being characterized by a southeast-northwest gradient, consistent with MTE_GPP (Fig. 1c), with the largest annual GPP in humid regions, followed by semi-humid regions, semi-arid regions, and arid regions. The GPP annual means of the two simulations in China are 8.17 and 7.85 Pg C yr-1 respectively, which are much higher than the 7.05 Pg C yr-1 of MTE_GPP, albeit with obvious reduction in NEW_GPP. Although both simulations overestimate GPP in humid areas (Figs. 1d and 1e), NEW_GPP shows large improvements in these areas with a mean reduction of -65.4 g C m-2 yr-1. Apart from in the arid regions dominated by C3 or C4 grass and bare areas (not shown), the values of GPP are reduced significantly at the 95% confidence level in Qinghai-Tibet and southwest areas, which are dominated by cropland and trees (Fig. 1f). Although the values of new Vcmax are higher than the original values, which may induce higher potential leaf photosynthetic rates, the reduced total soil water availability (
Figure 1 also shows the spatial patterns of mean NPP. It can be seen that the CTL and NEW model simulations and observations (MODIS_NPP) show broadly similar patterns, with a northwest-southeast gradient over China (Figs. 1g-i). Compared with MODIS observations, CLM4.5 simulations clearly overestimate NPP in most areas of China, especially humid areas (Figs. 1j and 1k). The NPP means over China for CTL, NEW, and MODIS are 3.81, 3.78, and 2.71 Pg C yr-1, respectively. The scatterplots between CLM4.5 simulations and MODIS observations show that the new Vcmax scheme reduces the RMSE from 260.9 (CTL) to 260.7 g C m-2 yr-1. The mean annual NPP of the NEW run shows improvements in all four sub-regions compared to MODIS_NPP, with an increase of 0.7 g C m-2 yr-1 in arid areas and decreases of 8.3, 8.7, and 4.1 g C m-2 yr-1 in semi-arid, semi-humid, and humid areas, respectively. Furthermore, the RMSEs of NPP for the four sub-regions from the NEW run are all lower than those from the CTL run, especially for semi-arid and semi-humid areas, which also reflect the success of the revised Vcmax scheme (Fig. 4d).
 | Figure 1 Eleven-year (2000-10) mean gross primary production (GPP) from the (a) control run (CTL_GPP), (b) new Vcmax scheme (NEW_GPP), (c) observations (MTE_GPP), (d) CTL_GPP minus MTE_GPP, (e) NEW_GPP minus MTE_GPP, and (f) NEW_GPP minus CTL_GPP. Panels (g-l) are the same as GPP but for net primary production (NPP) from (g) CTL_NPP, (h) NEW_NPP, (i) MODIS_NPP, (j) CTL_NPP minus MODIS_NPP, (k) NEW_NPP minus MODIS_NPP, and (l) NEW_NPP minus CTL_NPP. The grid shadow regions are significant at the 95% confidence level by student’ s t test, and the isolines refer to the mean annual precipitation (mm yr-1). |
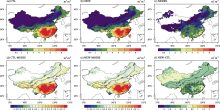
Figure 2 shows the spatial distributions of mean annual LAI from MODIS and the two CLM4.5 simulations and their differences. It is found that, as with GPP and NPP, the simulated LAI and MODIS_LAI all show southeast-northwest gradient (Figs. 2a-c). Both LAI simula-tions have positive biases in almost all areas of China, especially humid areas (Figs. 2d and 2e). However, the revised Vcmax scheme causes reductions in LAI in semi-arid, semi-humid, and humid areas (Fig. 2f), resulting in lower RMSE (2.3) in China compared with those of CTL_LAI (RMSE = 2.6) (Figs. 3e and 3f). And just like NPP, the RMSEs of LAI for the four sub-regions from NEW are all notably decreased, especially for humid areas, where RMSE is decreased from 4.8 to 4.2 (Fig. 4f).
 | Figure 2 Eleven-year (2000-10) mean leaf area index (LAI) from the (a) control run (CTL_LAI), (b) new Vcmax scheme (NEW_LAI), (c) observations (MODIS_LAI), (d) CTL_LAI minus MODIS_LAI, (e) NEW_LAI minus MODIS_LAI, and (f) NEW_LAI minus CTL_LAI. The grid shadow regions are significant at the 95% confidence level by student’ s t test, and the isolines refer to the mean annual precipitation (mm yr-1). |
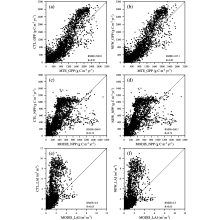
 | Figure 3 Comparison of annual GPP, NPP, and LAI from CLM4.5 model simulations (CTL and NEW) on 0.5° collocated grid boxes, with the corresponding observational data. RMSE = root-mean-square error; R = correlation coefficient. |
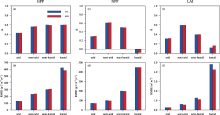
 | Figure 4 Comparison results of the control run (CTL) and new scheme (NEW) for (a-b) GPP, (c-d) NPP, and (e-f) LAI compared with observations over the four sub-regions: arid, semi-arid, semi-humid, and humid. |
As a key parameter for GPP simulation, Vcmax is required to be as accurate as possible in land surface models. In this study, to avoid the double nitrogen reduction of GPP in CLM4.5-CN, we revise the original Vcmax scheme with a new one that simply considers the transition between Vcmax25 and
Vcmax values of most terrestrial biosphere models are PFT-specific, including CLM4.5. However, some studies show that Vcmax may vary greatly even within a PFT, so a simple classification of photosynthesis parameters such as Vcmax may introduce large uncertainty (Bonan et al., 2011; Hudiburg et al., 2013). Therefore, a refinement of Vcmax parameter estimation is needed for CLM4.5 and other terrestrial biosphere models in future work.
| 1 |
|
| 2 |
|
| 3 |
|
| 4 |
|
| 5 |
|
| 6 |
|
| 7 |
|
| 8 |
|
| 9 |
|
| 10 |
|
| 11 |
|
| 12 |
|
| 13 |
|
| 14 |
|
| 15 |
|
| 16 |
|
| 17 |
|
| 18 |
|
| 19 |
|
| 20 |
|
| 21 |
|
| 22 |
|
| 23 |
|
| 24 |
|