The Relationship between the Interdecadal Variation of Summer Precipitation and Its Interannual Variability over the Middle and Lower Reaches of the Yangtze River Valley
[FU Yuan-Hai ]
]
]
|
|


Corresponding author: FU Yuan-Hai, fugreen1981@mail.iap.ac.cn
Citation: Fu, Y.-H., 2015: The relationship between the interdecadal variation of summer precipitation and its interannual variability over the middle and lower reaches of the Yangtze River Valley, Atmos. Oceanic Sci. Lett., 8, 127-133.
doi:10.3878/AOSL20140098.
Received 30 December 2014; revised 20 January 2015; accepted 26 January 2015; published 16 May 2015
The intensity of summer precipitation interannual variability is strongest over the middle and lower reaches of the Yangtze River Valley (MLYRV). The variability is larger than 1.5 mm d-1 and up to 35%-40% of the climatological mean summer precipitation. The relationship between the interdecadal change in the intensity of summer precipitation and its interannual variability over this area is investigated, by analyzing five gauged and re-constructed precipitation datasets. The relationship is found to be very weak over the MLYRV, with a correlation coefficient of only approximately 0.10. The Pacific Decadal Oscillation influences the western North Pacific subtropical high, which is responsible for the interdecadal change in summer precipitation over the MLYRV. However, the precipitation interannual variability is closely related to the ENSO events in the preceding winter due to its impact on the meridional displacement of the East Asian westerly jet. Different physical mechanisms cause different interdecadal variation in the intensity of summer precipitation and its interannual variability, and thus result in a poor relationship.
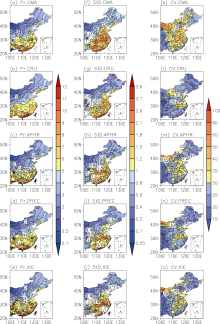
The summer precipitation over the middle and lower reaches of the Yangtze River Valley (MLYRV) has a strong interannual variability (Ding and Chan, 2005). In addition to the distinct quasi-biennial oscillation, there also exhibits an apparent dispersion from the mean state. The dispersion, which we called the intensity of interannual variability, is defined as the departure of precipitation from the mean state in the climate change process. In previous studies, the intensity of precipitation interannual variability was depicted by the precipitation coefficient of variation (CV), which is defined as the ratio of the standard deviation (StD) to the mean (Kripalani et al., 2007) and the interannual precipitation StD (Lu and Fu, 2010). The East Asian summer precipitation interannual variability is approximately 6%-7% of the climatological mean precipitation (Kripalani et al., 2007), and the interannual StD is approximately 0.56 mm d-1 over the East Asian summer precipitation belt (Lu and Fu, 2010). We further found that the interannual StD of summer precipitation over the MLYRV is highest (larger than 1.5 mm d-1) over eastern China. The CV also appears to be strongest (35%-40%) over here (Fig. 1), which means that the interannual StD could be 35%-40% of the climatological mean precipitation.
Generally, in statistics and probability theory, approximately 32% of the normally distributed data are without one StD of the mean, and approximately 5% of the data are without two StDs. The summer precipitation over the MLYRV happens to fit the normal distribution (Cao and Tao, 2002). Therefore, from the above-mentioned CV result, it can be concluded that approximately 32% of the summer precipitation would be above/below the climatological precipitation by 35%-40% over the MLYRV, and even 5% of the precipitation would be higher/lower than the mean state by 70%-80%, indicating the occurrence of severe climatic disasters.
Given such a strong summer precipitation interannual variability over the MLYRV, its change is an important measure of climate change. Furthermore, a larger precipitation variability tends to be accompanied by a higher predictability (Sun and Wang, 2013), although numerical simulations for precipitation based on climate models are still uncertain in East Asia (Jiang et al., 2005).
Recently, the intensity of summer precipitation interannual variability over MLYRV has experienced an interdecadal change (Ye, 2014). We preliminarily analyzed the wavelet spectrum of the summer precipitation interannual variability over the MLYRV using the Morlet wavelet analysis (figure not shown). The power mainly concentrates within bands of 16-20 years, suggesting an apparent interdecadal oscillation with a 16-20 year period. Meanwhile, extreme precipitation events have experienced obvious interdecadal variations (Wang et al., 2012), which provide more evidence of the interdecadal change in the summer precipitation interannual variability.
On the other hand, numerous studies have pointed out that the summer precipitation over the MLYRV also experiences strong interdecadal variation (e.g., Zhu et al., 2010). Therefore, it raises an important question: what is the relationship between the interdecadal changes in the intensity of summer precipitation and its interannual variability over the MLYRV?
 | Figure 1 Left panel: JJA-mean precipitation over eastern China ((a) CMA; (b) CRU; (c) APHR; (d) PREC; and (e) XIE, units: mm d-1); Middle panel: as in left panel, but for summer precipitation interannual StD (units: mm d-1); Right panel: as in left panel, but for CV of summer precipitation (units: %). |
Unfortunately, few studies have attempted to answer this question. Lu and Fu (2010) found that the increased ratio in the projected summer precipitation interannual variability is much stronger than that of the precipitation, indicating inconsistent changes. Sun and Ding (2010) projected a prominent change in the summer precipitation over the MLYRV circa the 2040s, with a large increase until the end of the 21st century. By analyzing the projected precipitation from nearly the same Coupled Model Intercomparison Project phase 3 models, Fu (2013) found that the East Asian summer precipitation interannual variability would experience two prominent changes circa the 2030s (rapid increase) and the 2070s (rapid decrease). These results reveal a phenomenon that the projected East Asian summer precipitation interannual variability would experience a different temporal evolution than the precipitation itself. Does this phenomenon occur in the observed precipitation? In this study, we attempt to answer this question by analyzing observed precipitation.
The observed daily precipitation data, which are provided by the China Meteorological Administration (CMA), at 582 rain gauge stations are used. The stations are selected from more than 730 stations to use as many stations as possible for the longest period. The monthly Climatic Research Unit (CRU) TS3.1 precipitation, Asian Precipitation-Highly-Resolved Observational Data Integration Towards Evaluation of Water Resources (hereafter APHR) V1003R1, National Oceanic and Atmospheric Administration’ s Precipitation Reconstruction Dataset (PREC), and reconstructed precipitation over East Asia by Xie et al. (2007) (hereafter XIE) are used in this investigation. Excepting for XIE (1962-2006), 47-year (1961-2007) precipitation are used. In addition, the National Centers for Environmental Prediction/National Center for Atmospheric Research Reanalysis geopotential height, zonal wind, and meridional wind are used.
The interdecadal and interannual components are separated by applying a nine-year Gaussian filter to the original precipitation. The interdecadal component represents the long-term variation in the precipitation; it is used to depict the intensity of precipitation. The interannual StD, which is based on the interannual component, is used to depict the intensity of interannual variability (Lu and Fu, 2010). The nine-year window slipping StD of the precipitation interannual variation is calculated to investigate the evolution of precipitation interannual variability (Fu, 2013). The correlation coefficient between the interdecadal changes in the intensity of summer precipitation and its interannual variability over the MLYRV is calculated for the corresponding periods (i.e., 1965-2003 for CMA, CRU, APHR, and PREC, and 1966-2002 for XIE).
The StD and CV are calculated as follows:
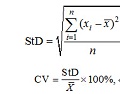
where nis the length of series, 

To facilitate the quantitative investigation, three indices are used in this study. The area averaged summer precipitation over the MLYRV (approximately 27-34° N, 108- 122° E) is calculated to facilitate a quantitative estimation of the relationship (Wang et al., 2012). The western North Pacific subtropical high index (WNPSHI) is defined as the June-July-August (JJA) mean 850 hPa geopotential height anomaly averaged over the region (10-30° N, 110-150° E) to measure the zonal displacement of the WNPSH (Lu and Fu, 2010). The East Asian westerly jet index (EAJI) is defined as the difference between the 200 hPa zonal wind averaged over (30-40° N, 120-150° E) and (40-50° N, 120-150° E) to measure the meridional displacement of the EAJ (Lu, 2004).
Figure 1 (middle panel) shows the interannual StD of summer precipitation over eastern China according to the five precipitation datasets. Generally, the interannual StD of summer precipitation intensifies from north to south, which is a similar pattern to the climatological summer precipitation (Fig. 1, left panel). However, excepting in a small-localized region along the southern coast, the summer precipitation interannual variability is strongest over the broad MLYRV (larger than 1.5 mm d-1 over the entire region and a maximum of 2.2 mm d-1); thus, the spatial pattern is different from that of the climatological mean summer precipitation. The interannual variability is approximately larger than 2.0 mm d-1 over the small-localized region along the southern coast. The values range from approximately 1.2-1.8 mm d-1 over most of South China, 0.8-1.2 mm d-1 over North China, and 0.6-0.8 mm d-1 over Northeast China.
The spatial pattern of the CV of summer precipitation is quite different from that of the interannual StD and the climatological precipitation, that the CV is relatively strong in northern China and weak in southern China (Fig. 1, right panel). In eastern China (east of 110° N), the CV appears to be strongest over the MLYRV, with an intensity as high as 35%-40%. The strongest interannual StD also happens to occur in this area. Therefore, the interannual StD of summer precipitation could be 35%- 40% of the climatological mean precipitation over the MLYRV, where is the most economically developed area of China and a major grain-producing area. The CV is approximately 30%-35% over North China, 25%-30% over South China, and 20%-30% over Northeast China. The result suggests that the intensity of precipitation interannual variability can definitely determine the precipitation intensity and the occurrence of extreme precipitation events, particularly over the MLYRV.
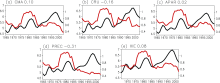
Figure 2 shows the interdecadal changes in the intensity of summer precipitation and its interannual variability over the MLYRV, and their correlation coefficients. All five correlation coefficients are consistently very weak (only approximately 0.10), although the signs of the correlations differ among the five datasets (positive for CMA, APHR, and XIE; negative for CRU and PREC); these results suggest that the interdecadal variations in the summer precipitation and its interannual variability are independent. Additionally, both the summer precipitation and its interannual variability have exhibited obvious phase variations in recent decades. They experienced similar changes in the 1970s and in the early 21st century but nearly reversed phases between the early 1980s and the late 1990s, indicating an unstable relationship existed and a poor relationship occurred.
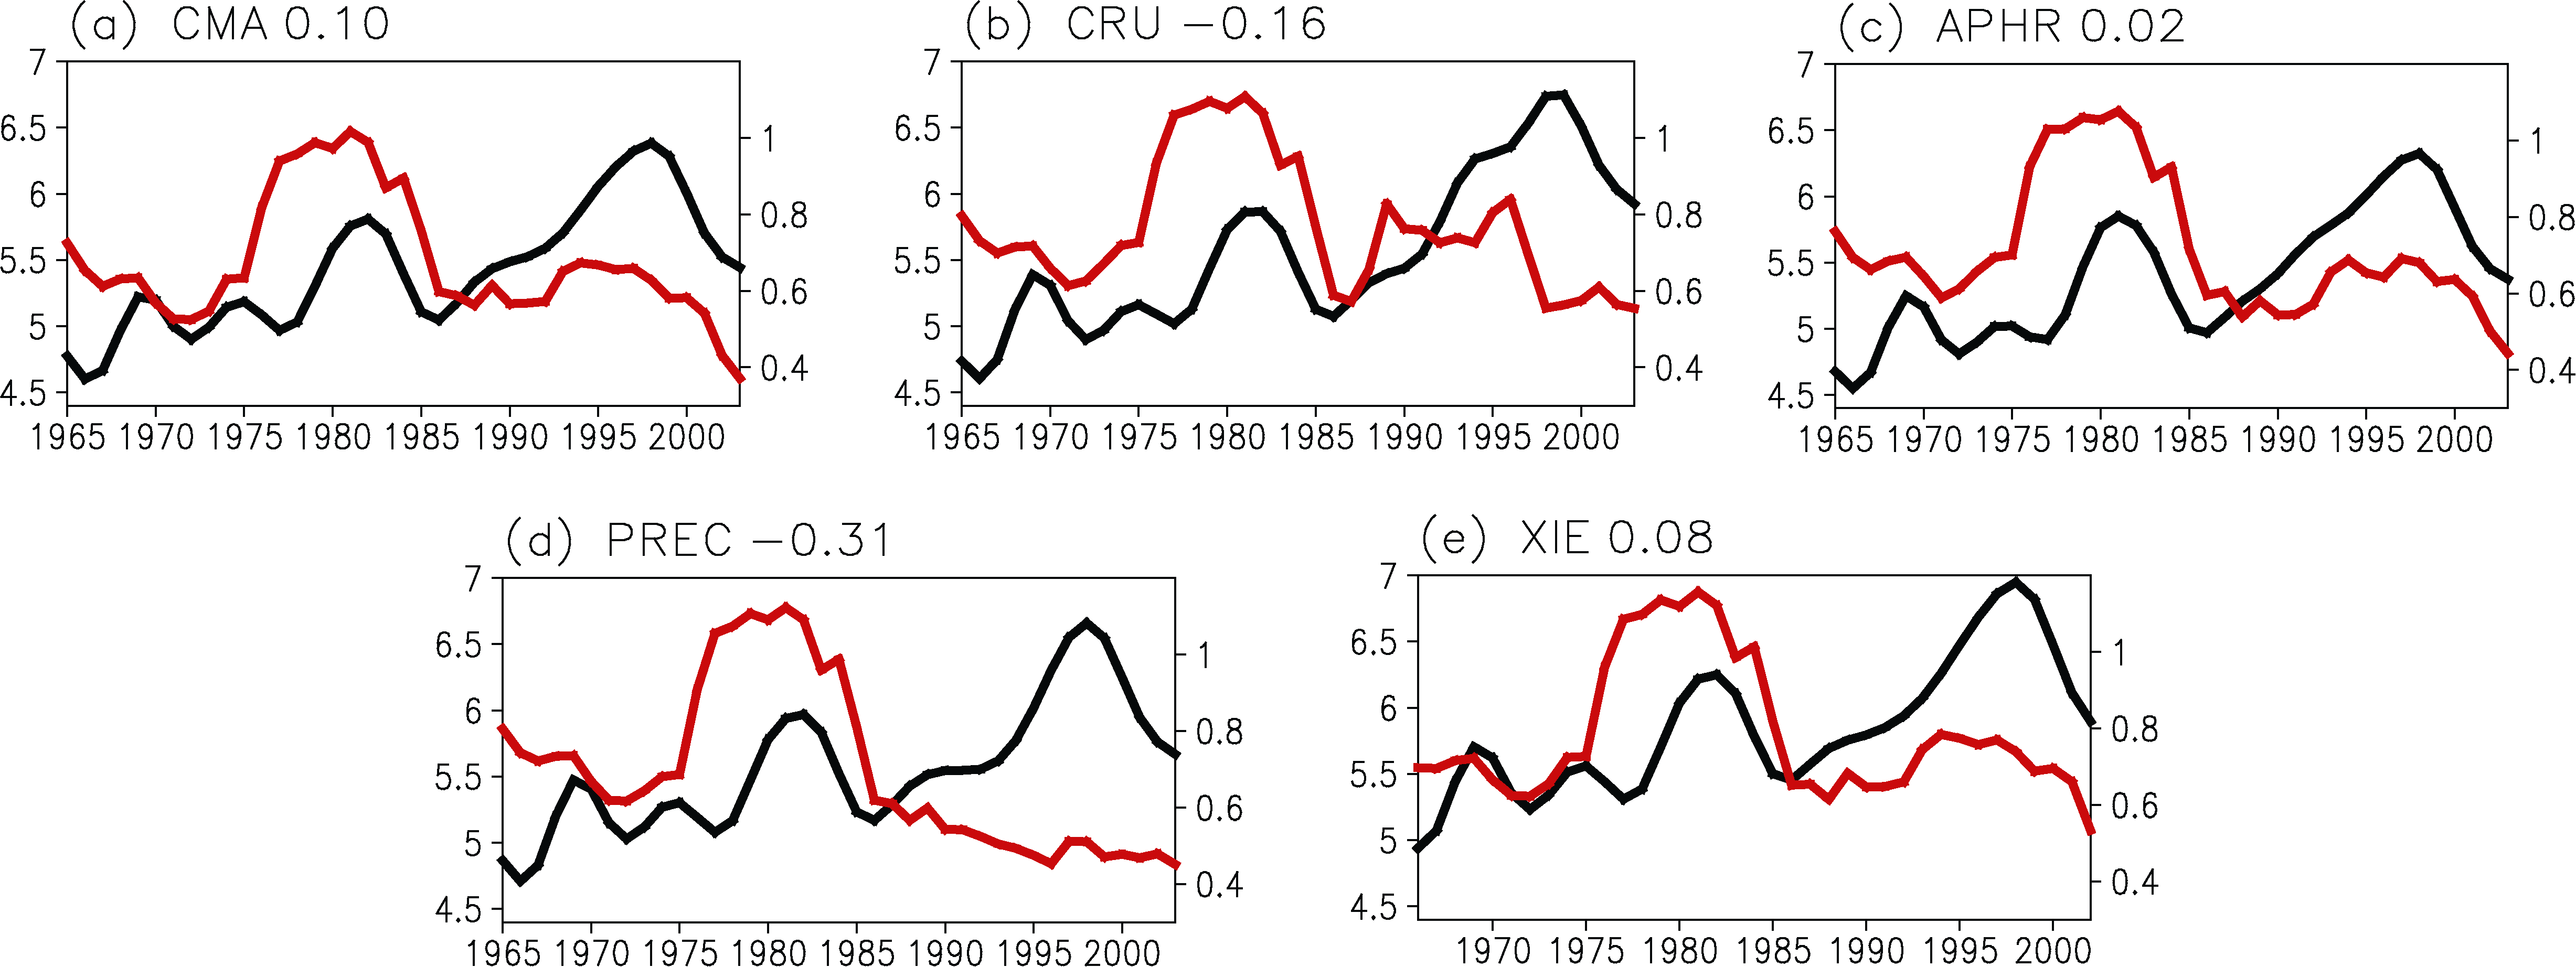 | Figure 2 Interdecadal variation of the summer precipitation (black line, left ordinate) and nine-year window slipping interannual StD (red line, right ordinate) over the MLYRV (units: mm d-1), and the correlation coefficients. |
Given the differences between the five correlation coefficients, we calculate the inter-correlations of the precipitation and its variability separately among the datasets. All ten correlation coefficients are larger than 0.95 and are significant at the 0.1% level, suggesting that there are no unique precipitation evolutions. The same results are found for the precipitation interannual variability. Therefore, the correlation coefficients between the interdecadal changes in precipitation and its interannual variability are essentially similar among the five datasets.
The variation in the summer precipitation over the MLYRV is closely related to the local circulation variation as well as those in the western North Pacific (Yu and Zhou, 2007). The interdecadal shifts in the WNPSH and the EAJ cause the abrupt change in the summer precipitation, forming the well-known “ southern flood and northern drought” precipitation pattern (Yu and Zhou, 2007). However, the interannual variability of the East Asian summer precipitation is closely associated with the year-to-year zonal displacement of the WNPSH and meridional displacement of the EAJ (Lu, 2004). Fu (2013) further noted that the temporal evolution of precipitation interannual variability is closely associated with that of the WNPSH and EAJ variabilities.
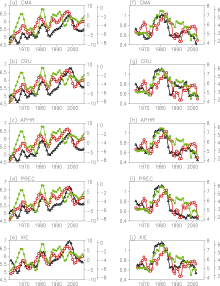
Figure 3 (left panel) shows that the precipitation and the WNPSH have experienced nearly the same phase variations in recent decades, particularly after the late 1970s. All the five correlation coefficients between precipitation and the WNPSHI are larger than 0.74 and statistically significant at the 0.1% level (Table 1), indicating that the interdecadal WNPSH variation can explain 54.8%-67.2% of the variance in the summer precipitation variation. However, the temporal evolution of WNPSH interannual variability is inconsistent with that of the precipitation (Fig. 3, right panel). The correlation coefficients between the interannual variabilities of the precipitation and WNPSHI is approximately 0.42-0.52, which all decrease by approximately 0.3 comparing with those between the interdecadal changes in precipitation and WNPSH (Table 1). The results suggest that the WNPSH plays a key role in affecting the interdecadal change in the summer precipitation over the MLYRV, but plays a much smaller role in affecting the summer precipitation interannual variability.
The EAJ exhibits much larger interdecadal change than the precipitation and WNPSH (Fig. 3, left panel). It even experiences a reverse-phase variation in the precipitation and WNPSH during the 1990s, indicating a poorer correlation between the EAJ and precipitation than between the WNPSH and precipitation. The correlation coefficients range from 0.42 (XIE) to 0.52 (APHR) (Table 1); these values are much weaker than those between precipitation and WNPSHI, further proving that a relatively poor relationship exists. In contrast, the EAJ interannual variability evolves in nearly the same manner as the precipitation interannual variability during almost all the time (Fig. 3, right panel). All the five correlation coefficients intensify and range from 0.69 (PREC) to 0.81 (CMA) (Table 1). Therefore, the interannual variability in the EAJ can explain approximately 47.6%-65.6% of the variance in precipitation interannual variability. Especially in CRU, the correlation coefficient increases from 0.39 to 0.81. Large increases also occur in CMA and XIE, with increases from 0.59 to 0.81 and from 0.56 to 0.78, respectively. The results suggest that the EAJ has a relatively weak impact on the interdecadal change in summer precipitation, but has a much stronger impact on the summer precipitation interannual variability, which is opposite to the WNPSH.
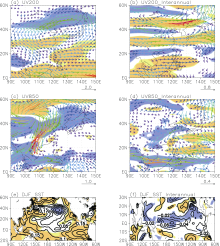
The upper and lower tropospheric wind regressed onto the summer precipitation over the MLYRV on the interdecadal and interannual timescales are shown in Figs. 4a-d. It shows that the circulations are completely different from each other. On the interdecadal timescale, there is a cyclonic anomaly over Northeast Asia in the upper troposphere (Fig. 4a) and an anticyclonic anomaly over the Mongolia Plateau in the lower troposphere (Fig. 4c), exhibiting an approximately baroclinic structure. During flood period, the southwesterly wind transports water vapor northward and converges over the MLYRV. While during drought period, the northeasterly wind dominates East Asia and diverges over this region. On the interannual timescale, the well-defined meridional Pacific-Japan (PJ) teleconnection pattern, with each cell being elongated zonally, appears over the western North Pacific-East Asia in both the upper and lower troposphere (Figs. 4b and 4d), exhibiting a roughly barotropic structure. The north-positive-south-negative pattern over East Asia in the extratropical upper troposphere indicates the poleward and southward displacements of the EAJ, which is closely related to the summer precipitation interannual variability over the MLYRV. The circulation structures associated with the meridional teleconnection agree with previous studies (Kosaka and Nakamura, 2006).
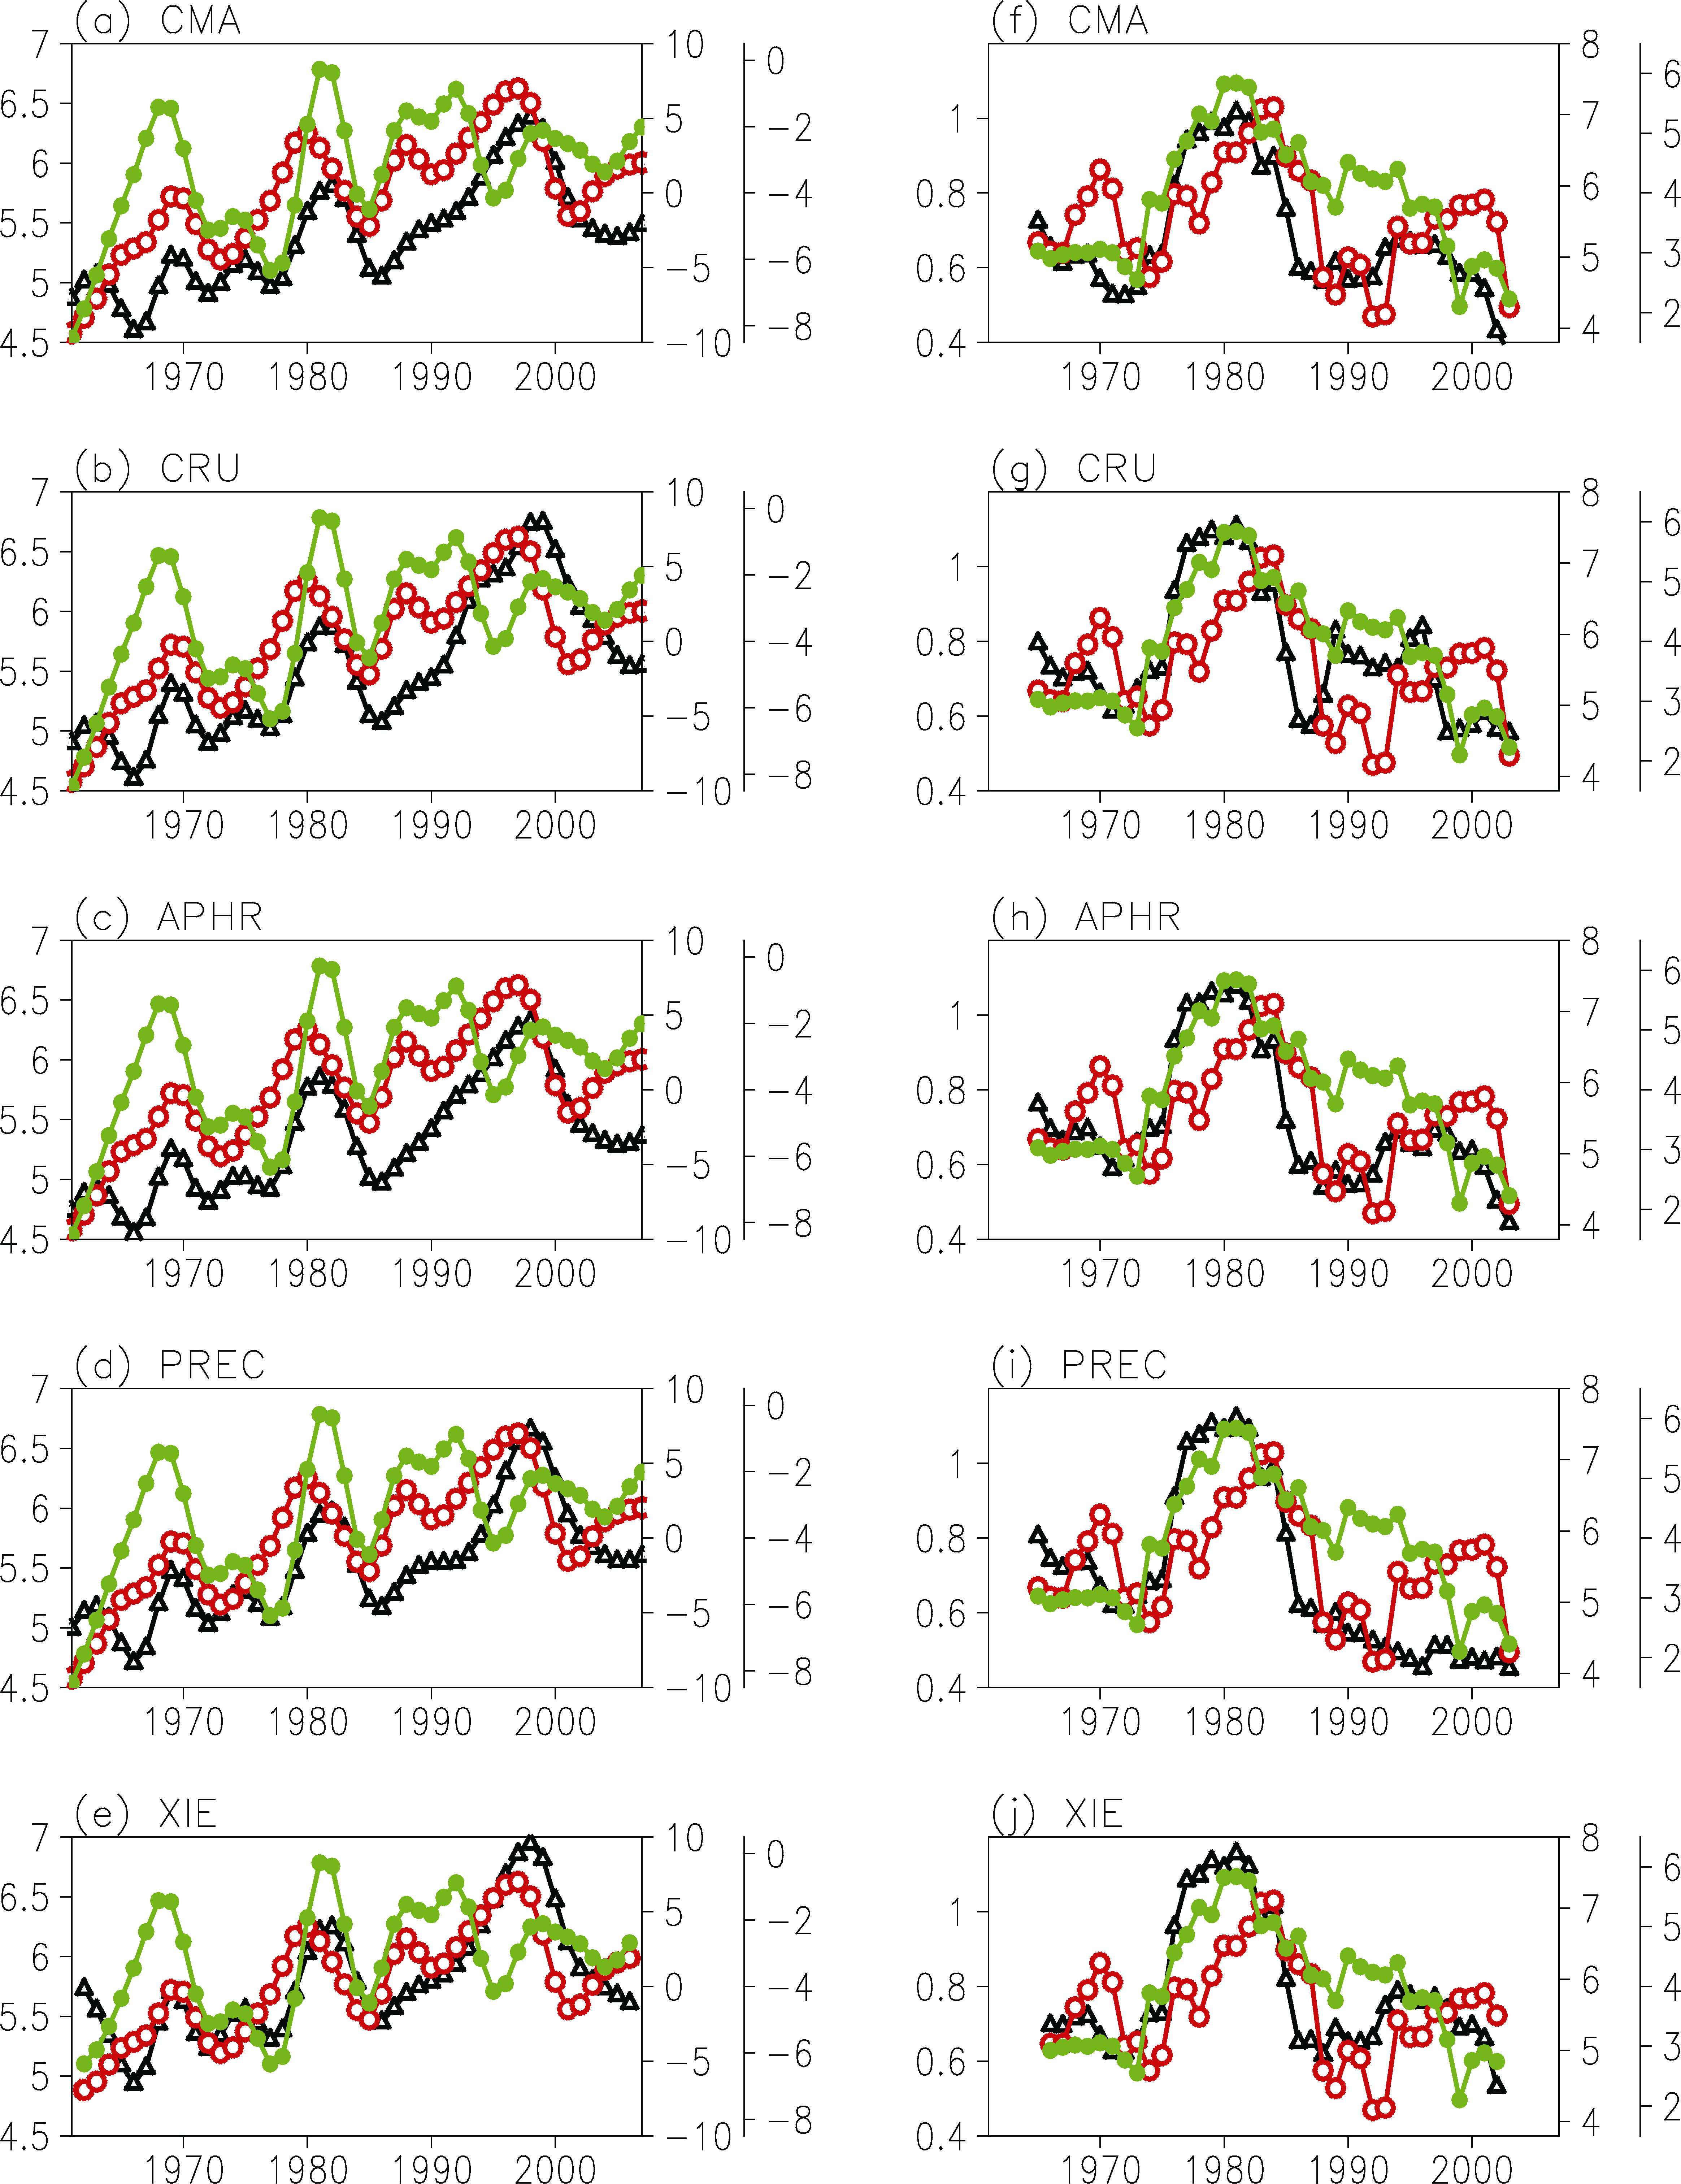 | Figure 3 Left panel: interdecadal change in summer precipitation over the MLYRV (black line, left ordinate, units: mm d-1) in five datasets ((a) CMA; (b) CRU; (c) APHR; (d) PREC; and (e) XIE), the WNPSHI (red line, the first right ordinate, unit: gpm), and the EAJI (green line, the second right ordinate, units: m s-1); Right panel: as in left panel, but for nine-year window slipping interannual StD of the summer precipitation, the WNPSHI, and the EAJI. |
| Table 1 The correlation coefficients (C.C.) between the summer precipitation (Pr) over the MLYRV and the WNPSHI and EAJI (bold), and the correlation coefficients between the interannual variability of the precipitation and the two circulation indices (Italic) in five datasets. |
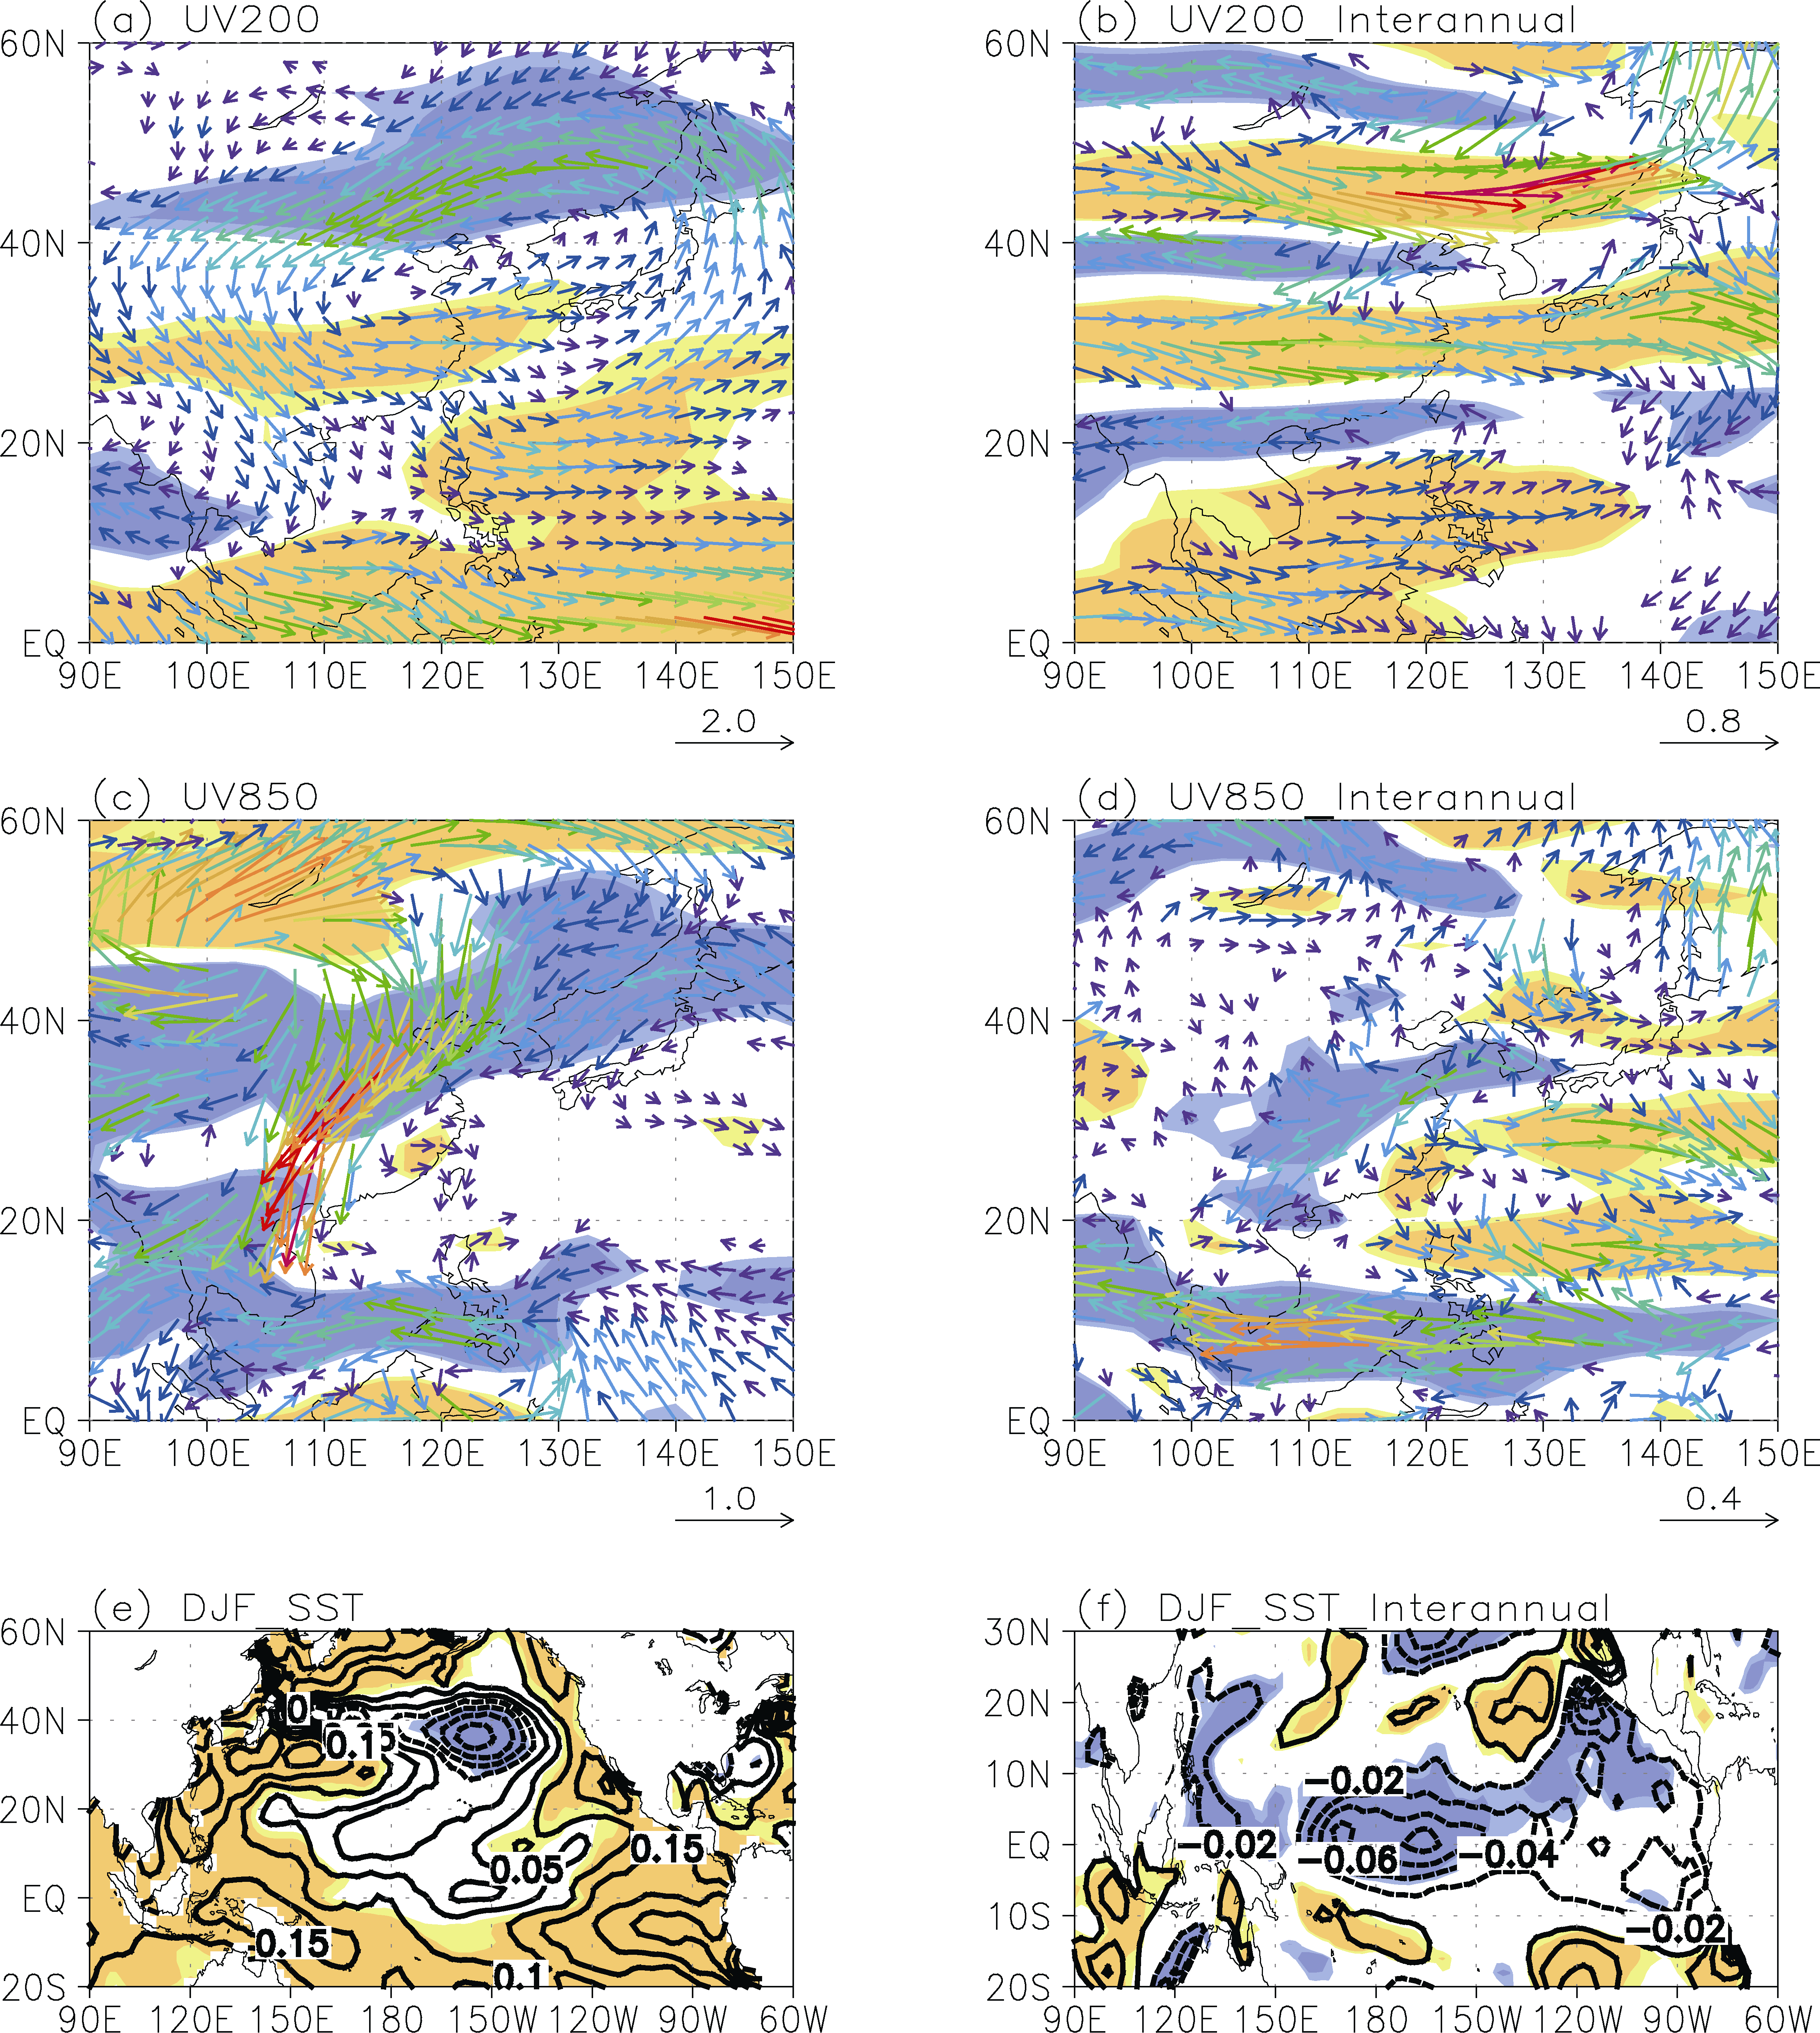 | Figure 4 JJA-mean wind at (a) 200 hPa (units: m s-1), (c) 850 hPa (units: m s-1) and (e) the preceding DJF SST (units: ° C) regressed onto the standardized summer precipitation over the MLYRV on the interdecadal timescale. The nine-year window slipping interannual StD of the JJA-mean wind at (b) 200 hPa (units: m s-1), (d) 850 hPa (units: m s-1) and (f) the preceding DJF SST (units: ° C) regressed onto that of the summer precipitation. Only wind vectors that are larger than 0.1 m s-1 ((a), (b), and (c)) and 0.02 m s-1 (d) are shown. Values statistically significant at the 0.05 and 0.01 levels are shaded (yellow, positive; blue, negative). |
Figure 4e shows the preceding winter sea surface temperature (SST) regressed onto the summer precipitation over the MLYRV on the interdecadal timescale. More summer precipitation over the MLYRV corresponds to a negative SST anomaly in the extratropical North Pacific and positive SST anomaly in the tropical eastern Pacific, i.e., a warm Pacific Decadal Oscillation (PDO) pattern. During the flood (drought) period, the SST anomaly is negative (positive) in the extratropical North pacific but positive (negative) in the tropical eastern Pacific, namely, the warm (cold) PDO phase, which is consistent with previous studies (e.g., Zhu et al., 2010). Yu et al. (2014) noted that during the warm PDO phase, the warm winter SST in the eastern subtropical Pacific propagates into the tropics in the following summer and warms the eastern tropical Pacific Ocean, which in turn causes an anomalous zonal circulation over the subtropical-tropical Pacific Ocean that induces a strengthened WNPSH and more moisture over the MLYRV.
On the interannual timescale, the summer precipitation anomaly is closely related to the preceding winter SST anomaly over the tropical central and eastern Pacific (Fig. 4f), which happen to be the ENSO pattern, as shown in previous studies (e.g., Li et al., 2008). The preceding winter El Niñ o (La Niñ a) events correspond to a southward (northward) displaced EAJ in the following summer, resulted in heavier (lighter) precipitation over the MLYRV. Generally, the ENSO-related tropical Indian Ocean SST anomaly persists through following summer and warms the overlying tropospheric air through an anomalous convection, in turn forces a Kelvin wave that penetrating into the equatorial western Pacific and causing the convection anomaly over the WNP (Xie et al., 2009). The convection anomaly forces the PJ teleconnection (Lu, 2004), and the teleconnection associated wind anomaly in the upper level leads to the EAJ meridional shift (Qu and Huang, 2012).
Therefore, the factors that affect the intensity of summer precipitation and its interannual variability over the MLYRV are very different from each other; thus, interdecadal variations differ, and a poor relationship is found.
In this study, the relationship between the interdecadal changes in the intensity of summer precipitation and its interannual variability over the MLYRV are investigated, by analyzing the observed monthly precipitation from rain gauge stations and the monthly CRU, APHR, PREC, and XIE precipitation datasets.
The intensity of summer precipitation interannual variability is strongest over the MLYRV. The interannual StD of the summer precipitation is larger than 1.5 mm d-1, with a maximum of 2.2 mm d-1 over the MLYRV. The CV is approximately 35%-40% over the area; thus, the interannual StD could be 35%-40% of the climatological summer precipitation.
The relationship between the interdecadal changes in the intensity of summer precipitation and its interannual variability is very weak over the MLYRV, with a correlation coefficient of approximately 0.10. Therefore, the change in the summer precipitation interannual variability is not consistent with the precipitation itself directly.
The interdecadal change in the summer precipitation over the MLYRV is closely related to the PDO phase. When the PDO is positive, the WNPSH is strengthened and more moisture is transported to the MLYRV in summer, resulting in enhanced precipitation. In contrast, the ENSO event in the preceding winter plays a key role in affecting the summer precipitation interannual variability via affecting the meridional displacement of the EAJ. The different physical mechanisms that affect the interdecadal variation in the intensity of summer precipitation and its interannual variability lead to the poor relationship between the precipitation and interannual variability.
| 1 |
|
| 2 |
|
| 3 |
|
| 4 |
|
| 5 |
|
| 6 |
|
| 7 |
|
| 8 |
|
| 9 |
|
| 10 |
|
| 11 |
|
| 12 |
|
| 13 |
|
| 14 |
|
| 15 |
|
| 16 |
|
| 17 |
|
| 18 |
|
| 19 |
|