
Projected Climate Change in the Northwestern Arid Regions of China: An Ensemble of Regional Climate Model Simulations
[YU En-Tao1, 2  , XIANG Wei-Ling
3 ]
, XIANG Wei-Ling|
|


Corresponding author: YU En-Tao, yetsyu@mail.iap.ac.cn
Citation: Yu, E.-T., and W.-L. Xiang, 2015: Projected climate change in the northwestern arid regions of China: An ensemble of regional climate model simulations, Atmos. Oceanic Sci. Lett., 8, 134-142.
doi:10.3878/AOSL20140094.
Received 23 December 2014; revised 23 January 2015; accepted 27 January 2015; published 16 May 2015
The projected temperature and precipitationchange under different emissions scenarios using Coupled Model Intercomparison Project Phase 5 models over the northwestern arid regions of China (NWAC) were analyzed using the ensemble of three high-resolution dynamical downscaling simulations: the simulation of the Regional Climate Model version 4.0 (RegCM4) forced by the Beijing Climate Center Climate System Model version 1.1 (BCC_CSM1.1); the Hadley Centre Global Environmental Model version 3 regional climate model (HadGEM3-RA) forced by the Atmosphere-Ocean coupled HadGEM version 2 (HadGEM2-AO); and the Weather Research and Forecasting (WRF) model forced by the Norwegian community Earth System Model (NorESM1-M). Model validation indicated that the multimodel simulations reproduce the spatial and temporal distribution of temperature and precipitation well. The temperature is projected to increase over NWAC under both the 4.5 and 8.5 Representative Concentration Pathways scenarios (RCP4.5 and RCP8.5, respectively) in the middle of the 21st century, but the warming trend is larger under the RCP8.5 scenario. Precipitation shows a significant increasing trend in spring and winter under both RCP4.5 and RCP8.5; but in summer, precipitation is projected to decrease in the Tarim Basin and Junggar Basin. The regional averaged temperature and precipitation show increasing trends in the future over NWAC; meanwhile, the large variability of the winter mean temperature and precipitation may induce more extreme cold events and intense snowfall events in these regions in the future.
The northwestern arid regions of China (NWAC) are the vast areas north of the Kunlun Mountains and west of the Helan Mountains. They cover about 2.5 million km2 and include the Tsaidam Basin, Tarim Basin, Junggar Basin, Hexi Corridor, and Alashan Plateau (Pan et al., 2001). Most of the areas are occupied by desert, along with other natural systems such as mountains, rivers, and oases. These regions are the third largest natural zone in China (behind the monsoon region in eastern China and the Tibetan Plateau), and are thus important for China from the perspective of natural resources, the environment, and social benefits. However, these regions are especially sensitive to climate change (Pan et al., 2001; Yu et al., 2014b), and assessing the impacts of climate change on these regions at the regional scale can provide a scientific basis for decision making with respect to mitigation and adaption policies. Therefore, climate change projections based on reliable numerical models are especially meaningful for these regions.
The coupled global climate model is the primary tool for estimating climate change. The results of such models are used to evaluate the climate response to various Representative Concentration Pathway (RCP) scenarios, and these results enable a more comprehensive understanding of the future climate under different future conditions (Xu and Xu, 2012; Chen, 2013). However, the horizontal resolutions of the models involved in the Coupled Model Intercomparison Project Phase 5 (CMIP5) span from 100 km to 300 km (Taylor et al., 2011), which is too coarse for resolving mesoscale- or regional-scale climate features. The World Climate Research Program initiated the Coordinated Regional Climate Downscaling Experiment (CORDEX; Giorgi et al., 2009), which provides high-resolution regional climate change projections on land areas worldwide by using regional climate models (RCMs). Meanwhile, there have also been other dynamical downscaling simulations conducted over China (Wu et al., 2011; Gao et al., 2012; Yu et al., 2014b). These simulations provide us with new information on regional-scale climate change with higher resolution than the CMIP5 global climate models can provide. In the present study, we assessed the available state-of-the-art models’ performances over NWAC, and analyzed the projected future climate change, thus providing the first high-resolution climate change information over NWAC.
In this study, we used three dynamical downscaling simulations. The first simulation was conducted by the National Climate Center, China Meteorological Administration (CMA), which applied the Regional Climate Model version 4.0 (RegCM4), with the initial and boundary conditions supplied by the Beijing Climate Center Climate System Model version 1.1 (BCC_CSM1.1). Further details can be found in Ji (2012), Gao et al. (2013), and Ji and Kang (2013). The second simulation was completed by the National Institute of Meteorological Research (NIMR), Korea. The simulation applied the Hadley Centre Global Environmental Model version 3 regional climate model (HadGEM3-RA), which is based on the global atmospheric HadGEM3 of the Met Office Hadley Centre (MOHC). The initial and boundary conditions were from the Atmosphere-Ocean coupled Hadley Center Global Environmental Model version 2 (HadGEM2-AO), and the output of the simulation are archived in the CORDEX East Asia project site (https://cordex-ea.climate.go.kr/main/modelsPage.do). The third simulation was carried out at the Bjerknes Centre for Climate Research (BCCR), Norway. This simulation applied the Weather Research and Forecasting model version 3 (WRFV3), and the initial and boundary conditions were from the Norwegian community Earth System Model (NorESM1-M). All the simulations included historical, RCP4.5 and RCP8.5 experiments, and the horizontal resolutions of the RCMs were about 50 km. The simulation domain of RegCM4 was different from the other two simulations, but they all covered China; thus, in this paper, we analyze the ensemble results over NWAC. More details of the places of NWAC can be found in Yu et al. (2014a). The period 1986-2005 was considered as the baseline period, which represents the present climatology, and the period of 2046-65 was considered as the middle of the 21st century.
Due to uncertainties in the data sources and processing algorithm, observational products have potential uncertainties; thus, they can only provide possibilities for the observational truth. For model validation, we used two observational datasets; namely, the CN05 data from the CMA (Wu and Gao, 2013), and the Asian Precipitation-Highly Resolved Observational Data Integration Towards Evaluation of Water Resources (APHRODITE) data (Yatagai et al., 2012). These two datasets contain daily temperature and precipitation at the same resolution of 0.25° , and are reliable and widely used in model validation over China (Han and Zhou, 2012; Gao et al., 2013). The average of these two datasets was used to represent the observation.
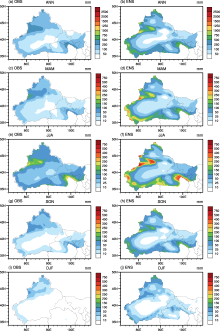
Figure 1 illustrates the spatial distribution of annual and seasonal mean temperature in NWAC from the observation and the multi-model ensemble mean for the baseline period of 1986-2005. The observed temperature shows ‘ mountains around basins’ features, with the temperature higher in the Tarim Basin, Junggar Basin, and Tsaidam Basin, while lower in the Kunlun Mountains, Tianshan Mountains, and Altai Mountains. The maximum temperature is above 35° C in summer in the Turpan Basin, and the minimum temperature is below -20° C in the mountain areas in winter. These features are captured well by the multimodel simulations, although there are small cold biases across all seasons. Moreover, the spatial heterogeneity of temperature induced by the topography can be reproduced well by the multimodel simulations.
The spatial distribution of annual and seasonal mean precipitation from the observation and multimodel simulations are illustrated in Fig. 2. There is almost no precipitation observed in the desert regions, including the Tarim Basin and Tsaidam Basin; however, the precipitation amounts are relatively higher in the mountain areas, with the rainfall amount reaching 800 mm yr-1. The seasonal variation is significant, with the precipitation higher in summer but lower in winter. The multimodel ensemble can reproduce the spatial and temporal features of precipitation well, with positive bias in the mountain areas. However, apart from model deficiency, the uncertainties in the observational data may also explain the bias (Shen and Liang, 2004; Gao et al., 2008; Ye et al., 2008; Yu, 2012; Yu et al., 2014b).
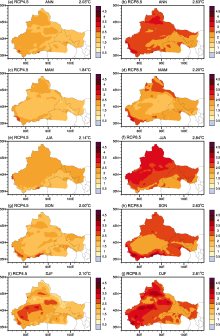
The temperature change in the middle of 21st century under the RCP4.5 and RCP8.5 scenarios over NWAC are illustrated in Fig. 3. Consistent warming is projected by the multimodel simulations, with larger magnitude under RCP8.5 compared with RCP4.5. The area-averaged annual mean temperature increase by 2.03° C (2.63° C) under RCP4.5 (RCP8.5), and the magnitude of area-averaged temperature increase is larger in summer and winter than in spring and autumn under both RCP4.5 and RCP8.5. For the RCP4.5 scenario, the warming is mainly located in the mountain areas and the western part of the arid regions. In summer, the regions where the temperature increases by more than 3° C covers more areas than other seasons. However, the most significant warming occurs in winter, with the temperature increasing by more than 4° C in the marginal regions of the Tarim Basin and Tsaidam Basin. Under the RCP8.5 scenario, temperature is projected to increase much faster than under the RCP4.5 scenario, with the regions where temperatures increase by more than 3° C extending all over the NWAC in summer, autumn, and winter.
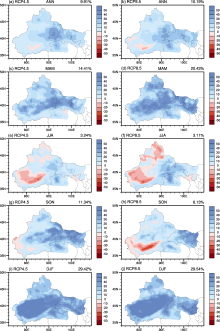
Figure 4 shows the annual and seasonal mean precipitation change over NWAC in the middle of 21st century compared to the baseline period of 1986-2005. The area-averaged precipitation is projected to increase by about 10% under both RCP4.5 and RCP8.5, and the magnitude is larger in the cold seasons (spring and winter) than the warm seasons (summer and autumn). In terms of the spatial distribution, there are similar spatial characteristics under the RCP4.5 and RCP8.5 scenarios. The annual mean precipitation increases over most regions, with the center located in the eastern part of NWAC. In the central regions of the Tarim Basin and Junggar Basin, there is a small negative trend of precipitation change. Similar seasonal precipitation change features are observed under the RCP4.5 and RCP8.5 scenarios. In spring and winter, there is a consistent wet trend in the middle of the 21st century across the whole area. Meanwhile, in summer, precipitation is projected to decrease in the Tarim Basin and Junggar Basin, and increase in the region of the Turpan Basin. In autumn, precipitation shows a positive trend in most areas except some mountain areas of the Kunlun Mountains.
 | Figure 1 The spatial distribution of (a, b) annual and seasonal ((c, d) spring (March-May, MAM); (e, f) summer (June-August, JJA); (g, h) autumn (September-November, SON); (i, j) winter (December-February, DJF)) mean temperature from (a, c, e, g, i) observation and (b, d, f, h, j) the multimodel ensemble mean bias, for the period 1986-2005 (units: ° C). |
 | Figure 2 The spatial distribution of (a, b) annual and seasonal ((c, d) spring (MAM); (e, f) summer (JJA); (g, h) autumn (SON); (i, j) winter (DJF)) mean precipitation from (a, c, e, g, i) observation and (b, d, f, h, j) the multimodel ensemble mean, for the period 1986-2005 (units: mm). |
 | Figure 3 Projected annual (a, b) and seasonal ((c, d) spring (MAM); (e, f) summer (JJA); (g, h) autumn (SON); (i, j) winter (DJF)) mean temperature change under the (a, c, e, g, i) RCP4.5 and (b, d, f, h, j) RCP8.5 scenarios (units: ° C). |
 | Figure 4 Projected annual (a, b) and seasonal ((c, d) spring (MAM); (e, f) summer (JJA); (g, h) autumn (SON); (i, j) winter (DJF)) mean precipitation change under the (a, c, e, g, i) RCP4.5 and (b, d, f, h, j) RCP8.5 scenarios (units: %). |
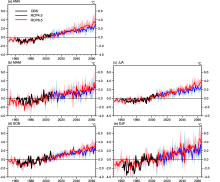
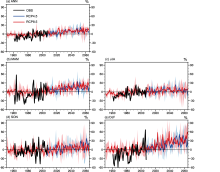
Annual and seasonal temperatures averaged over NWAC are shown in Fig. 5. Observations are available for the period 1961-2007, and the multimodel ensembles display good agreement with these data, indicating satisfactory performance of the models in reproducing the annual and seasonal temperature variation. A significant warming trend is exhibited under the RCP4.5 and RCP8.5 scenarios over NWAC. By the middle of 21st century, the annual mean temperature is projected to increase by 3° C under the RCP8.5 scenario; while under the RCP4.5 scenario, the temperature exhibits a smaller increasing trend, especially during the later decades of the middle of the 21st century. The seasonal temperature change shows similar features to the annual mean. However, there are significant differences in the interannual temperature variation among different seasons. In spring and winter, larger interannual variation is projected, indicating that there could be more extreme cold events in these two seasons over NWAC.
Figure 6 illustrates the annual and seasonal mean precipitation change averaged over NWAC. For the historical simulation, the ability of the models in simulating the interannual variation of precipitation is weaker than that of temperature, which is common in the model simulation field. The trend of precipitation change can be reproduced well; however, the variation of seasonal precipitation is smaller in the simulation, especially in spring and winter. In the middle of the 21st century, precipitation shows an increasing trend under both RCP4.5 and RCP8.5 on the annual and seasonal scale, and the precipitation changes share similar features. The annual mean precipitation is projected to increase by about 20% in the middle of the 21st century compared to the baseline period of 1986- 2005 under both emissions scenarios; meanwhile, the winter mean precipitation exhibits a larger increasing trend, reaching 50% in the middle of the 21st century. In terms of future precipitation variability, the winter mean precipitation shows the largest variability during the later decades of the middle of the 21st century, which may induce more intense snowfall events over NWAC in the future.
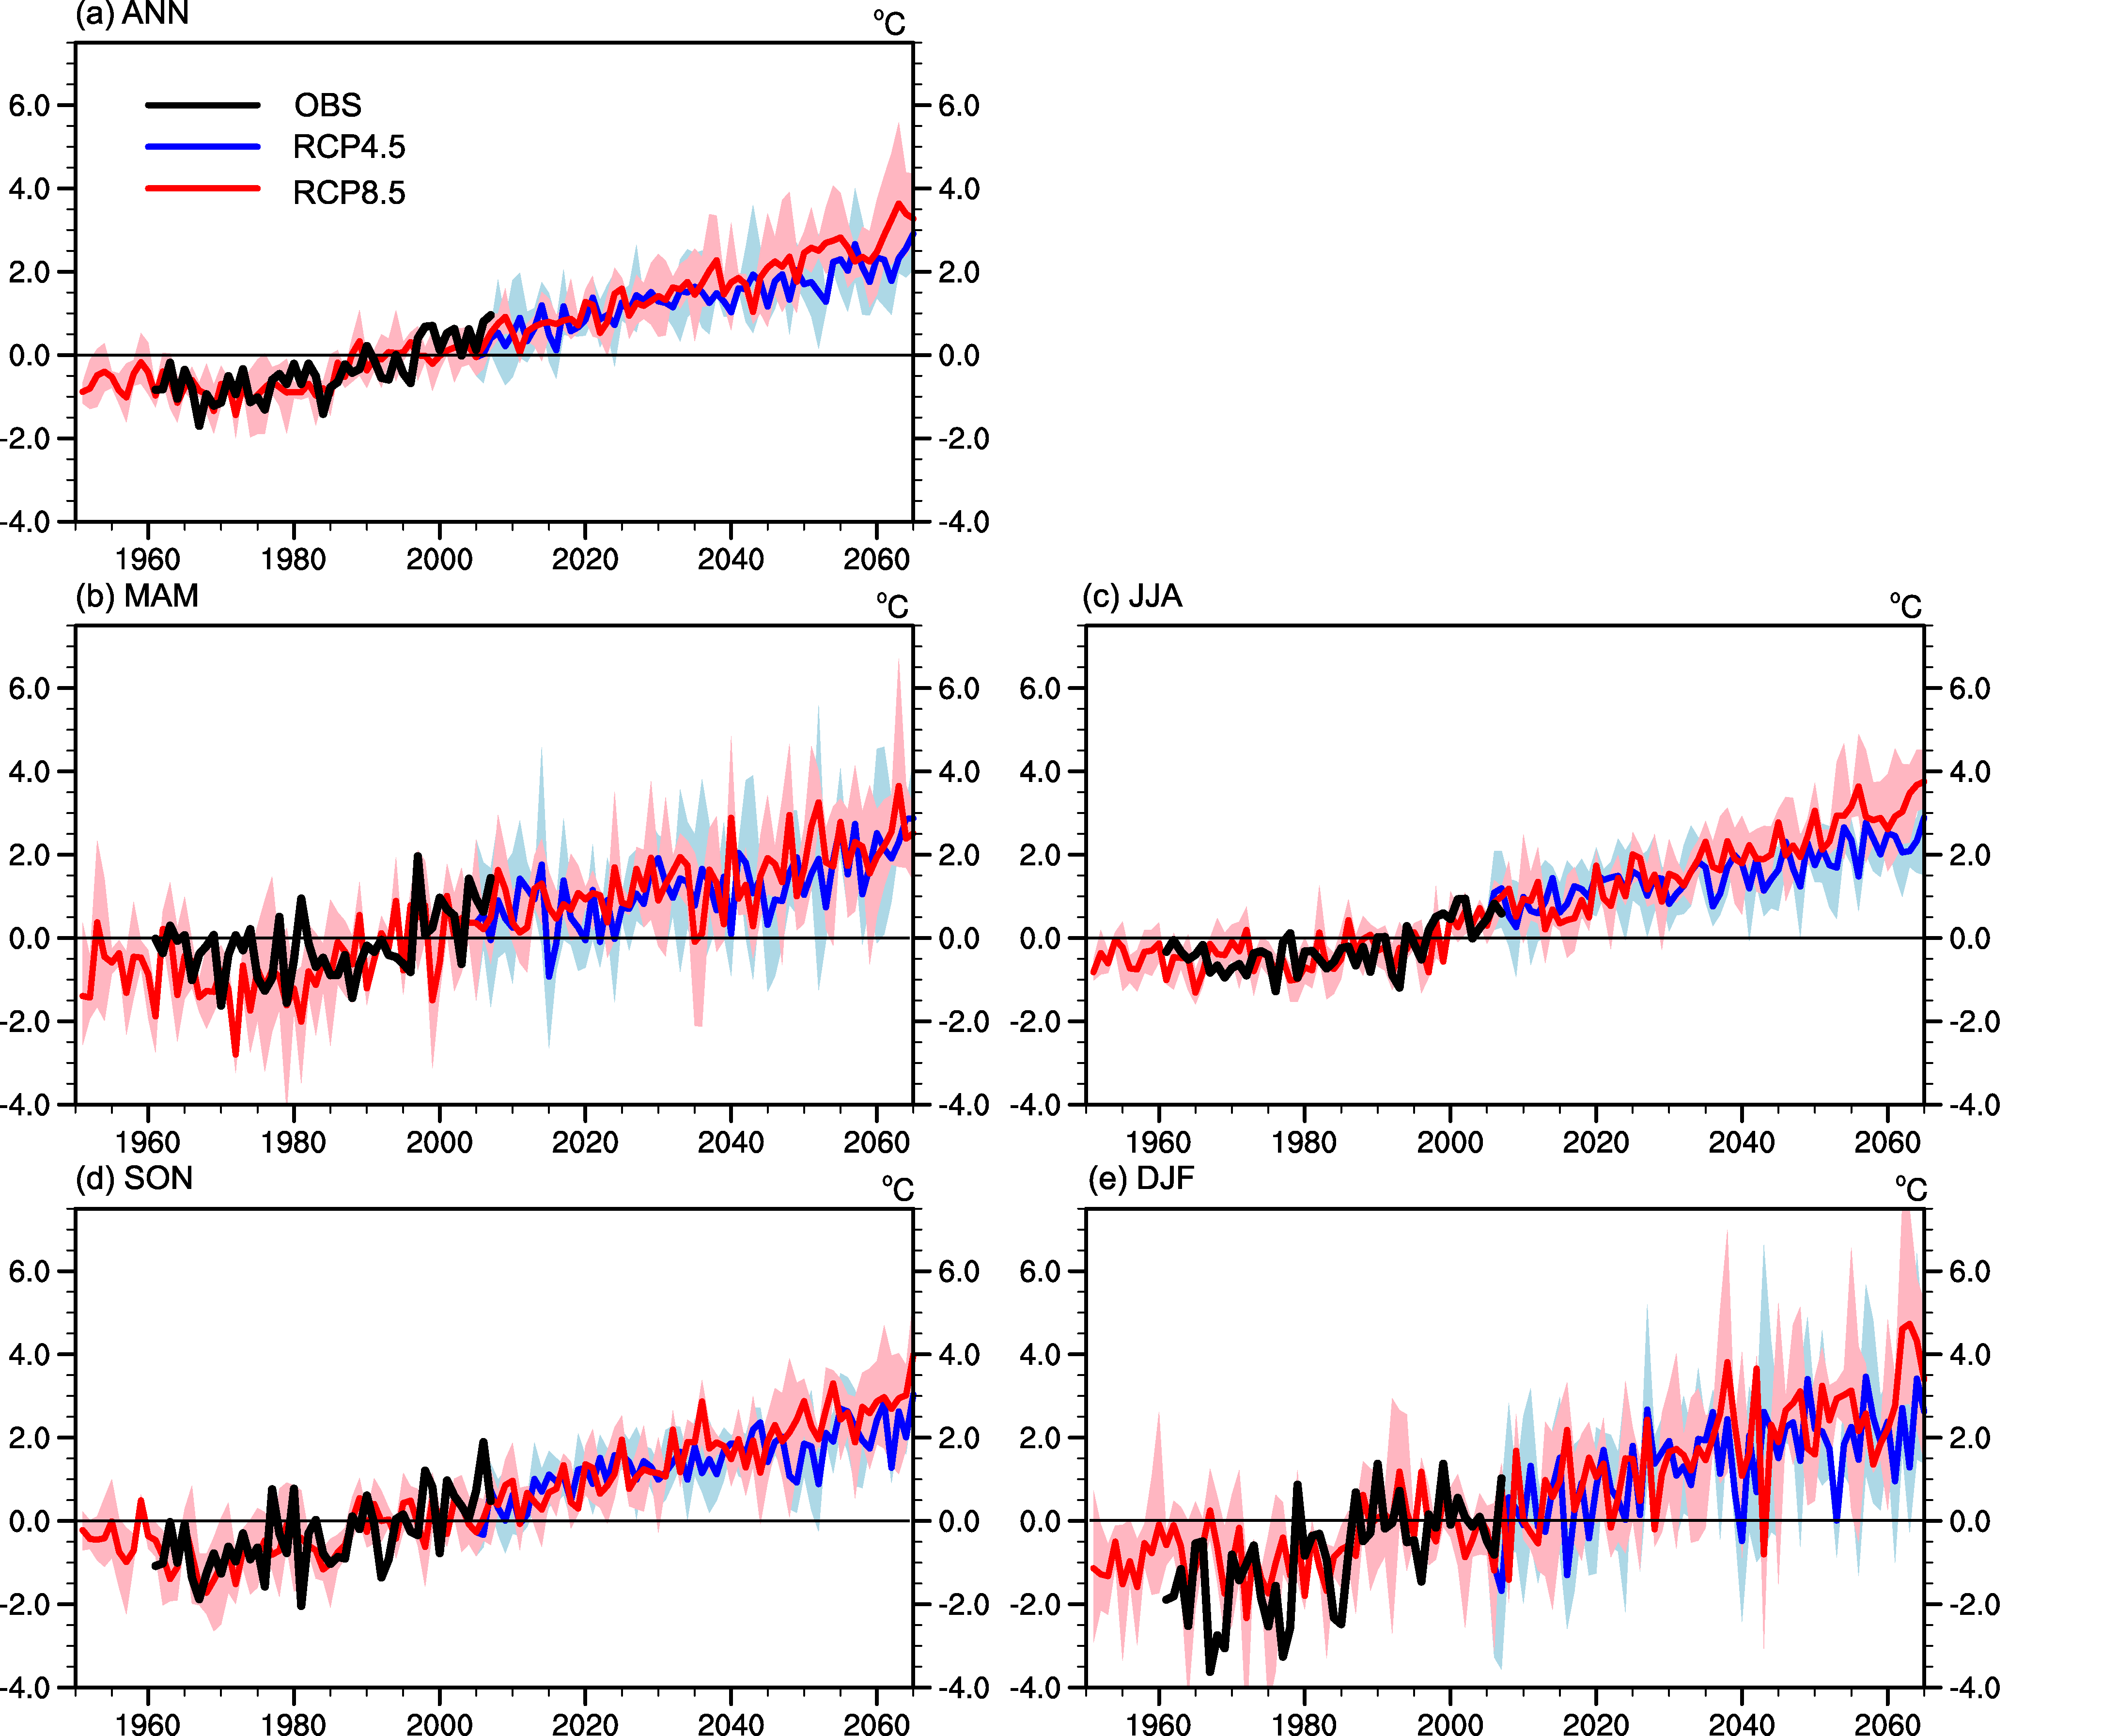 | Figure 5 (a) Annual and seasonal ((b) spring (MAM); (c) summer (JJA); (d) autumn (SON); (e) winter (DJF)) mean temperature averaged over the northwestern arid regions of China (NWAC). The solid line is the multimodel average; the black line is the observation; the blue/red lines are the RCP4.5/RCP8.5 scenarios; and the shading represents the range of the model simulation. Units: ° C. |
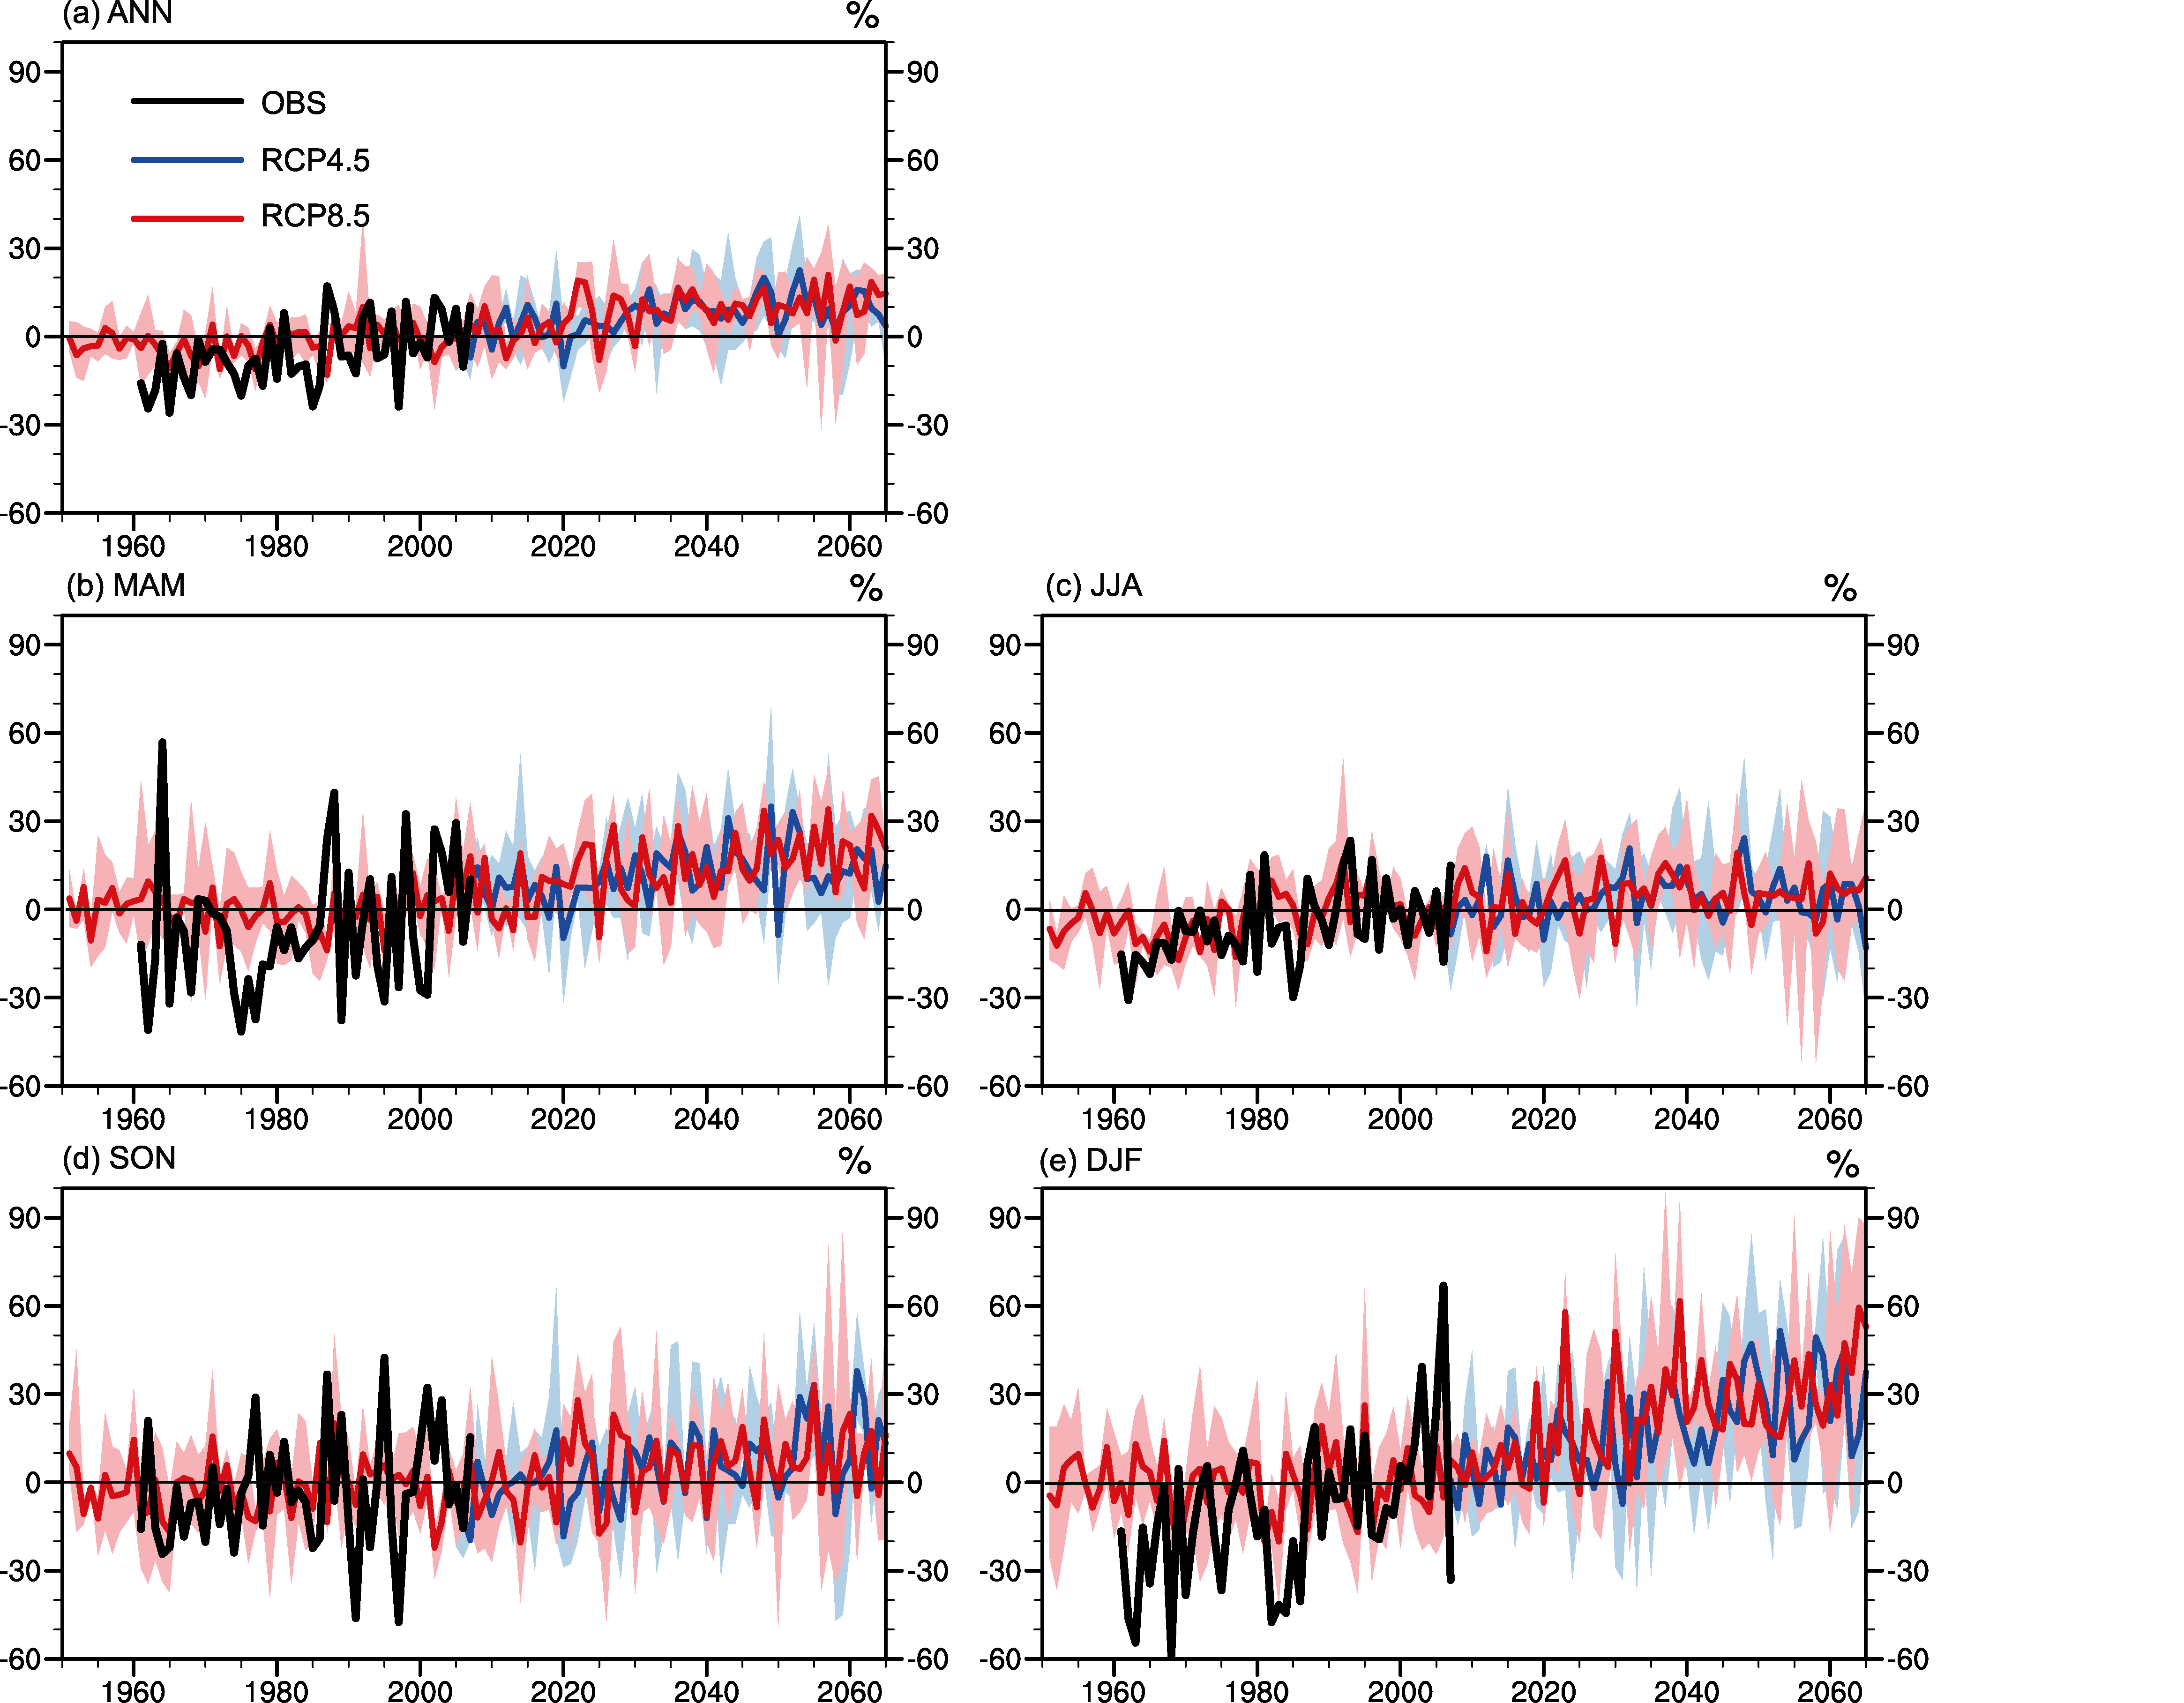 | Figure 6 (a) Annual and seasonal ((b) spring (MAM); (c) summer (JJA); (d) autumn (SON); (e) winter (DJF)) mean precipitation averaged over NWAC. The solid line is the multimodel average; the black line is the observation; the blue/red lines are the RCP4.5/RCP8.5 scenarios; and the shading represents the range of the model simulation. Units: %. |
The NWAC is especially sensitive to climate change due to its vulnerability; thus, assessing future climate change is highly meaningful for these regions. The present reported study analyzed the future temperature and precipitation change over NWAC after a complete evaluation of model performances against observational data. The findings provide new information on the climate change of NWAC, at higher resolution than can be provided by CMIP5.
The model validation showed that the multimodel simulations are able to capture the distribution of temperature and precipitation well, albeit with some biases. The seasonal variation and spatial heterogeneity of temperature and precipitation are reproduced well by the models.
Temperature is projected to increase over NWAC in the middle of the 21st century under the RCP4.5 and RCP8.5 scenarios, with the increasing trend being larger under the latter scenario. The two emissions scenarios share similar temperature change features, with the temperature increase being greater in the western part of NWAC, and the largest temperature increase occurring in the marginal regions of the Tarim Basin and Junggar Basin in winter. Precipitation mainly exhibits an increasing trend in the middle of the 21st century; however, there are also negative trends in the Tarim Basin and Junggar Basin in summer.
The regional averaged temperature exhibits a consistent warming trend, with a larger warming trend under RCP8.5 than RCP4.5. In the middle of the 21st century, temperatures are projected to increase by about 3° C-4° C. Precipitation is projected to increase under both emissions scenarios, and both also share a similar precipitation trend. In the middle of 21st century, precipitation is projected to increase by about 20%. The multimodel simulation indicated significantly large variation for temperature and precipitation in winter in the later decades of the middle of the 21st century, which may induce more extreme cold events and intense snowfall events over NWAC in the future.
| 1 |
|
| 2 |
|
| 3 |
|
| 4 |
|
| 5 |
|
| 6 |
|
| 7 |
|
| 8 |
|
| 9 |
|
| 10 |
|
| 11 |
|
| 12 |
|
| 13 |
|
| 14 |
|
| 15 |
|
| 16 |
|
| 17 |
|
| 18 |
|
| 19 |
|
| 20 |
|