Projection of PM2.5 and Ozone Concentration Changes over the Jing-Jin-Ji Region in China
[WU Jie1, 2 , XU Ying2, *  , ZHANG Bing
2, 3 ]
, ZHANG Bing|
|


Citation: Wu, J., Y. Xu, and B. Zhang, 2015: Projection of PM2.5 and ozone concentration changes over the Jing-Jin-Ji region in China, Atmos. Oceanic Sci. Lett., 8, 143-146.
doi:10.3878/AOSL20140102.
Received 30 December 2014; revised 21 January 2015; accepted 27 January 2015; published 16 May 2015
Based on GISS-E2-R model simulations, the changes in PM2.5 and ozone concentrations during 2016- 35 are analyzed over the Jing-Jin-Ji region under different future emissions scenarios: 2.6, 4.5, 6.0, 8.5 Representative Concentration Pathways scenarios (RCP2.6, RCP4.5, RCP6.0, and RCP8.5), compared to the baseline periods of 1851-70 (pre-industrial) and 1986-2005 (present day). The results show that PM2.5 increases under all emissions scenarios, with the maximum value occurring in the southeastern part of the region under most scenarios. As for ozone, its concentration is projected to increase during 2016-35 under all emissions scenarios, compared to the baseline periods. The temporal evolutions of PM2.5 and ozone show PM2.5 reaching a peak during 2020-40, while ozone will likely increase steadily in the future.
Air quality is currently a critical issue in China; and as one of the most intensely industrial regions of the world, the Jing-Jin-Ji region of China has been experiencing one of the highest air pollution threats (Chen et al., 2008). Among the many species of pollutants, many researchers have focused on studying fine particulate matter (PM2.5) and ozone, because these are the two pollutant types that most impact upon human health (Jacob and Winner, 2009), and can also make a crucial contribution to radiative forcing (Liao et al., 2006). With its soaring PM2.5 concentrations, eastern China has witnessed increasingly more haze days in the first decade of the 21st century (Wang et al., 2015), and the increased PM2.5 concentrations lead to poor visibility on roads. Ozone, on the other hand, is a kind of greenhouse gas, and superfluous ozone adversely affects the human respiratory system. The projection of these pollutants can help policymakers in their efforts to limit emissions; however, few studies have been conducted to project the possible future changes in these two important pollutants over the Jing-Jin-Ji region.
The Atmospheric Chemistry and Climate Model Intercomparison Project (ACCMIP) is a project that outputs a variety of data with the aim of documenting the changes of atmospheric pollution composition during 1850-2100 (Lamarque et al., 2013). Using the outputs of ACCMIP, air quality can be projected. For example, Young et al. (2013) analyzed 15 ACCMIP global models, and projected the tropospheric global ozone burden to decrease under most Representative Concentration Pathways (RCPs), except for RCP8.5, in 2030 and 2100, relative to 2000. Stevenson et al. (2013) found that some ACCMIP models show coherent ozone decreases in the tropical lower troposphere. Voulgarakis et al. (2013) found that hydroxide and methane show large uncertainties under different emissions scenarios. While a few models output PM2.5 and ozone concentration data directly, GISS-E2-R is a unique model in that it features data covering the full period between 1850 and 2100 (Shindell et al., 2013). Thus, we can obtain long-term information on the annual changes in PM2.5 and ozone concentrations by analyzing the output of the GISS-E2-R model.
Using the GISS-E2-R model’ s simulation in ACCMIP, the surface PM2.5 mass mixing ratio at 50% relative humidity and the total ozone column value were analyzed over the Jing-Jin-Ji region (36-43° N, 113-120° E). The resolution of GISS-E2-R is 90° (latitude) × 144° (longitude). The simulations include four emissions scenarios (RCP2.6, RCP4.5, RCP6.0, and RCP8.5), covering the period 1850-2100. The period 2016-35 was chosen to represent the near-term in the 21st century. To investigate the relative change of PM2.5 and ozone concentrations, the time periods of 1851-70 (representative of the “ pre-industrial” situation) and 1986-2005 (representative of the “ present-day” situation, following the Fifth Assessment Report of the Intergovernmental Panel on Climate Change) were chosen as the baseline periods.
The annual, winter-half-year (October-March), and summer-half-year (April-September) average PM2.5 and ozone concentrations over the Jing-Jin-Ji region during 1851-70, 1986-2005, and 2016-35 were separately calculated. Then, the anomalies in 2016-35, compared to the corresponding data in 1851-70 and 1986-2005, were determined.
Human activity had little effect on the air quality of the Jing-Jin-Ji region during the period of 1851-70. Therefore, comparing the PM2.5 and ozone concentrations during 2016-35 and 1851-70 will help us to understand the influence of human activity on the air pollution in this region.
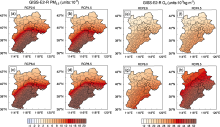
Figures 1a-d show the spatial distribution of annual PM2.5 and ozone anomalies under four different RCPs during 2016-35, compared to 1851-70. For PM2.5, increased concentration anomalies are apparent under all RCPs over the Jing-Jin-Ji region, especially in the middle and south of this area, demonstrating that PM2.5 concentrations during 2016-35 are likely to completely surpass the corresponding level during 1851-70. For example, the anomalies can reach approximately 2.0 × 10⁻⁸ in the southeastern part of Hebei Province. Moreover, although the distribution pattern of PM2.5 change under the four scenarios is similar, the area of the maximum value in RCP8.5 is greater than those in the other three RCPs. In the winter- and summer-half-years, increased PM2.5 concentration anomalies are also apparent under all RCPs over the Jing-Jin-Ji region, and the anomalies in the winter-half-year are greater than the corresponding anomalies in the summer-half-year under each RCP (figures omitted).
As for ozone, compared to 1851-70, the Jing-Jin-Ji region will be exposed to escalated anomalies during 2016-35. As shown in Figs. 1e-h, the spatial distribution of ozone anomalies under RCP2.6 and RCP4.5 is similar, with the maximum value (~2.0 × 10⁻⁴ kg m-2) occurring in the eastern part of the Jing-Jin-Ji region. Under RCP6.0, the central and southern part of this region is projected to experience higher level ozone anomalies than other areas. And under RCP8.5, the whole region will likely be exposed to the highest level ozone anomalies (> 4.0 × 10⁻⁴ kg m-2), as compared to the three other RCPs. Young et al. (2013) indicated that an almost doubling of methane and increased stratospheric exchange of ozone contribute to the increased ozone under RCP8.5. The increased ozone anomalies in the winter-half-year are less than the corresponding anomalies in the summer-half-year under each RCP (figures omitted).
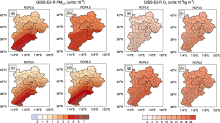
China experienced rapid industrial development during 1986-2005 and, as a consequence, a large amount of pollutants were discharged into the air. To evaluate the future pollution situation, we compare the PM2.5 and ozone concentrations during 2016-35 and 1986-2005. For PM2.5, shown in Figs. 2a-d, compared to 1986-2005, the PM2.5 concentration is projected to increase under all RCPs during 2016-35. Furthermore, the high-level area is expected to appear in the southeastern part of Jing-Jin-Ji region, with maximum values reaching ~7 × 10⁻⁹ under RCP2.6, RCP6.0, and RCP8.5. Although PM2.5 concentration anomalies are projected to increase during 2016-35 compared to both time periods (1851-70 and 1986-2005), the increment compared to 1851-70 is obviously greater than that compared to 1986-2005. This result demonstrates that the mean PM2.5 concentration during 1986-2005 is higher than the corresponding value during 1851-70. In the winter- and summer-half-year, increased PM2.5 concentration anomalies are also apparent under all RCPs over the Jing-Jin-Ji region, with the anomalies in winter being greater than the corresponding anomalies in summer under each scenario, especially over the southern part of Hebei Province under RCP8.5 (figures omitted).
 | Figure 1 Annual average (a-d) PM2.5 and (e-h) ozone concentration anomalies during 2016-35 over the Jing-Jin-Ji region under different Representative Concentration Pathway scenarios compared to 1851-70. |
 | Figure 2 Annual average (a-d) PM2.5 and (e-h) ozone concentration anomalies during 2016-35 over the Jing-Jin-Ji region under different RCP scenarios compared to 1986-2005. |
The ozone anomalies are projected to increase over most areas of the Jing-Jin-Ji region under all RCPs, as shown in Figs. 2e-h. Under RCP4.5 and RCP6.0, the southeastern part of the Jing-Jin-Ji region is expected to witness greater ozone concentrations than other regions. Because ozone concentrations largely depend on temperature (Tai et al., 2012), the temperature will likely rise over the Jing-Jin-Ji region under all scenarios, and there will be more ozone in this region. In summer, the ozone will increase by more over the Jing-Jin-Ji region than the increase in winter under RCP2.6 and RCP8.5; and under the other two RCPs, the anomalies in winter will be greater than those in summer (figures omitted).
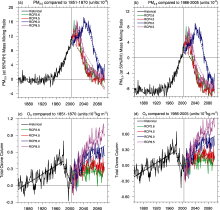
To investigate the long-term annual PM2.5 and ozone change trends, their spatial averages over the Jing-Jin-Ji region were calculated, as shown in Fig. 3. The PM2.5 concentration reaches a peak in around 2020 under RCP2.6, RCP4.5, and RCP8.5, but in around 2040 under RCP6.0. As we know, PM2.5 has various components, and typically consists of the following pollutants: black carbon (BC), organic carbon (OC), sulfate (SO4), nitrate (NO3), and ammonium (NH4). Lamarque et al. (2013) found that BC, OC, SO4, and NO3 reach their peaks in around 2020 under RCP2.6, RCP4.5, and RCP8.5; but under RCP6.0, these pollutants decrease after 2040. Moreover, the change trends of NH4 under all RCPs are similar. These results may explain the change of PM2.5 concentration under RCP6.0 being different from those under the other RCPs. Furthermore, the PM2.5 mean concentration during 1851-70 is lower than that during 1986-2005. The ozone concentration increases steadily during 1850-1980, but decreases during 1980-2005. Plus, it increases under all RCPs, with the greatest trend under RCP8.5, and the results of future ozone trends under most RCPs are different to the projections of Young et al. (2013). These differences may be the result of two factors: first, the different study regions— Young et al. (2013) projected the global ozone burden, while we focused on the Jing-Jin-Ji region; and second, Young et al. (2013) used 15 models in their projection, while we employed only one model, so our result may carry more uncertainty. Based on this result, it is essential to make policies to limit the ozone emissions over the Jing-Jin-Ji region in the future.
Compared to the periods 1851-70 and 1986-2005, PM2.5 concentration anomalies increase under all RCP scenarios over the Jing-Jin-Ji region during 2016-35, with maximum anomalies occurring over the southeastern part of this region under RCP8.5. In addition, again compared to 1851-70 and 1986-2005, ozone in the Jing-Jin-Ji region increases under all RCP scenarios during 2016-35. From the temporal evolution of these two pollutants, the PM2.5 concentration will likely decrease after 2040 under all RCPs, while ozone will steadily increase in the future.
 | Figure 3 The trends of (a, b) PM2.5 and (c, d) ozone concentration anomalies through spatial averaging compared to (a, c) 1851-70 and (b, d) 1986-2005. The dashed lines represent the different trends during each period of ascent/decent. |
It is important to note that this study only used the simulations from GISS-E2-R to project the long-term change in PM2.5 and ozone over the Jing-Jin-Ji region, because this model is the only one that outputs comprehensive PM2.5 and ozone data that directly cover the time period of 1850-2100. On the other hand, this global model’ s resolution is low. In future work, we need more model simulations to analyze the change in PM2.5 or ozone. Plus, high resolution results from regional climate models could help improve the reliability of projection.
| 1 |
|
| 2 |
|
| 3 |
|
| 4 |
|
| 5 |
|
| 6 |
|
| 7 |
|
| 8 |
|
| 9 |
|
| 10 |
|