Regional Climate Change and Uncertainty Analysis based on Four Regional Climate Model Simulations over China
[WU Jia1 , GAO Xue-Jie2, *  , XU Yin-Long
3 , PAN Jie3 ]
, XU Yin-Long|
|


Citation: Wu, J., X.-J. Gao, Y.-L. Xu, et al., 2015: Regional climate change and uncertainty analysis based on four regional climate model simulations over China, Atmos. Oceanic Sci. Lett., 8, 147-152.
doi:10.3878/AOSL20150013.
Received 15 January 2015; revised 26 January 2015; accepted 27 January 2015; published 16 May 2015Four sets of climate change simulations at grid spacing of 50 km were conducted over East Asia with two regional climate models driven at the lateral boundaries by two global models for the period 1981-2050. The focus of the study was on the ensemble projection of climate change in the mid-21st century (2031-50) over China. Validation of each simulation and the ensemble average showed good performances of the models overall, as well as advantages of the ensemble in reproducing present day (1981-2000) December-February (DJF), June-August (JJA), and annual (ANN) mean temperature and precipitation. Significant warming was projected for the mid-21st century, with larger values of temperature increase found in the northern part of China and in the cold seasons. The ensemble average changes of precipitation in DJF, JJA, and ANN were determined, and the uncertainties of the projected changes analyzed based on the consistencies of the simulations. It was concluded that the largest uncertainties in precipitation projection are in eastern China during the summer season (monsoon precipitation).
As is well known, atmosphere-ocean coupled general circulation models (AOGCMs) are the primary tool used for climate change simulations. The participation of dozens of institutes and models worldwide to conduct climate change simulations under the same framework, e.g., the Coupled Model Intercomparison Projects (CMIPs; Meehl et al., 2007; Taylor et al., 2012), make it possible for multi-model ensemble and uncertainty assessments in future climate change projections (Giorgi and Mearns, 2003; Zhou and Yu, 2006; Li and Zhou, 2010; Xu et al., 2010; Xu and Xu, 2012a, b; Collins et al., 2013). However, due to their coarse resolution, they usually show poor performance in reproducing present climate on the regional scale, in particular over East Asia and China where monsoon climate dominates. Previous studies have found that regional climate models (RCMs), with higher resolution, show more advantages in both simulating present climate and potentially providing more reliable future climate change projections over the region (e.g., Gao et al., 2001, 2006, 2008, 2012; Yu et al., 2010, 2014; Zou and Zhou, 2013).
One of the disadvantages of applying RCMs in regional climate change projection over East Asia is that, typically, only a few simulations are available. In addition, existing simulations are usually conducted independently, with different driving GCMs, domains, and resolutions, making it difficult for the model ensemble and intercomparison (e.g., Xu et al., 2006; Gao et al., 2011). Of the limited studies regarding multi-RCM simulations, Gao et al. (2012) reported the uncertainty in monsoon precipitation projection based on two sets of RCM experiments involving one RCM driven by two different AOGCMs. Recently, under the framework of the Coordinated Regional Climate Downscaling Experiment (CORDEX) (Giorgi et al., 2009), efforts have been devoted to the topic over the East Asian domain (e.g., Park et al., 2013).
The present paper reports upon a set of four RCM experiments involving two RCMs driven by two AOGCMs. Based on the four simulations, the projected ensemble average changes and uncertainty in the mid-21st century over China are analyzed.
Two RCMs were employed in the study: the Abdus Salam International Centre for Theoretical Physics (ICTP) RegCM Version 4.0 (Giorgi et al., 2012), and the PRECIS (Providing Regional Climates for Impacts Studies) regional climate modeling system developed by the Met office Hadley Center (Jones et al., 2004). The RegCM and PRECIS series of models have been used widely in China for climate change simulations (e.g., Gao et al., 2001, 2006, 2008, 2012; Xu et al., 2006; Zhang et al., 2006, 2007; Ji and Kang, 2013).
Two global models, ECHAM5_MPI-OM (Jungclaus et al., 2006), which is an atmospheric model ECHAM5 (the 5th generation of the Max Planck Institute for Meteorology atmospheric general circulation model) coupled to an MPI-OM (Max Planck Institute Ocean Model), and HadCM3-Q0 (the unperturbed model of Quantifying Uncertainties in Model Projections of the Hadley Centre Coupled Model version 3; Collins, 2001), were used to drive RegCM4.0 and PRECIS, respectively, and thus four RCM experiments were conducted, hereafter referred to as EdR, HdR, EdP, and HdP, respectively. The RCMs’ domains followed that of the CORDEX Phase I East Asia domain, which covered a large region of both East Asia and Southeast Asia with a horizontal resolution of 50 km (Giorgi et al., 2009). More details about the model configuration and validation can be found in Wu (2012). In the present paper, we focus on analyzing the Chinese part of the East Asian domain only.
The simulation period of the RCMs was 1981-2050, plus one year of spin-up time, with observed CO2 concentrations before and the mid-level scenario of SRES A1B concentrations (Intergovernmental Panel on Climate Change (IPCC), 2000) after 2000. SRES A1B is higher in atmospheric greenhouse gas concentrations than the present RCP4.5 scenario (Moss et al., 2010). The period of 1981-2000 was considered as the present day, 2031-50 as the mid-21st century, and the climate change as the difference between the two periods. The gridded daily observational dataset developed by Wu and Gao (2013) at the resolution of 0.5° × 0.5° (latitude × longitude) was used to validate the model performance. The model outputs were interpolated bi-linearly to this 0.5° × 0.5° grid size to facilitate the intercomparison. Using the same weighted average, the ensemble of the four simulations was analyzed. The same weighted average is a common approach in climate change projection studies (Meehl et al., 2007; Chen, 2013).
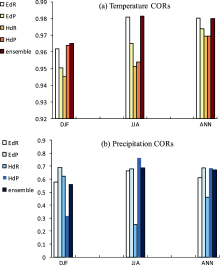
Following Zhou and Qian (1995) and Gao et al. (2012), the spatial correlation coefficients (CORs; Fig. 1) and standard departures (STDs; Table 1) between observations and simulations were used to validate the model performances. First, we analyzed the CORs between simulations (including the four simulations and ensemble average) and observations of December-February (DJF), June-August (JJA), and annual (ANN) mean temperature and precipitation (Fig. 1). The CORs between the ensemble average and observations were 0.96, 0.98, and 0.98, and the STDs were 2.8° C, 1.9° C, and 1.9° C for DJF, JJA, and ANN (Table 1), respectively. Compared to the best simulation (EdR), the ensemble average displayed higher correlation and relatively lower STD in the temperature simulations.
In the precipitation simulations, the CORs values for EdR and EdP were mostly in the range of 0.6-0.7. Meanwhile, there were large differences for HdR and HdP. For HdR, the CORs dropped from 0.62 in DJF to 0.25 in JJA; while for HdP, a lower COR of 0.32 in DJF and the largest COR of 0.76 in JJA were found. The poor performances of HdP/HdR in DJF/JJA were reflected by the STD values of 90.2 and 83.6 mm, respectively. Improvement of the ensemble average was not as significant as temperature, but could still be found regardless of the unusual behavior of the HadCM3-driven simulations.
 | Figure 1 Spatial correlation coefficients (CORs) between simulations (four simulations (EdR, EdP, HdR, and HdP) and the ensemble average (ensemble)) and observations in December-February (DJF), June-August (JJA), and annual (ANN) mean (a) temperature and (b) precipitation. |
| Table 1 Standard departures between simulations (four simulations (EdR, EdP, HdR, HdP) and the ensemble average (Ensemble)) and observations in December-February (DJF), June-August (JJA), and annual (ANN) mean temperature (° C)/precipitation (mm). |
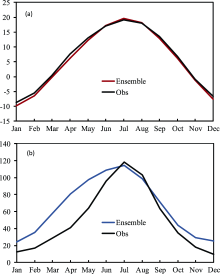
The annual cycle of regional mean temperature and precipitation from observations and the ensemble average are presented in Figs. 2a and 2b, respectively. As shown in Fig. 2a, the ensemble average showed good performance in reproducing the observed annual cycle of temperature, albeit with a general cold bias ranging between 0.5° C and 1° C in the winter half of the year, and a slight warm bias of about 0.2° C in JJA. The largest cold biases, exceeding 1.0° C, were found in January, February, and April, and the maximum warm bias of 0.5° C was found in August.
Observed precipitation showed a strong annual cycle, with a maximum of 119 mm in July in summer, and minimum values of 10 and 13 mm in December and January in winter. The differences between the ensemble average and observations were relatively small during June to October (between -5% and 25%), but could be large (twice as large) in DJF and March-May. Further analysis showed that the overestimation of precipitation was located mainly in the northern part of China (figure not shown for brevity).
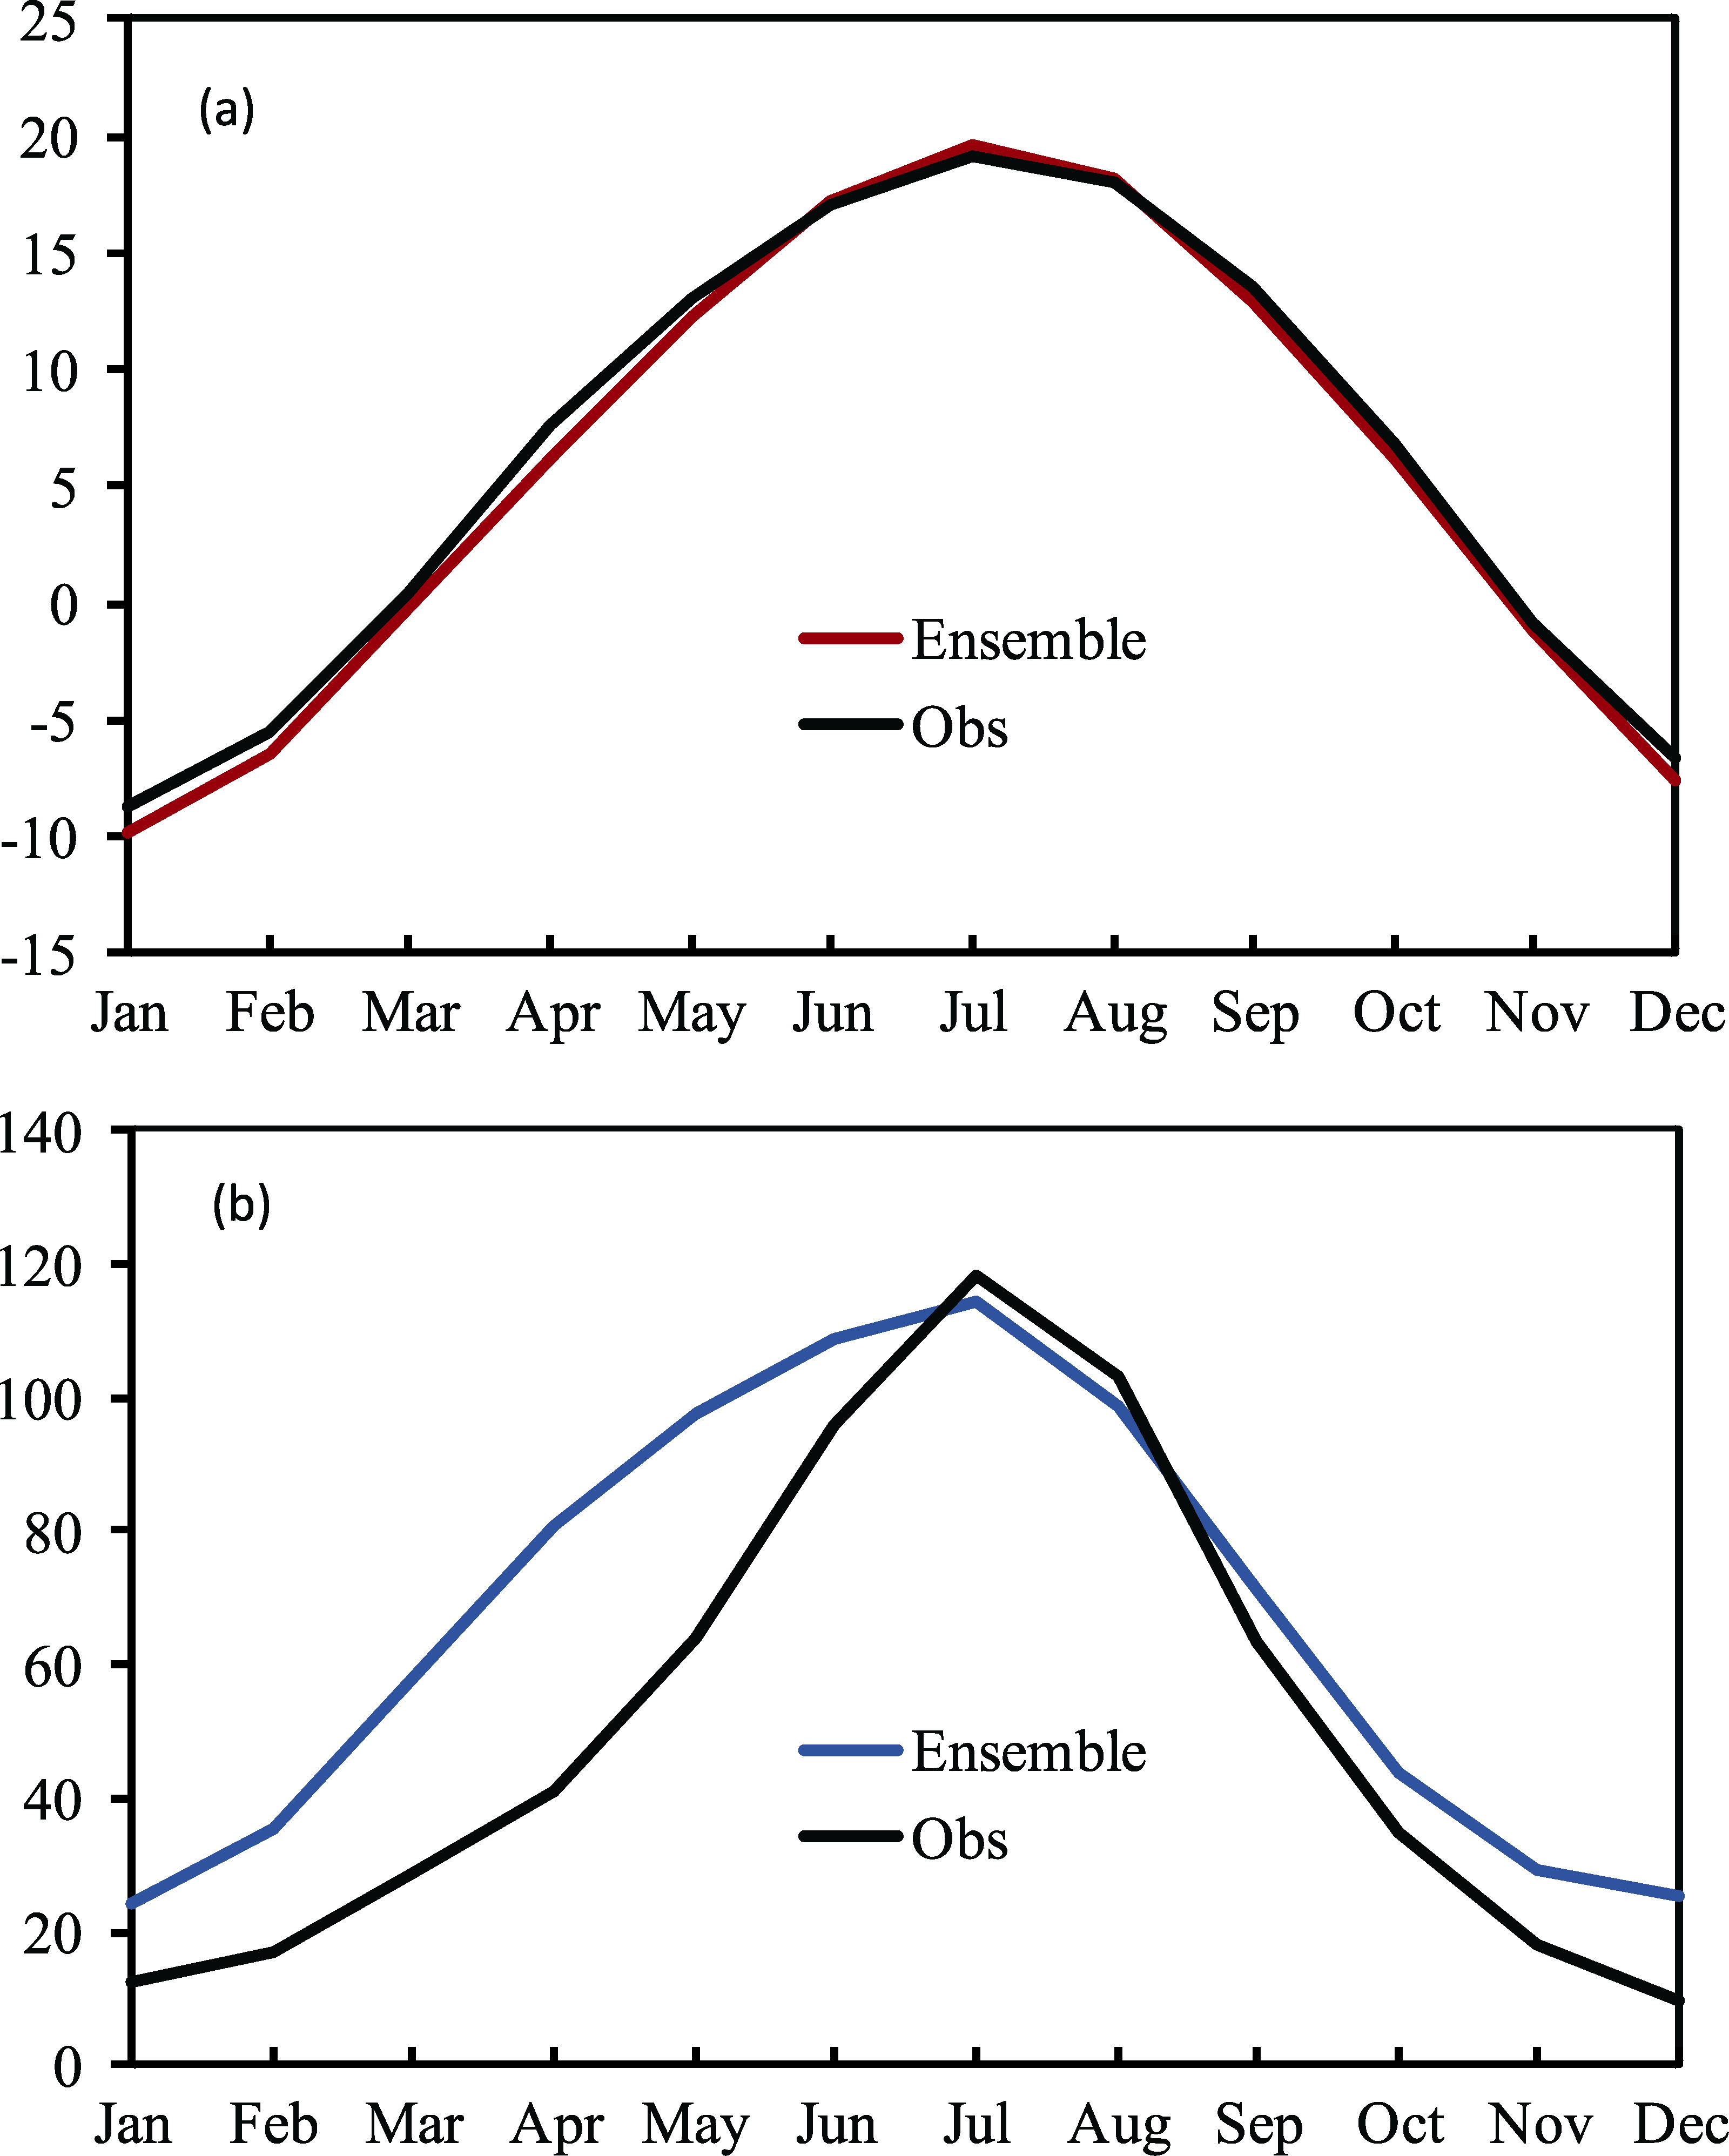 | Figure 2 Observed (solid black lines) and ensemble-averaged (dashed lines) annual cycle of 1981-2000 over China: (a) temperature (° C); (b) precipitation (mm). |
A general cold bias and overestimation of precipitation during the winter half of the year are typical climate model deficiencies over China, often found in both GCMs and RCMs (Jiang et al., 2005; Zhang et al., 2008; Xu et al., 2010; Gao et al., 2012; Flato et al., 2013). However, such biases can be partly attributed to the uncertainties in observational datasets (Ye et al., 2008; Xu et al., 2009; Li and Yan, 2010; Wu and Gao, 2013).
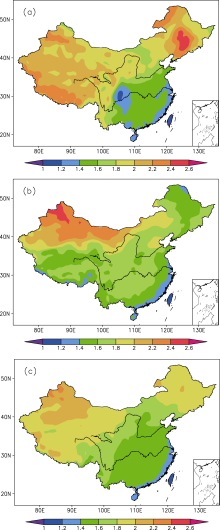
The simulated changes of DJF, JJA, and ANN temperature by the ensemble average in the mid-21st century are shown in Fig. 3. Substantial warming was found in DJF (Fig. 3a), and this warming was mainly less than 1.6° C in southern China but reached 1.8° C-2.2° C over most of northern China and the Tibetan Plateau. The maximum warming, exceeding 2.8° C, was simulated over Northeast China, while the minimum increase in temperature, of less than 1.4° C, was found over the Sichuan Basin and the eastern coast. The regional mean warming was 1.9° C.
Warming was also evident, but to a lesser extent and showing a different pattern, in JJA (Fig. 3b). Relatively lower values, in the range of 1.4° C-1.8° C in Northeast China and the Tibetan Plateau, were found compared to DJF. The warming was more significant in the area extending from northwestern China to the western part of Inner Mongolia, with values exceeding 2.0° C; while warming of 1.4° C-1.8° C was found elsewhere. Similar to DJF, minimum warming was simulated over southeastern coastal areas. The regional mean increase of temperature in JJA was 1.7° C.
General warming over the whole region was also found in ANN, ranging from 1.4° C to 2.2° C (Fig. 3c) and following the same spatial pattern as DJF. The largest value
 | Figure 3 Ensemble-projected changes (2031-2050 relative to 1981- 2000) in mean temperature (° C) in (a) DJF, (b) JJA, and (c) ANN. |
was located in the northwest (greater than 2.0° C) and portions of Northeast China and the Tibetan Plateau, and the regional mean warming was 1.8° C.
Further analysis showed consistent warming in all four simulations and over different seasons, with similar spatial distributions (figures not shown). Meanwhile, as found in previous RCM studies (e.g., Gao et al., 2012), disagreements in precipitation change signals among the simulations existed.
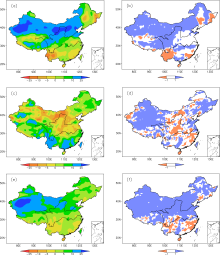
Figure 4 presents the ensemble average precipitation change and inter-model agreements of the changes among various simulations in DJF, JJA, and ANN. In DJF (Fig. 4a), a general increase in precipitation in the range of 10%-25% or more was found over the northern part of China, except the eastern part of the Northeast China and the northern part of the Tibetan Plateau. Less change was found elsewhere over the region, except a decrease in excess of 10% in Yunnan Province in Southwest China. Note that drought events have prevailed during winter in the area in recent years (Huang et al., 2012). As shown in Fig. 4b, the significant increases and decreases over the region were in general consistent among the simulations, with greater than 75% agreement (i.e., at least three out of the four simulations), except over the lower reaches of the Yellow River and Shandong Peninsular. The regional mean change in precipitation in DJF was an increase of 10%.
 | Figure 4 Ensemble-projected precipitation changes (2031-2050 relative to 1981-2000) (left panels, %) and inter-model agreements of the changes among various simulations (right panels; blue/red coloring indicates that more than 75% of simulations simulated an increase/decrease) in (a, b) DJF, (c, d) JJA, and (e, f) ANN. |
In JJA (Fig. 4c), an increase in precipitation dominated in Northeast China, south of the Yangtze River basins, Southwest China, and most of the Tibetan Plateau, while a decrease prevailed in Jianghuai, central China, and the middle reaches of the Yellow River. Areas with an increase larger than 10% included South China, Yunnan, some places in the eastern and northern parts of the Tibetan Plateau, and Northwest China. However, as shown in Fig. 4d, the model agreements showed more complex patterns than the change in averaged values. More specifically, consistencies of increase could only be found in eastern parts of Northeast China, Shandong Peninsula, northern parts of the Tibetan Plateau, and a few other places in the region. The model showed even less agreement in terms of the decrease. Note that in Northwest China, most simulations agreed with the increase (Fig. 4d); however, a precipitation increase over basins and a decrease over their surrounding mountains could be found in the mean (Fig. 4c), indicating one of the simulations exhibited much stronger topographic effects on the changes. The regional mean change of precipitation in JJA was 2.4%.
Figures 4e and 4f provide the ensemble average of the annual mean precipitation change and its consistency. The precipitation change in ANN showed more or less similar patterns as that in DJF (Fig. 4a), characterized by a wetter north and drier south. The area with the largest increase, of greater than 25%, was located in the Taklimakan Desert in Northwest China, and a slight decrease was found in the southwest and southeast coastal areas. The simulations were generally consistent with the above-mentioned changes, and the regional mean change was 7.3%.
In this study, we performed climate change simulations using two RCMs driven by two GCMs under the A1B emissions scenario over China. The models’ performances for present climate (1981-2000) were validated, and the ensemble changes of temperature and precipitation in the mid-21st century (2031-50), as well as the uncertainties as measured by the inter-model consistencies, were analyzed.
The results showed that both single simulations and the ensemble average could reproduce the seasonal and annual mean temperature well; and, to some extent, the precipitation also. Compared to single simulations, the ensemble average usually presented better ability. Large biases in precipitation simulation were sometimes found for both of the RCMs when driven by the same GCM, which emphasizes the importance of selecting the most appropriate driving global model.
For the mid-21st century, general warming was found over the whole region and in different seasons, as well as in the annual mean. The simulated patterns of warming showed some consistency among different seasons, with greater values at higher latitudes and in the cold seasons. As indicated by the inter-model agreements, changes in precipitation with less uncertainty included an increase in the northern part of the region in DJF and the annual mean, an increase in Northwest China in JJA, a decrease in Southwest China in DJF and the annual mean, and a decrease in Southeast China in the annual mean. These changes are more or less consistent with some previous findings, which adds confidence to the projection (e.g., Xu et al., 2010, Xu and Xu, 2012a, b; Collins et al., 2013; Gao et al., 2008, 2013; Jiang and Fu, 2012). Meanwhile, large uncertainties existed in other simulated changes; in particular, concerning JJA (monsoon) precipitation projection. In the future, to obtain more reliable information on climate change over the region, we need RCMs with improved performance and better selection of the driving GCM, as well as greater participation in internationally coordinated projects such as CORDEX.
| 1 |
|
| 2 |
|
| 3 |
|
| 4 |
|
| 5 |
|
| 6 |
|
| 7 |
|
| 8 |
|
| 9 |
|
| 10 |
|
| 11 |
|
| 12 |
|
| 13 |
|
| 14 |
|
| 15 |
|
| 16 |
|
| 17 |
|
| 18 |
|
| 19 |
|
| 20 |
|
| 21 |
|
| 22 |
|
| 23 |
|
| 24 |
|
| 25 |
|
| 26 |
|
| 27 |
|
| 28 |
|
| 29 |
|
| 30 |
|
| 31 |
|
| 32 |
|
| 33 |
|
| 34 |
|
| 35 |
|
| 36 |
|
| 37 |
|
| 38 |
|
| 39 |
|
| 40 |
|
| 41 |
|
| 42 |
|