


Interannual Climate Variability of the Past Millennium from Simulations
[YANG Kai-Qing1, 3  , JIANG Da-Bang
1, 2 ]
, JIANG Da-Bang|
|


Citation: Yang, K.-Q., and D.-B. Jiang, 2015: Interannual climate variability of the past millennium from simulations, Atmos. Oceanic Sci. Lett., 8, 160-165.
doi:10.3878/AOSL20140100.
Received 29 December 2014; revised 27 January 2015; accepted 3 February 2015; published 16 May 2015The interannual variability of global temperature and precipitation during the last millennium is analyzed using the results of ten coupled climate models participating in the Paleoclimate Modelling Intercomparison Project Phase 3. It is found that large temperature (precipitation) variability is most dominant at high latitudes (tropical monsoon regions), and the seasonal magnitudes are greater than the annual mean. Significant multi-decadal-scale changes exist throughout the whole period for the zonal mean of both temperature and precipitation variability, while their long-term trends are indistinctive. The volcanic forcings correlate well with the temperature variability at midlatitudes, indicating possible leading drivers for the interannual time scale climate change.
The earth’ s climate has undergone drastic changes in recent decades. Unprecedented large variability has brought huge influence on society and economy, which is attracting increasing attention in terms of distinguishing anthropogenic impacts from the background range of natural variability. Reproducing the past climate in key periods with state-of-the-art climate models and comparing the results with proxy-based reconstructions provides a feasible approach to understanding the remarkable climate change that has taken place and projecting the probable changes in the future.
The Paleoclimate Modelling Intercomparison Project Phase 3 (PMIP3) is an excellent platform for detecting past climate changes. Of all the experiments under the framework of PMIP3, the last millennium (hereafter LM) experiment spanning 850-1850 A.D. is the most recent transient simulation (Schmidt et al., 2012). It contains more adequate proxy data as well as modern instrumental observations compared to the other experiments for the distant past. Furthermore, its background climate covers two unique periods that have been broadly confirmed both in proxy-based (Juckes et al., 2007; Mann et al., 2009) and modeling (Shindell et al., 2003; Ferná ndez-Donado et al., 2013) studies: the Medieval Climate Anomaly (MCA), which is a pre-industrial warm period closest to the mean temperature of the 20th century, and the subsequent cold Little Ice Age (LIA). All of these factors make the LM a unique stage for improving our understanding of naturally and externally forced climate variability on varying time scales, as well as pinning down the characteristics and effects of anthropogenic climate change.
The boundary conditions for the LM experiment include orbital forcing, solar radiation, volcanic eruption, land use/land cover and greenhouse gases (Schmidt et al., 2012), of which the volcanic and solar forcing are considered the primary climate drivers. Based on a multiple regression method upon a collection of reconstructions, Hegerl et al. (2003) pointed out that, in the Northern Hemisphere, the low-frequency temperature variability is in good agreement with the volcanic forcing, while the relationship with solar forcing is weak. Furthermore, both high and low resolution combined proxies and model simulations indicate that the radiative forcing was chiefly responsible for decadal- to centennial-scale climate change in the past 2000 years (Moberg et al., 2005). On the other hand, utilizing an energy balanced climate model forced with separated boundary conditions, Crowley (2000) pointed out that about half of the pre-industrial temperature variability was generated from volcanic and solar forcings. Bertrand et al. (2002) performed 71 sensitivity experiments with the Louvain-la-Neuve two-dimensional sector averaged climate model, and indicated that the solar and volcanic forcings together explained the emergence of the MCA and LIA. Later, Shindell et al. (2003) and Ammann et al. (2007) emphasized the role of solar variations in modulating the long-term climate change in the LM by use of different models. However, all previous work has focused mainly on decadal- to centennial-scale climate changes. Little attention has been paid to the interannual variability of the LM, which we address in the present study.
The results of ten models that have performed the LM experiment under the framework of PMIP3 are analyzed, with the overlapping time span of 851-1849 A.D. considered. These models are driven by two alternative volcanic forcing datasets (Fig. 1a), namely Gao et al. (2008) and Crowley et al. (2008), both of which are derived from a large collection of well-dated ice core sulfate records from both polar regions. However, they differ in their methods of transferring the ice core concentrations to aerosol optical depth (AOD) and the classifications of the categories of the eruptions. Since these two datasets are in different measurements, we convert the Gao et al. (2008) sulfate aerosol loading to AOD with the recommended conversion factor of 1.5 × 10¹⁴ g. On the other hand, the total solar irradiance (TSI) forcings (Fig. 1b) applied in the models include Wang et al. (2005), Muscheler et al. (2007), Steinhilber et al. (2009), Delaygue and Bard (2009), and Vieira and Solanki (2009), all of which are generated from isotope-based proxies. Basic information about the models is listed in Table 1. Further details are available online at https://pmip3.lsce.ipsl.fr/. The Climate Research Unit (CRU) monthly temperature and precipitation datasets (Harris et al., 2014) are taken as the target observations.
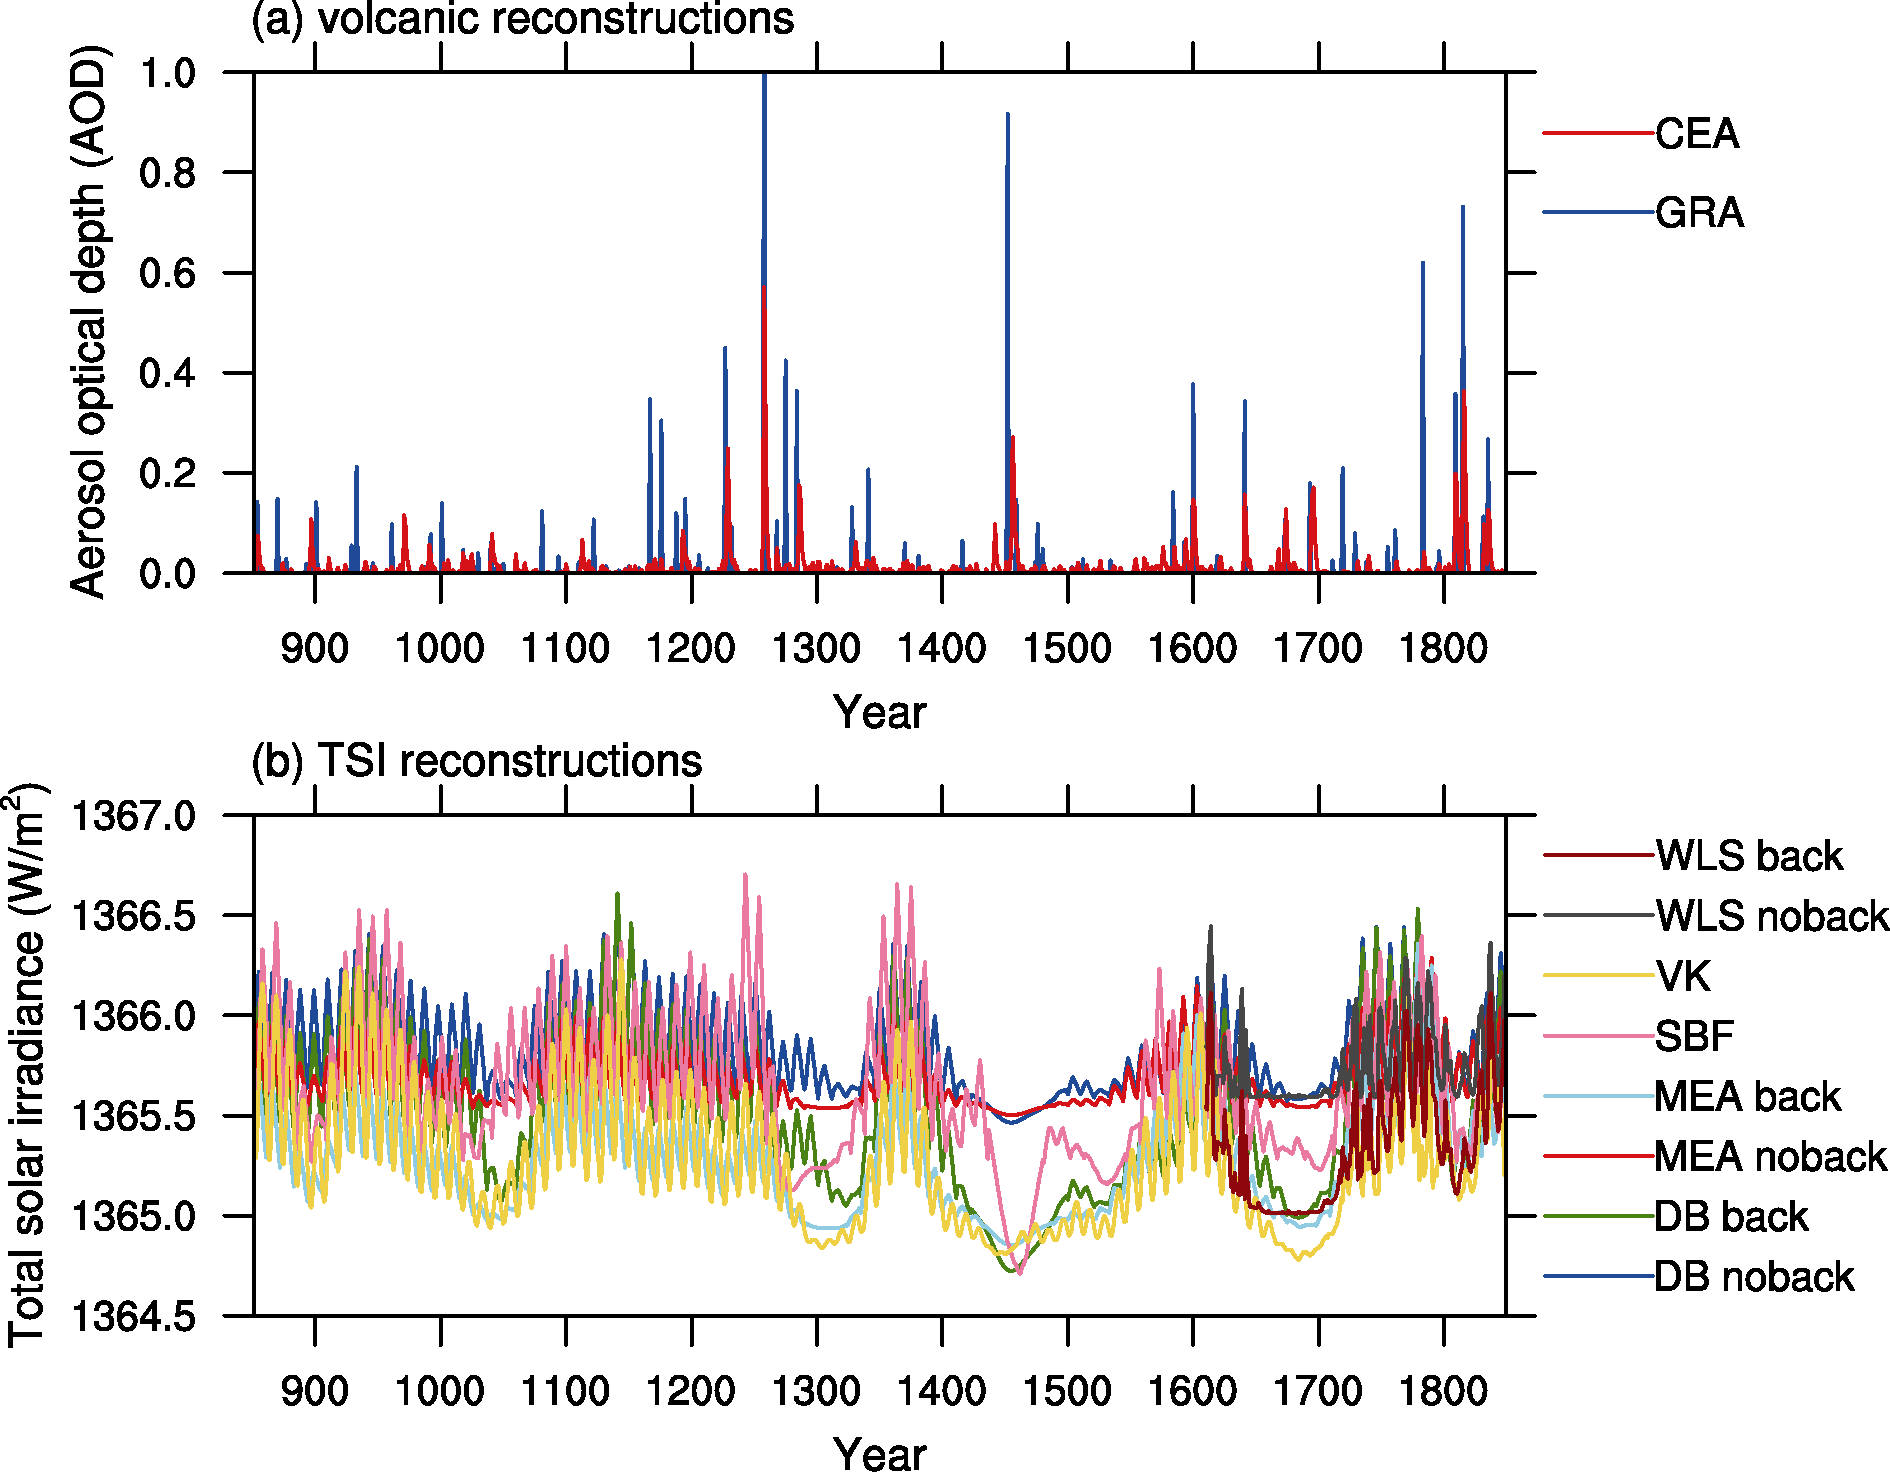 | Figure 1 Individual natural forcing reconstructions from 851-1849 A.D. (a) Two sets of volcanic reconstructions for Crowley et al. (2008) (red) and Gao et al. (2008) (blue) of aerosol optical depth (at 550 μ m), and (b) eight sets of solar reconstructions for Wang et al. (2005) with (brown) and without (gray) background variations, Vieira and Solanki (2009) (yellow), Steinhilber et al. (2009) (pink), Muscheler et al. (2007) with (cyan) and without (red) background variations, and Delaygue and Bard (2009) with (green) and without (blue) background variations of total solar irradiance. |
All model and observation data are first interpolated to a relatively mid-range horizontal resolution of 2.0° × 2.0° to enable further comparisons, and then linearly removed the long-term trends and decadally filtered by an 11-yr high-pass Butterworth filter to extract the interannual signals. On such a basis, we define the interannual variability as the interannual standard deviation of the residual data.
To evaluate the ability of the models in reproducing the climatology of interannual climate variability, spatial correlation coefficients, and root-mean-square errors of temperature and precipitation on land between each simulation and the CRU TS3.10 dataset for the period 1901- 2000 are calculated. For annual temperature (precipitation), the former varies from 0.73 to 0.89 (0.70 to 0.79), and the latter from 0.56 K to 0.85 K (0.62 mm d-1 to 0.74 mm d-1) across the models. Therefore, we consider the simulations of all models to be acceptable.
| Table 1 Details of the model simulations used in this study. |
For the whole period of 851-1849 A.D., the interannual variability of annual temperature varies from 0.09 K to 2.96 K for individual models and from 0.14 K to 1.35 K for the median of the ten models. All models simulate larger variability at high latitudes and relatively smaller variability at low latitudes. In general, the land has larger values than the ocean at the same latitude. Seasonally, the interannual variability is largest in winter, ranging from 0.08 K to 6.30 K for individual models and from 0.19 K to 3.48 K for the median of the ten models, and the smallest in spring, ranging from 0.12 K to 4.41 K for individual models and from 0.19 K to 2.46 K for the median of the ten models. Comparably, they are larger than the annual mean. Moreover, the latitude belt loading the maximum values moves southward in boreal summer (June-August) and northward in winter (December- January) with respect to that of the annual mean.
To depict the evolution of the interannual variability, an 11-yr moving standard deviation is calculated for the interannual temperature time series on each grid. It shows that the maximum variability for the median (individual models) is 1.9 K (4.9 K), with large variability at high latitudes and small variability at low latitudes. Furthermore, there is no discernible long-term trend for the global mean interannual temperature variability through the whole period. Based on the tight linkage between the temperature variability and latitude, we further examine the zonal mean of the interannual variability, and remove the temporal mean along latitudes (Fig. 2). The results show significant multi-decadal-scale changes in all models, particularly at high latitudes and in the tropics, though the range differs from model to model. Individual models have similar spatial patterns to the median of the ten models, but display generally larger magnitudes.
Besides the multi-decadal-scale change, some irregular peaks, mainly around the 1250s, 1450s, and 1810s, also stand out in Fig. 2. To understand these phenomena, we calculate the correlation coefficients between the zonal mean interannual temperature variability and the aerosol optical depth (AOD) and total solar irradiance (TSI) reconstructions (Fig. 2). It is clear that temperature variability matches well with the AOD. In general, the correlation coefficients are relatively large (small) in the mid-latitudes (high latitudes and the tropics), where the temperature variability is relatively small (large), and the maximum correlation coefficient reaches 0.23 for the median of the ten models and 0.46 for individual models. This indicates that in places where the interannual temperature change is small, the models tend to simulate an increased temperature variability response to strong eruptions, for example the 1258 Samalas and 1815 Tambora eruptions, in the following couple of years, whereas there is a slight response to volcanic eruptions in places where the interannual temperature change is large. In contrast, temperature variability displays little correlation with the TSI. There is no discernable relationship between the correlation coefficients and latitude, and the maximum correlation coefficient is only -0.07 for the median of the ten models and 0.24 for individual models. This superior correlation with the volcanic forcing compared to the TSI forcing is consistent with Schurer et al. (2014).
The interannual variability of annual precipitation is generally largest in the tropical monsoon regions and gradually decreases with increasing latitude, and the values over the oceans are larger than over land. The median estimate of the models is 0.01-1.81 mm d-1, which is smaller than the levels of individual models (0.01-2.82 mm d-1). On the seasonal scale, the geographical distributions are similar to the annual mean pattern, with an overall larger magnitude. The strongest variability occurs in winter, ranging from 0.01 to 7.90 mm d-1 for individual models and from 0.01 mm d-1 to 3.09 mm d-1 for the median of ten models; while the smallest occurs in spring, ranging from 0.01 mm d-1 to 5.54 mm d-1 for individual models and from 0.01 mm d-1 to 2.59 mm d-1 for the median of the ten models.
The 11-yr moving interannual variability of annual precipitation shows stronger changes in tropical monsoon regions, with a maximum value of 2.3 mm d-1 for the median of the models and 5.2 mm d-1 for individual models. Similar to temperature, the long-term trends of the global mean interannual precipitation variability is also insignificant. Figure 3 presents time-latitude plots of the zonally averaged interannual variability of annual precipitation for individual models and their median. The multi-decadal-scale change is distinctive, with the most remarkable variability bounded within 20° S-20° N. The median estimate of the models is of smaller magnitude than that of individual models, and the latitude range with strong variability is relatively narrower, covering 10° S-10° N only.
Compared to the temperature result, the precipitation change is less sensitive to external natural forcings. The maximum correlation coefficient between the interannual precipitation variability and the AOD is 0.05 and 0.16 for the median estimate and individual models respectively, and that of the TSI is 0.08 and 0.26 respectively. Only a few models simulate a large variability response to strong natural external forcings, and the estimated response of the model median is indistinctive.
This paper presents analyses of ten model simulations to investigate the interannual variability of temperature and precipitation during the LM and the possible causes. It is revealed that the interannual temperature and precipitation variability is generally larger at high latitudes and in tropical monsoon regions respectively, both with seasonal magnitudes larger than the annual levels. The zonal mean of interannual temperature and precipitation variability exhibits significant multi-decadal-scale changes, while the long-term trends are indistinctive. Temperature variability matches well with volcanic eruptions, with a maximum correlation coefficient of 0.23 (0.46) for the median estimate (individual models) at some latitudes, and the volcanic influence mainly concentrates in the midlatitudes where the temperature variability is small, indicating a possible driver for the interannual scale climate change.
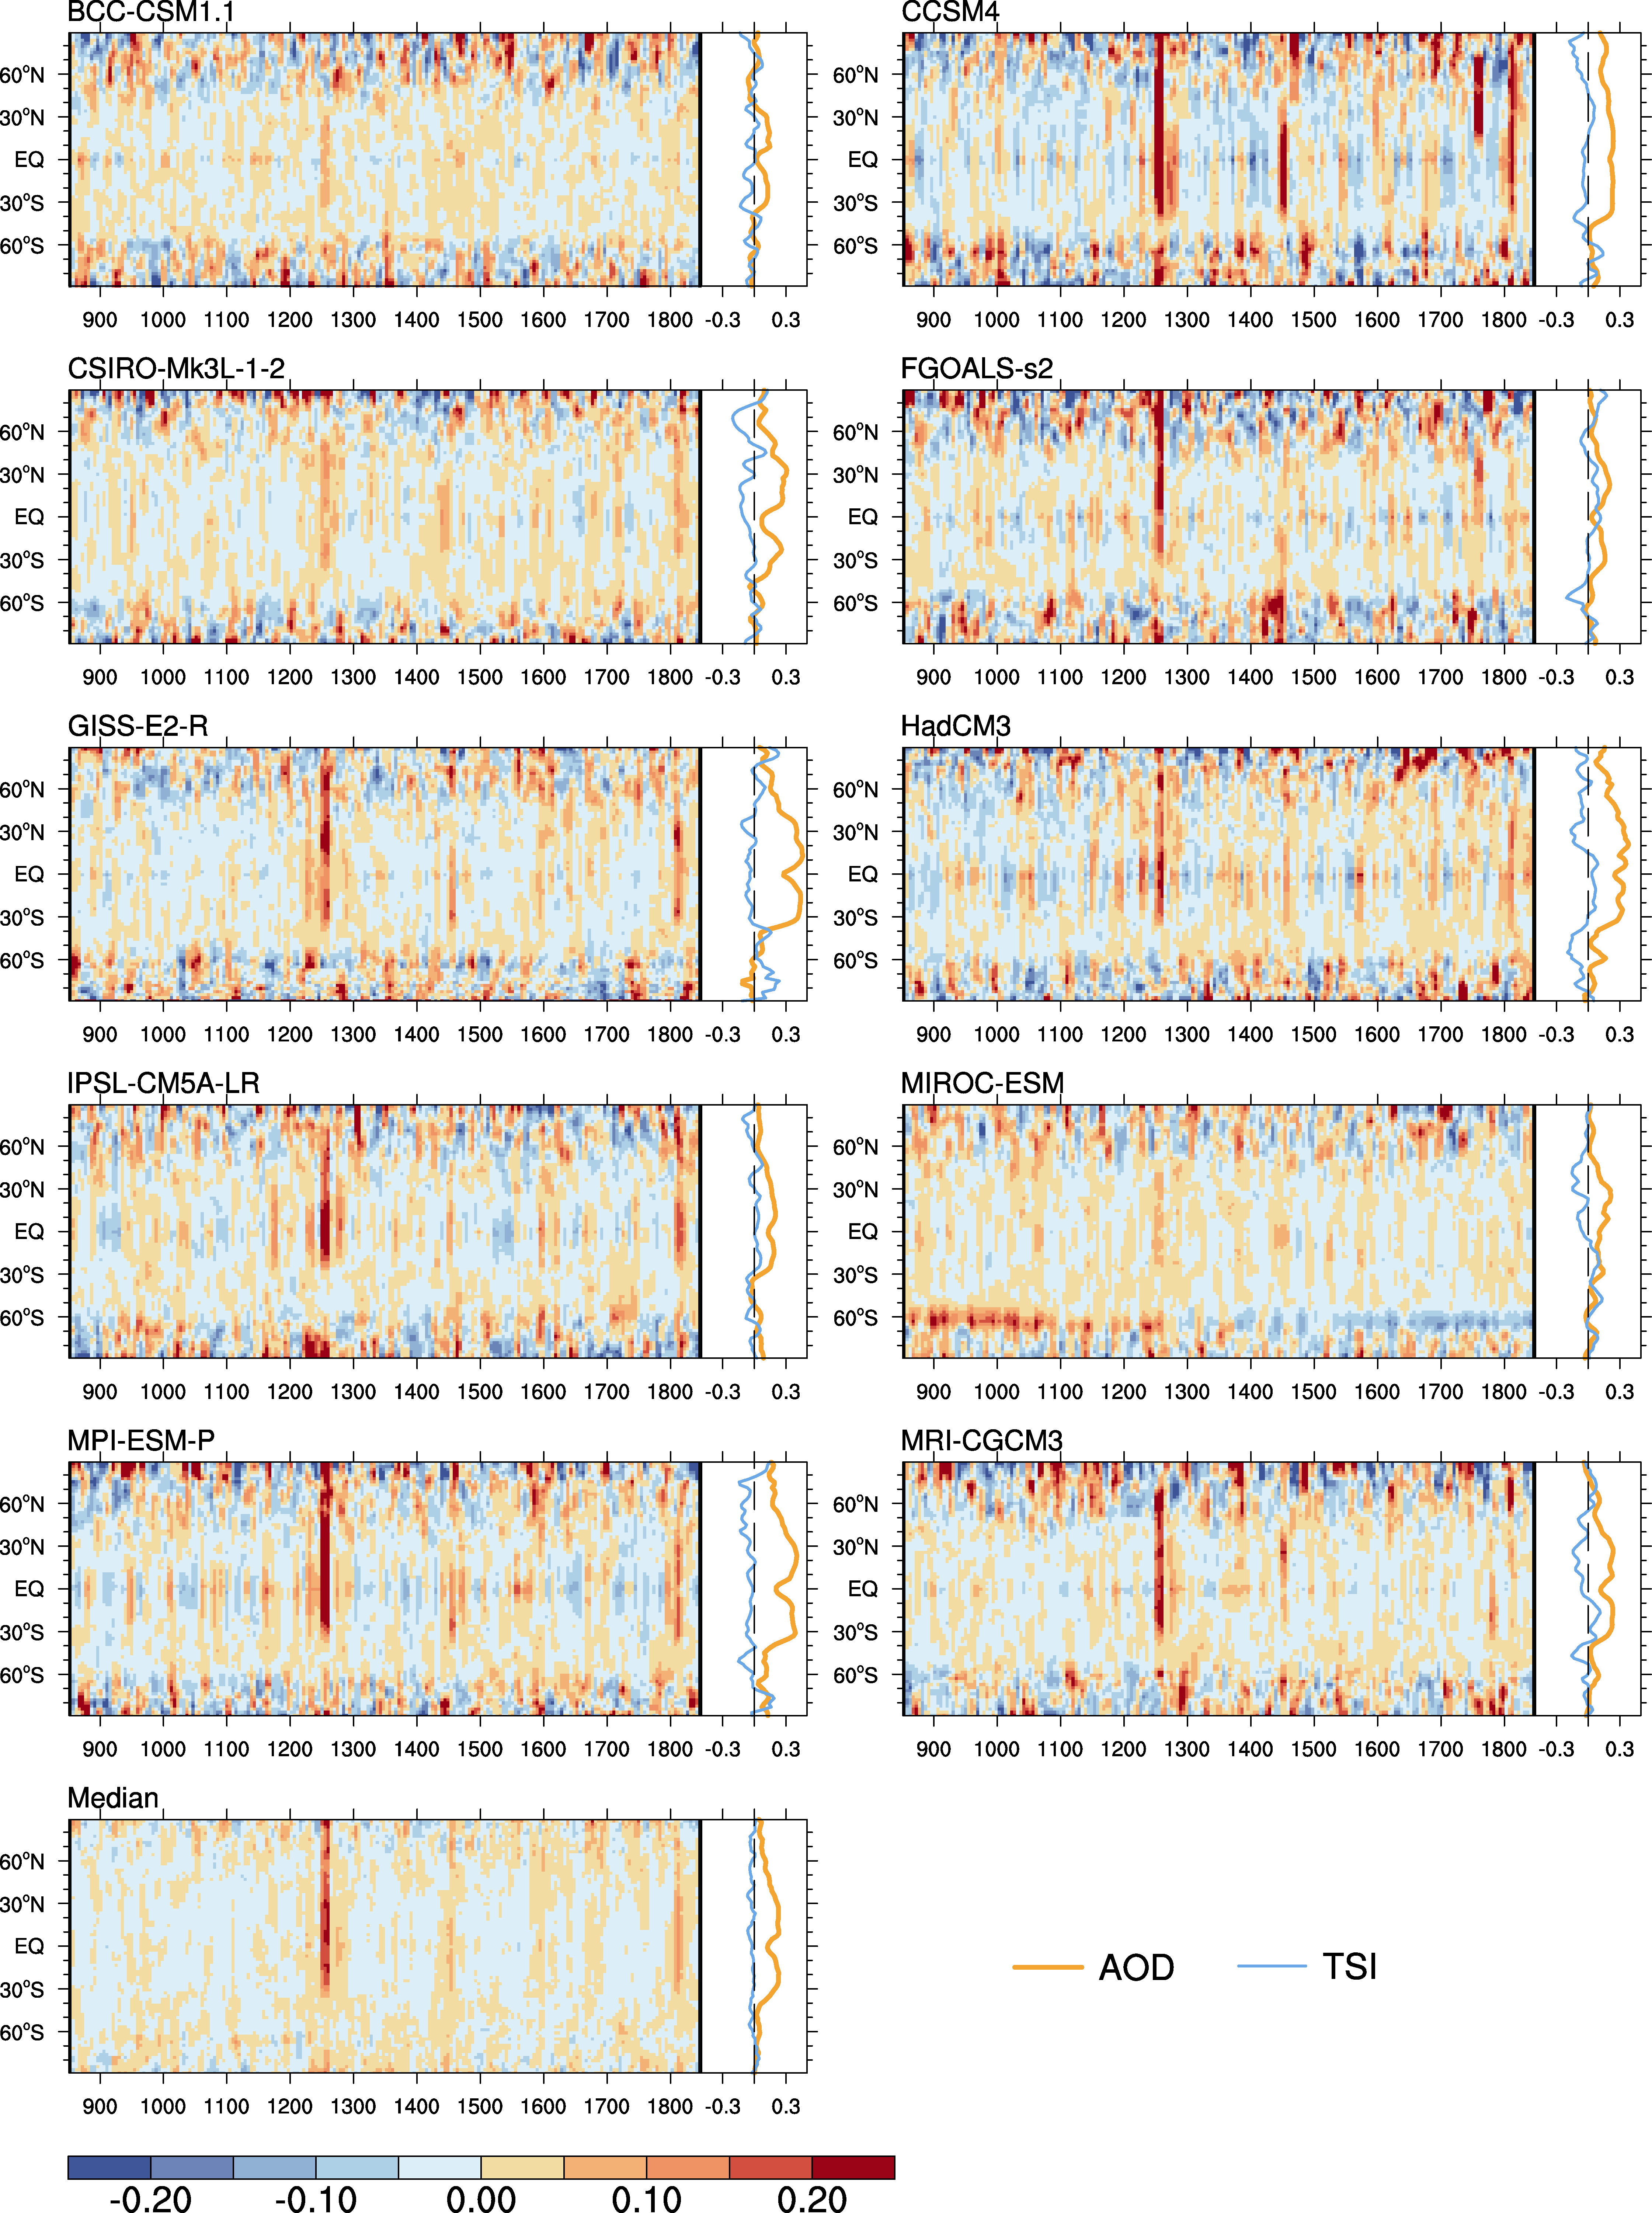 | Figure 2 Time-latitude plots of the zonally averaged interannual variability of the simulated annual temperature (units: K), with the temporal mean subtracted from each year along latitudes, and the correlation coefficients between the interannual variability and the corresponding aerosol optical depth and total solar irradiance reconstructions. |
 | Figure 3 Time-latitude plots of the zonally averaged interannual variability of the simulated annual precipitation (units: mm d-1), with the temporal mean subtracted from each year along latitudes, and the correlation coefficients between the interannual variability and the corresponding aerosol optical depth and total solar irradiance reconstructions. |
| 1 |
|
| 2 |
|
| 3 |
|
| 4 |
|
| 5 |
|
| 6 |
|
| 7 |
|
| 8 |
|
| 9 |
|
| 10 |
|
| 11 |
|
| 12 |
|
| 13 |
|
| 14 |
|
| 15 |
|
| 16 |
|
| 17 |
|
| 18 |
|
| 19 |
|
| 20 |
|