The Project Siberian High in CMIP5 Models
[LI Fei1  , GAO Yong-Qi
1, 2 ]
, GAO Yong-Qi|
|


The Siberian high (SH) experienced a decline from the 1970s to 1990s and a recovery in recent years. The evolution of the SH under global warming is unclear. In this study, 41 Coupled Model Intercomparison Project Phase 5 (CMIP5) climate models are evaluated in terms of their ability to simulate the temporal evolution of the SH in the 19th and 20th centuries and the spatial pattern of the SH during 1981-2005. The results show that 12 models can capture the temporal evolution of the SH center intensity (SHCI) for 1872-2005. The linear correlation coefficient between the SHCI from the Twentieth Century Reanalysis and the simulated SHCI from the multi-model ensemble (MME) of the 12 models is 0.3 on annual and inter-annual scales (above the 99% confidence level). On decadal and multi-decadal time scales, the MME also captures the pronounced reduction (between 1981-2000 and 1881-1900 period) and the recovery (during 1991-2005) of the SH intensity. Finally, the future evolution of the SH is investigated using the MME of the 12 models under the +4.5 and +8.5 W m-2 Representative Concentration Pathway (RCP) scenarios (RCP4.5 and RCP8.5). It is shown that the SHCI, similar to the SHCI in the 20th century, has no significant long-term trend in the 21st century under global warming (RCP8.5 scenario). At the end of 21st century (2081-2100), the SH shows stronger interannual variability than the SH at the end of 20th century (1981-2000). The increased interannual variability likely favors the increased interannual variability in winter air temperature over midlatitude Eurasia at the end of 21st century.
The Siberian high (SH) is a semi-permanent high pressure system in the boreal winter season. It is an extensive anticyclone over Asia and a shallow cold-core system confined to the lower troposphere (Lydolf, 1977). The SH accompanies the steady, near-surface northerlies in the front, which are dominant over some densely populated regions of Earth and is associated with cold-air outbreaks and snowfall. In fact, the SH can account for nearly one quarter of the interannual variability of winter temperature over East Asia (Gong and Ho, 2002) over the period 1949-97.
Previous climate modeling studies suggest that greenhouse warming is likely to weaken the SH (e.g., Gillett et al., 2003). Several observational-based studies also found a pronounced weakening of the SH during the last 20 years of the 20th century (20C) (Gong and Ho, 2002; Panagiotopoulos et al., 2005). However, Jeong et al. (2011) and Wu et al. (2011) revealed a recovery of the SH in recent years. They indicated that localized climate feedback, including changes in Eurasian snow cover and Arctic sea ice, might have contributed to the recovery.
Recently, Wei et al. (2014) found that Coupled Model Intercomparison Project Phase 5 (CMIP5; Taylor et al., 2012) models can capture the climatology of the East Asian winter monsoon, including surface air temperature and wind speed, the 500-hPa trough, and 200-hPa jet stream. Several studies have also examined the projected change in the East Asian winter monsoon in CMIP5 models (e.g., Jiang and Tian, 2013; Wang et al., 2013; Ogata et al., 2014). In this paper, we first evaluate model performances in reproducing the current climatological change of the SH using CMIP5 models, and then discuss the projected climatological response of the SH under the +4.5 and +8.5 W m-2 Representative Concentration Pathway (RCP) scenarios (RCP4.5 and RCP8.5).
Forty-one CMIP5 models are used in the present study. According to the availability of output data from the historical simulation, we select 12 models from different institutions and countries that show positive correlations between simulated and observed temporal evolutions of the SH over the period 1872-2005 (listed in Table 1). More details are available online at http://cmip-pcmdi.llnl. gov/cmip5/. We use sea level pressure (SLP) and near- surface air temperature (SAT) data from historical, RCP4.5 and RCP8.5 simulations, and snow area fraction and sea ice area fraction data from the historical simulation, using only the first ensemble member for each model (for EC-EARTH, experiments with ensemble member 6 are used as in Woollings et al. (2014)). In this study, past and current climatologies are defined as the mean of 1881- 1900 (P1) and 1981-2000 (P2) respectively, derived from the historical run, and the future climatology as the mean of 2081-2100 (P3) from the RCP4.5 and RCP8.5 scenario simulations. In addition, the European Centre for Medium- Range Weather Forecasts Interim Reanalysis ERA-Interim, 1979-2014; Simmons et al., 2006) and 20C Reanalysis, version 2 1871-2013; Compo et al., 2011) datasets are used as observational reference.
| Table 1 List of Coupled Model Intercomparison Project Phase 5 (CMIP5) models used in this study and the linear correlation coefficients (Corr.) between the Siberian high center intensity (SHCI) from 20C Reanalysis and the simulated SHCI for 1872-2005. |
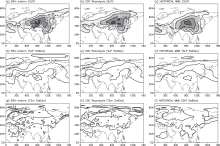
Figure 1 illustrates the climatology of SLP and standard deviation for SLP and SAT in winter (December- February) over Eurasia, derived from the ERA-Interim, 20C Reanalysis datasets and CMIP5 historical simulations during 1981 to 2000. It should be noted that the results from ERA-Interim and 20C Reanalysis are highly correlated, with spatial correlation coefficients ranging from 0.74 to 0.995. As shown in Figs. 1a and 1b, the SH is centered over the interior continent and covers almost the whole of Asia over mid-high latitudes. The magnitude and position of the SH are well simulated by the historical multi-model ensemble (MME) (Fig. 1c). The spatial correlation coefficients between ERA-Interim (20C Reanalysis) and the historical MME are 0.96 (0.93) over the period 1981-2000.
 | Figure 1 Climatology for (a-c) sea level pressure (SLP) (units: hPa), (d-f) standard deviation for SLP (units: hPa), and (g-i) near-surface air temperature (SAT) (units: ° C) in winter, derived from (a, d, g) European Centre for Medium-Range Weather Forecasts Interim Reanalysis (ERA-Interim), (b, e, h) 20C Reanalysis, and (c, f, i) Coupled Model Intercomparison Project Phase 5 (CMIP5) historical simulations during 1981-2000. In (a-c), only pressures exceeding 1020 hPa are shown. |
The intensity of the interannual variability during 1981-2000 can be described by the standard deviation. The standard deviation for SLP is largest over northern Eurasia by about 4.5 hPa (Figs. 1d and 1e), and for SAT shows high values over midlatitude Eurasia at 2.4° C (Figs. 1g and 1h). The historical MME can produce the spatial patterns of the standard deviation. The spatial correlation coefficients for SLP and SAT between ERA-Interim (20C Reanalysis) and the historical MME are 0.97 (0.97) and 0.84 (0.7) respectively, while underestimating the magnitude (only one-third of the observation). For example, the magnitude of the standard deviation for SLP over Japan is 1.5 hPa in the observations (Figs. 1d and 1e), while it is 0.5 hPa in the historical MME (Fig. 1f).
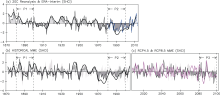
The normalized and 9-yr running mean of winter SHCIs (defined by the regional mean SLP averaged over (40-60° N, 70-120° E), as in Gong et al. (2001)), derived from 20C Reanalysis for 1872-2012/ERA-Interim for 1980-2014 and historical simulations for 1872-2005, are shown in Figs. 2a and 2b respectively. The winter of 1872 refers to the 1871/72 winter, and so on. The SHCI in 20C Reanalysis shows interannual to interdecadal variations with strong SHCI during 1872-1900 and 1917-70, and weak SH during 1901-16 and 1971-2004 (Fig. 2a). A pronounced reduction during the 1981-2000 period is also present in ERA-Interim. In addition, the SHCI records show a recovery in recent years, consistent with Jeong et al. (2011) and Wu et al. (2011). The SHCI in the MME shows similar variations on multidecadal scales, including a strong SH during 1881-1900 (P1) and a weak SH during 1981-2000 (P2) (Fig. 2b). The linear correlation coefficient between the SHCI from 20C Reanalysis and the simulated SHCI from the historical MME for 1872-2005 (with trend) is 0.33. When the linear trends are removed (detrended), the correlation coefficient on interannual scale is 0.3 (above the 99% confidence level). In addition, the correlation coefficient between the high frequency (lower than 10 years) part of the SHCI from 20C Reanalysis and that of the simulated one is 0.28, which is still significant at the 99% confidence level. It should be noted that there is no significant linear trend in the temporal evolution of SH intensity over the past 140 years in both the 20C reanalysis and the CMIP5 historical simulations.
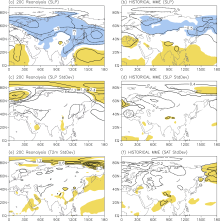
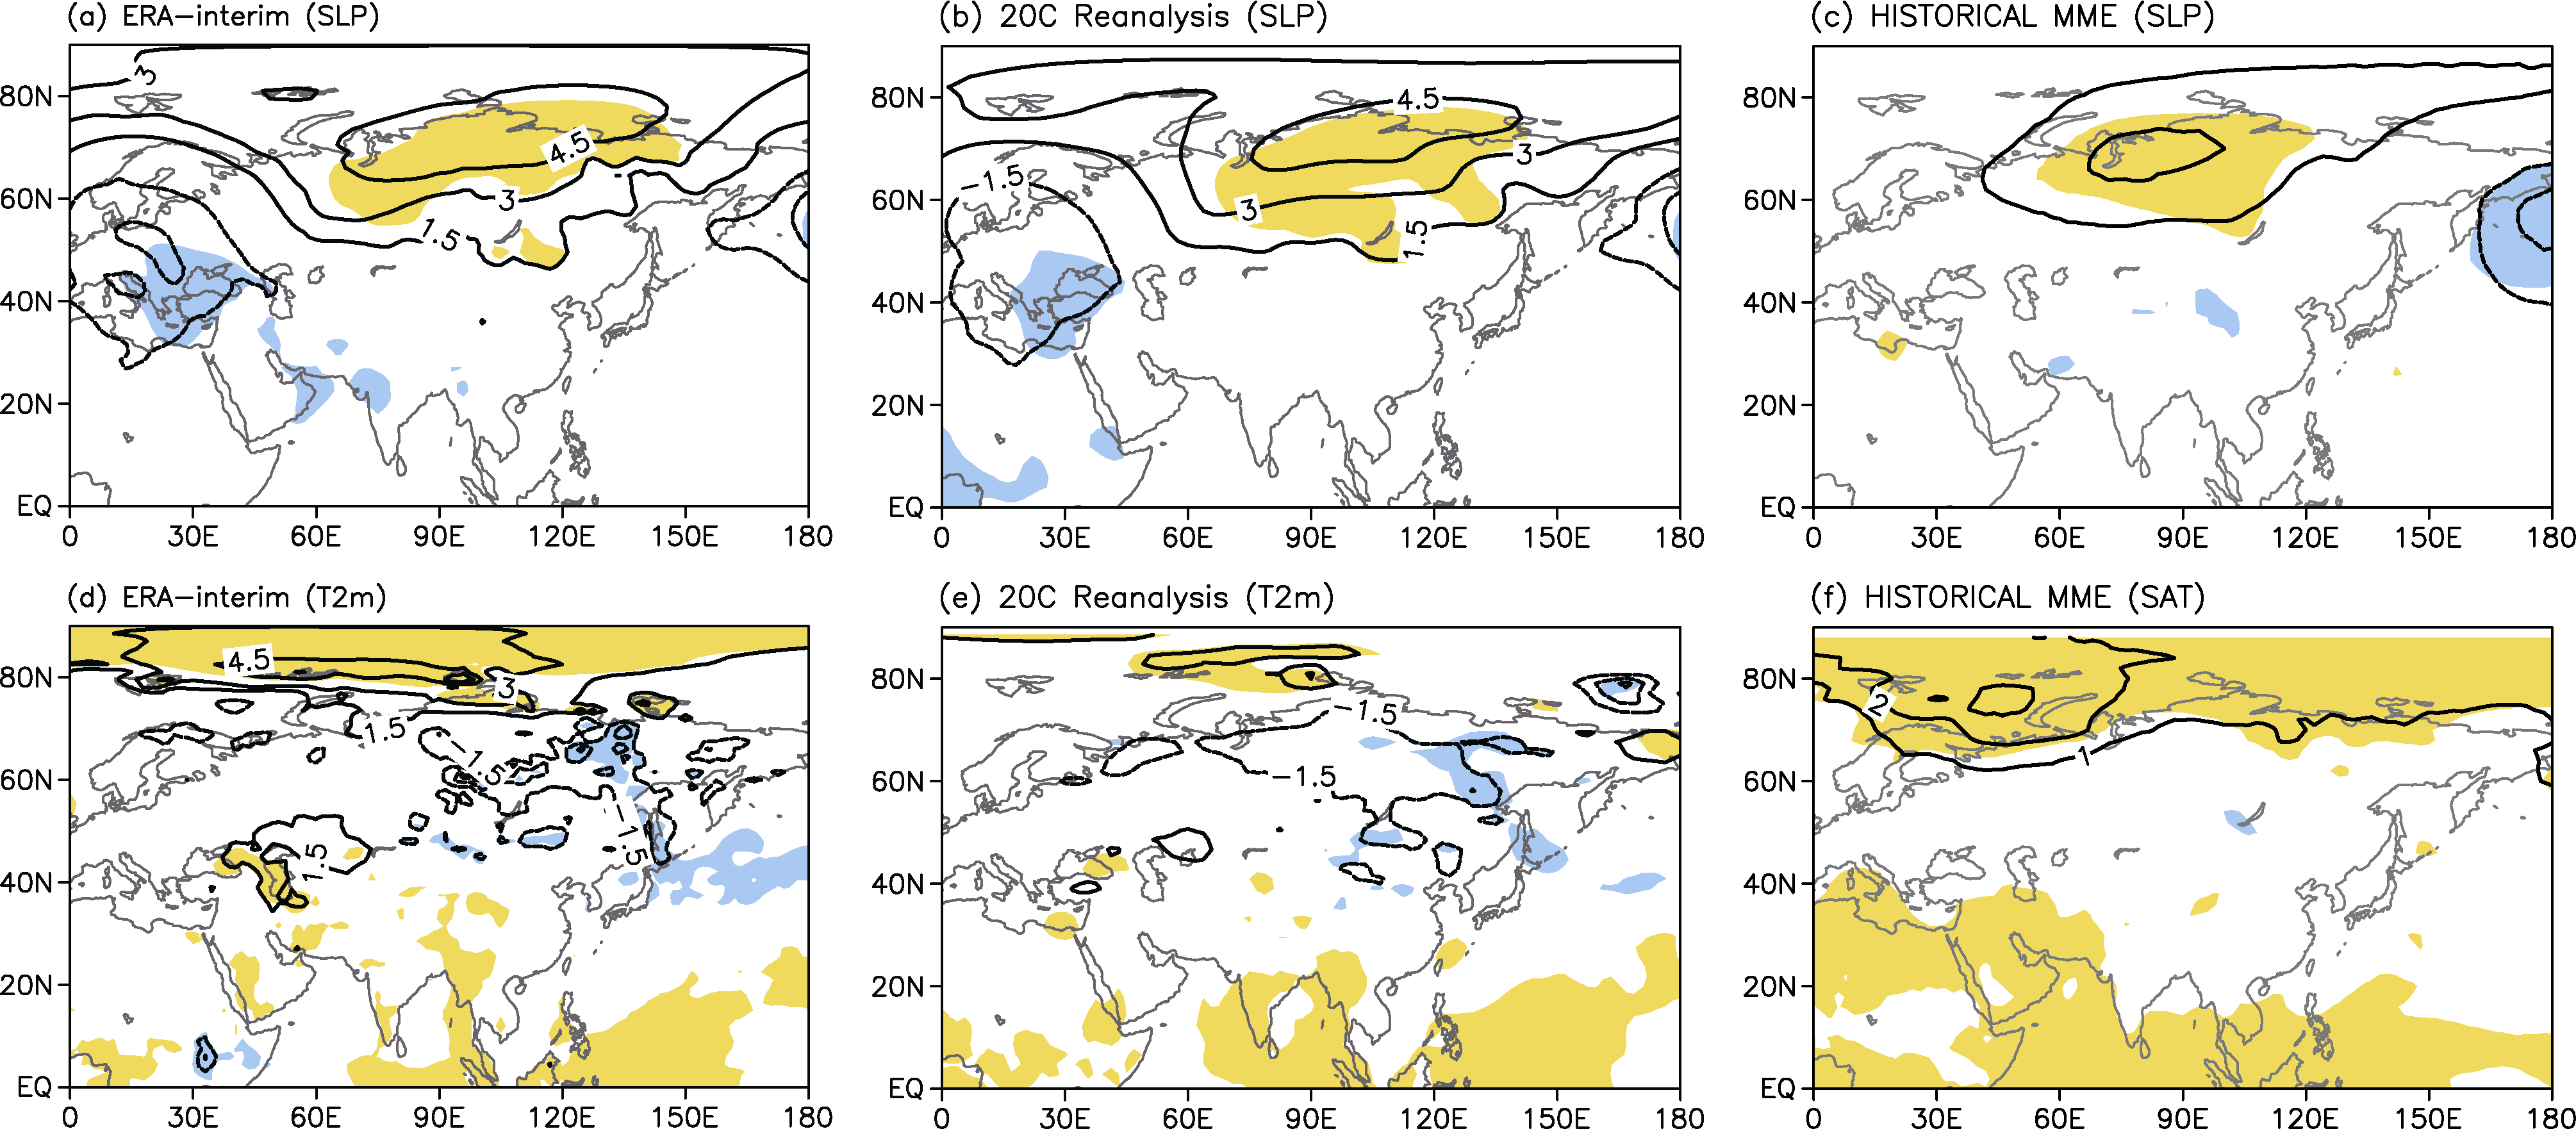
Figure 3 illustrates the differences of winter climatology for the SLP and standard deviation of SLP and SAT between the periods of 1981-2000 and 1881-1900, as derived from 20C Reanalysis and historical simulations. As shown in Fig. 3a, there are evident shifts in the large-scale SLP between the two periods. The SLP significantly decreases over almost the entire region of Eurasia by about 3 hPa, consistent with earlier studies (e.g., Panagiotopoulos et al., 2005). The historical MME reproduces the current weakening in the SH at as much as 1 hPa (only one-third of the observation) (Fig. 3b). The spatial correlation coefficient between 20C Reanalysis and the historical MME is 0.69. Figures 3c and 3e depict the largest values of the standard deviation in the Arctic region. As shown in Fig. 3d, the largest variability over the polar cap is clearly visible, while there is significant difference in capturing the standard deviation for SAT (Fig. 3f). The spatial correlation coefficients for SLP and SAT between 20C Reanalysis and the historical MME are 0.57 and 0.16 (above the 99% confidence level), respectively.
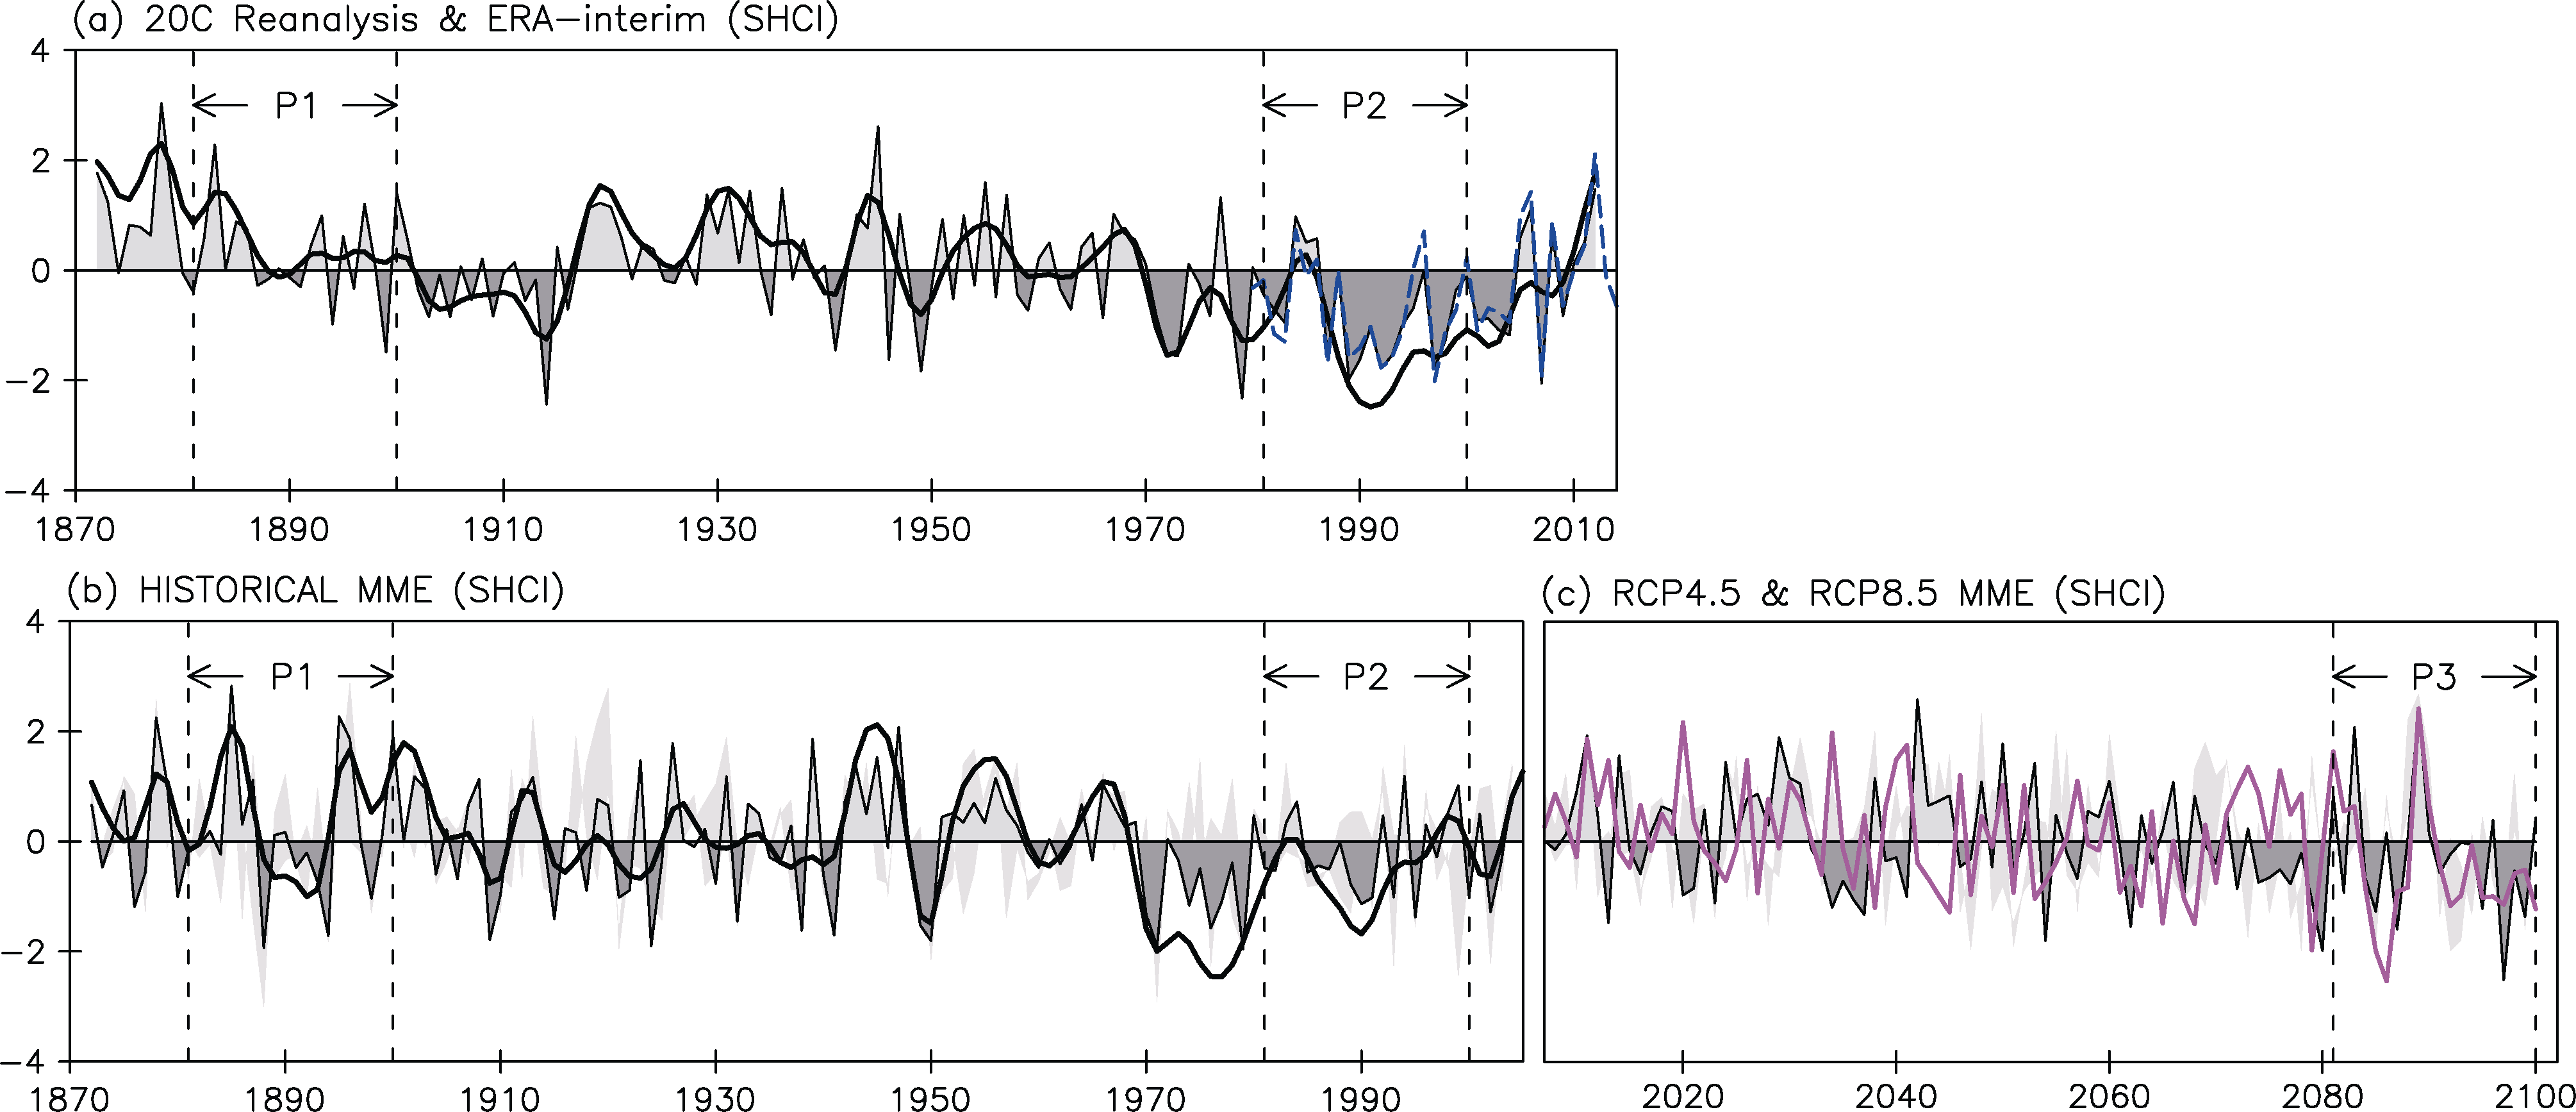 | Figure 2 Normalized and 9-yr running mean of winter SHCI derived from (a) 20C Reanalysis for 1872-2012 (black solid line)/ERA-Interim for 1980-2014 (blue dashed line) and (b) historical simulations for 1872-2005. (c) Normalized winter SHCI derived from RCP4.5 (black solid line) and RCP8.5 (pink solid line) scenario simulations for 2007-2100. In (b, c), shading indicates the inter-model standard deviation. |
 | Figure 3 Differences of winter climatology for (a, b) SLP (units: hPa), (c, d) standard deviation of SLP (units: hPa), and (e, f) SAT (units: ° C) between 1981-2000 and 1881-1900 periods derived from (a, c, e) 20C Reanalysis and (b, d, f) historical simulations. Yellow shading and blue shading indicate positive and negative values significant at the 95% confidence level according to the two-tailed Student’ s t-test. For display, the zero line is ignored. |
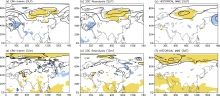
 | Figure 4 Trends of winter (a-c) SLP (units: hPa per decade) and (d-f) SAT (units: ° C per decade) during 1991-2005 derived from (a, d) ERA-Interim, (b, e) 20C Reanalysis, and (c, f) historical simulations. Yellow shading and blue shading indicate positive and negative values significant at the 90% confidence level according to the two-tailed Student’ s t-test. For display, the zero line is ignored. |
Figure 4 illustrates the trends of winter SLP and SAT during 1991-2005, as derived from ERA-Interim, 20C Reanalysis, and historical simulations. Again, the results from ERA-Interim and 20C Reanalysis are significantly related, with spatial correlation coefficients of 0.98 and 0.63 respectively. As shown in Figs. 4a and 4b, we detect an increasing trend in SLP over northern Eurasia at as much as 4.5 hPa per decade. On the other hand, the temperature trend significantly decreases over East Siberia by 1.5° C per decade (Figs. 4d and 4e). The historical MME reproduces the current recovery of the SH by about 2 hPa per decade (Fig. 4c), but fails to capture the decreasing temperature trend over East Siberia (Fig. 4f). The spatial correlation coefficients for SLP and SAT between ERA-Interim (20C Reanalysis) and the historical MME are 0.8 (0.78) and 0.56 (0.15), respectively.
The normalized winter SHCIs, derived from RCP4.5 and RCP8.5 scenario simulations, are shown in Fig. 2c. On the interannual timescale, there is no significant correlation between the SHCI from RCP4.5 and the SHCI from RCP8.5. It is clearly seen that the temporal evolution of the SHCI displays no significant long-term trend in the 21st century, accompanied by largely increased interannual variability during 2081-2100 (P3).
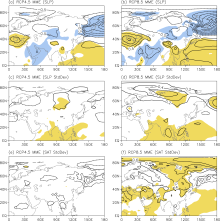
Figure 5 illustrates the differences of winter climatology for the SLP and standard deviation of SLP and SAT between the periods of 2081-2100 and 1981-2000 under the RCP4.5 and RCP8.5 scenario simulations. The 2081-2100 period is derived from the RCP4.5 and RCP8.5 scenario simulations, and the 1981-2000 period from the historical simulations. The projected SH in the late 21st century is weaker than that in the late 20C. Under the RCP4.5 scenario, the SLP in late 21st century shows negative anomalies in western Siberia, with magnitude of about 0.5 hPa (Fig. 5a), indicating a weakening of the winter SH. Meanwhile, the interannual variability of the SH increases slightly by 0.2 hPa (Fig. 5c). There is no significant change in the interannual variability of the SAT (Fig. 5e). The intensity and interannual variability of the SH show similar change under the RCP8.5 scenario; that is, a weakening of the intensity and a strengthening of the interannual variability. However, the magnitude of change is relative larger. For example, the weakening of the SLP in Siberia could reach -1.0 hPa (Fig. 5b), and the interannual variability of the SH increases by as much as 0.6 hPa (Fig. 5d). Besides, the weakening of the SH extends southeastwards. Moreover, it will likely feature increased interannual variability of SAT over the polar cap and North Asia at greater than 0.4° C at the end of 21st century (Fig. 5f). This implies that the warmer the climate appears, the weaker the SH becomes.
 | Figure 5 Differences of winter climatology for (a, b) SLP (units: hPa), (c, d) standard deviation of SLP (units: hPa), and (e, f) SAT (units: ° C) between the periods of 2081-2100 and 1981-2000 under the (a, c, e) RCP4.5 and (b, d, f) RCP8.5 scenario simulations. The 2081-2100 period is derived from the RCP4.5 and RCP8.5 scenario simulations and the 1981-2000 period is derived from the historical simulations. Yellow shading and blue shading indicate positive and negative values significant at the 95% confidence level according to the two-tailed Student’ s t-test. For display, the zero line is ignored. |
This study investigates the temporal evolution of the SH in the 20th and 21st centuries using CMIP5 historical, RCP4.5 and RCP8.5 simulations from 12 CMIP5 climate models. We show that:
(1) The temporal evolution of winter SHCI has interannual and interdecadal variations in the 20C, with high records during 1881-1900, a pronounced reduction during 1981-2000, and a recovery in recent years (Fig. 2a). The SHCI in the historical CMIP5 MME shows similar variations on interannual to decadal timescales (Fig. 2b). The linear correlation coefficient between the SHCI from 20C Reanalysis and the simulated SHCI from the historical MME for 1872-2005 is 0.3 on annual and interannual timescales.
(2) The CMIP5 historical MME captures the current reduction (1981-2000) in the SH intensity at as much as 1 hPa (only one-third of the observation) (Fig. 3b) and the strongest interannual variability over the polar cap (Fig. 3d). The spatial correlation coefficients between 20C Reanalysis and the historical MME are 0.69 and 0.57, respectively.
(3) The projected SH in the late 21st century is weaker than that in the late 20C. Under the RCP4.5 and RCP8.5 scenarios, the SLP in the late 21st century shows negative anomalies in western Siberia, with magnitudes of about 0.5 hPa (Fig. 5a) and 1.0 hPa (Fig. 5b) respectively, indicating a weakening of the winter SH. Meanwhile, the interannual variability of the SH increases by 0.2 hPa under the RCP4.5 scenario (Fig. 5c) and 0.6 hPa under the RCP8.5 scenario (Fig. 5d). Moreover, it will likely feature increased interannual variability of SAT over the polar cap and North Asia at greater than 0.4° C under the RCP8.5 scenario at the end of the 21st century (Fig. 5f).
It is worth mentioning that, although the time series of the SHCI in the MME agrees well with 20C Reanalysis, the linear correlation coefficient of the SHCI between 20C Reanalysis and individual model output varies considerably (Table 1). Their ability to represent the SH is still inadequate, and hence their projection is more or less uncertain. In addition, the historical MME fails to capture the current decreasing trend of temperature over East Siberia (see Fig. 4f). More attention should be paid to understand the cause of the interannual and interdecadal variability in the SH. The SH shows a recovery in recent years even in the context of global warming (Jeong et al., 2011; Wu et al., 2011). These studies indicated that localized climate feedback, such as an increase of Eurasian snow cover and a decrease of Arctic sea ice, might have contributed to the recovery. Actually, Liu et al. (2012) and Li and Wang (2014) revealed that decreasing autumn Arctic sea ice caused by warming might have induced the anomalously large snowfall over Eurasia in recent winters. Our analysis indicates that the recent recovery in the CMIP5-model-simulated SH is linked to the simulated Arctic sea ice reduction and is not directly linked to the simulated Eurasian snow cover (figure not shown). It also should be mentioned that long-term reconstruction data are needed and that the CMIP5 unforced simulations should be investigated to understand the natural variability in the SH.
| [1] |
|
| [2] |
|
| [3] |
|
| [4] |
|
| [5] |
|
| [6] |
|
| [7] |
|
| [8] |
|
| [9] |
|
| [10] |
|
| [11] |
|
| [12] |
|
| [13] |
|
| [14] |
|
| [15] |
|
| [16] |
|
| [17] |
|