

Change in Extreme Climate Events over China Based on CMIP5
[XU Ying1  , WU Jie
1, 2 , SHI Ying1 , ZHOU Bo-Tao1 , LI Rou-Ke1 , WU Jia1 ]
, WU Jie|
|


The changes in a selection of extreme climate indices (maximum of daily maximum temperature (TXx), minimum of daily minimum temperature (TNn), annual total precipitation when the daily precipitation exceeds the 95th percentile of wet-day precipitation (very wet days, R95p), and the maximum number of consecutive days with less than 1 mm of precipitation (consecutive dry days, CDD)) were projected using multi-model results from phase 5 of the Coupled Model Intercomparison Project in the early, middle, and latter parts of the 21st century under different Representative Concentration Pathway (RCP) emissions scenarios. The results suggest that TXx and TNn will increase in the future and, moreover, the increases of TNn under all RCPs are larger than those of TXx. R95p is projected to increase and CDD to decrease significantly. The changes in TXx, TNn, R95p, and CDD in eight sub-regions of China are different in the three periods of the 21st century, and the ranges of change for the four indices under the higher emissions scenario are projected to be larger than those under the lower emissions scenario. The multi-model simulations show remarkable consistency in their projection of the extreme temperature indices, but poor consistency with respect to the extreme precipitation indices. More substantial inconsistency is found in those regions where high and low temperatures are likely to happen for TXx and TNn, respectively. For extreme precipitation events (R95p), greater uncertainty appears in most of the southern regions, while for drought events (CDD) it appears in the basins of Xinjiang. The uncertainty in the future changes of the extreme climate indices increases with the increasing severity of the emissions scenario.
The Fifth Assessment Report (AR5) of the Intergovernmental Panel on Climate Change (IPCC) states that “ warming of the climate system is unequivocal” . The global mean surface temperature shows a warming of 0.85° C (0.65° C-1.06° C) over the period 1880-2012, with the warming trend for each decade in the last 30 years of that period being higher than any others since 1850 (IPCC, 2013). In this context, the frequencies of extreme climate events, such as drought, floods, heat waves, low temperatures, and cold-damage events, have increased in most regions of the world, causing substantial adverse impacts upon people’ s livelihoods and the socioeconomics of the communities in which they live. According to the IPCC’ s special report on managing the risks of extreme events and advancing climate change adaptation (IPCC SREX, 2012), the frequency and strength of some extreme climate events, especially drought and floods, will increase in the future.
The performance of climate models, for instance in terms of their resolution and complexity of the physical processes they can consider, has been improved greatly in recent years. As such, the outputs of these models have provided a solid basis for the projection of climate changes, especially for the projection of extreme climate events. For extreme climate events over China, many researchers have, through historical analysis, assessed the capabilities of the climate models involved in the Coupled Model Intercomparison Project, Phase 3 and Phase 5 (CMIP5). Based on these assessments, projections have been made with respect to the mean state and climate extremes over China in different periods of the 21st century under different emissions scenarios (e.g., the IPCC’ s Special Report on Emissions Scenarios, and their Representative Concentration Pathways (RCPs)) (Jiang et al., 2004, Wang et al., 2008; Xu et al., 2009; Jiang and Fu, 2012; Yao et al., 2012; Chen, 2013; Chen et al., 2014; Zhang et al., 2014; Zhou et al., 2014). And based on these projections of extreme climate events, some researchers have further analyzed their associated risks (Xu et al., 2014; Dong et al., 2014).
Compared to previous studies, the number of climate models used in the present work is non-selective, i.e., we use as many models as are currently available to us. Furthermore, besides the changes in extreme climate events at the end of the 21st century, we also project the changes in the early and middle parts of the 21st century under different emissions scenarios, with which the Chinese government is mostly concerned. The results not only provide a basis for the projection of climate risks in the future, but also for adaptation to climate change, the prevention of disasters, and the reduction of damage.
The method of Frich et al. (2002) was used to calculate 27 extreme climate indices related to temperature and precipitation by employing the daily temperature and precipitation data of 27 GCMs in CMIP5 (see Table 1 for
model information). For brevity, we selected four extreme climate indices to represent extreme warmth, cold, precipitation, and drought: maximum of daily maximum temperature (TXx), minimum of daily minimum temperature (TNn), annual total precipitation when the daily precipitation exceeds the 95th percentile of wet-day precipitation (very wet days, R95p), and the maximum number of consecutive days with less than 1 mm of precipitation (consecutive dry days, CDD), respectively. We analyzed the possible changes in these indices and calculated their uncertainty ranges under different RCPs over three periods of the 21st century.
| Table 1 Basic information on the 27 Coupled Model Intercomparison Project Phase 5 global coupled climate models. |
Following the National Assessment Report of Climate Change (National Report Committee, 2007), we divided China into eight sub-regions: Northeast China (NEC), Northern China (NC), Eastern China (EC), Central China (CC), Southern China (SC), Southwest China (SWC2), Northwest China (NWC), and Qinghai-Tibet (SWC1) (Table 2).
The changes in the extreme climate indices are summarized using box-and-whisker plots in the eight sub-regions. These plots consist of the multi-model median, the interquartile model spread (the range between the 25th and 75th quantiles, indicated by the box), and the full inter-model range (indicated by the whiskers). The multi-model median is taken to be the projected change, while the interquartile model spread and the inter-model range represent the uncertainties in the projection, and can also indicate model agreement or disagreement in terms of the direction of the projected change.
Many studies have assessed the capacity of multi- model simulations over China, and indicate that the spatial distributions of TXx, TNn, R95p, and CDD can be reproduced well by models, albeit with some deviations from observational data (Chen et al., 2014; Zhang et al., 2014; Zhou et al., 2014). In the following sections, we present the projected changes of the aforementioned indices in the 21st century.
| Table 2 Coordinates of the eight sub-regions and the whole of China used in this study. |
Figure 1 shows the temporal evolution of TXx, TNn, R95p, and CDD under different RCPs. It can be seen that TXx is projected to increase under each emissions scenario relative to 1986-2005 (Fig. 1a). In 2025, the ranges of increase under three RCPs are relatively consistent, increasing by about 1° C. Up to 2050, TXx increases by 1° C-2.5° C. At the end of the 21st century, the warming amplitude under RCP8.5 is largest (5.8 ± 1.2° C); under RCP4.5 it is 2.6 ± 0.5° C; while the smallest amplitude (1.5 ± 0.5° C) occurs under RCP2.6.
Compared to TXx, TNn is projected to increase significantly under all RCPs (Fig. 1b). TNn under each RCP increases by about 1.2° C in 2025. The warming under RCP2.6 and RCP4.5 are relatively consistent, at about 2.0° C in 2050. At the end of the 21st century, the warming amplitude of TNn under RCP8.5 is 6.3 ± 0.9° C; under RCP4.5 it is 2.8 ± 0.9° C; while the smallest amplitude (1.4 ± 0.7° C) occurs under RCP2.6.
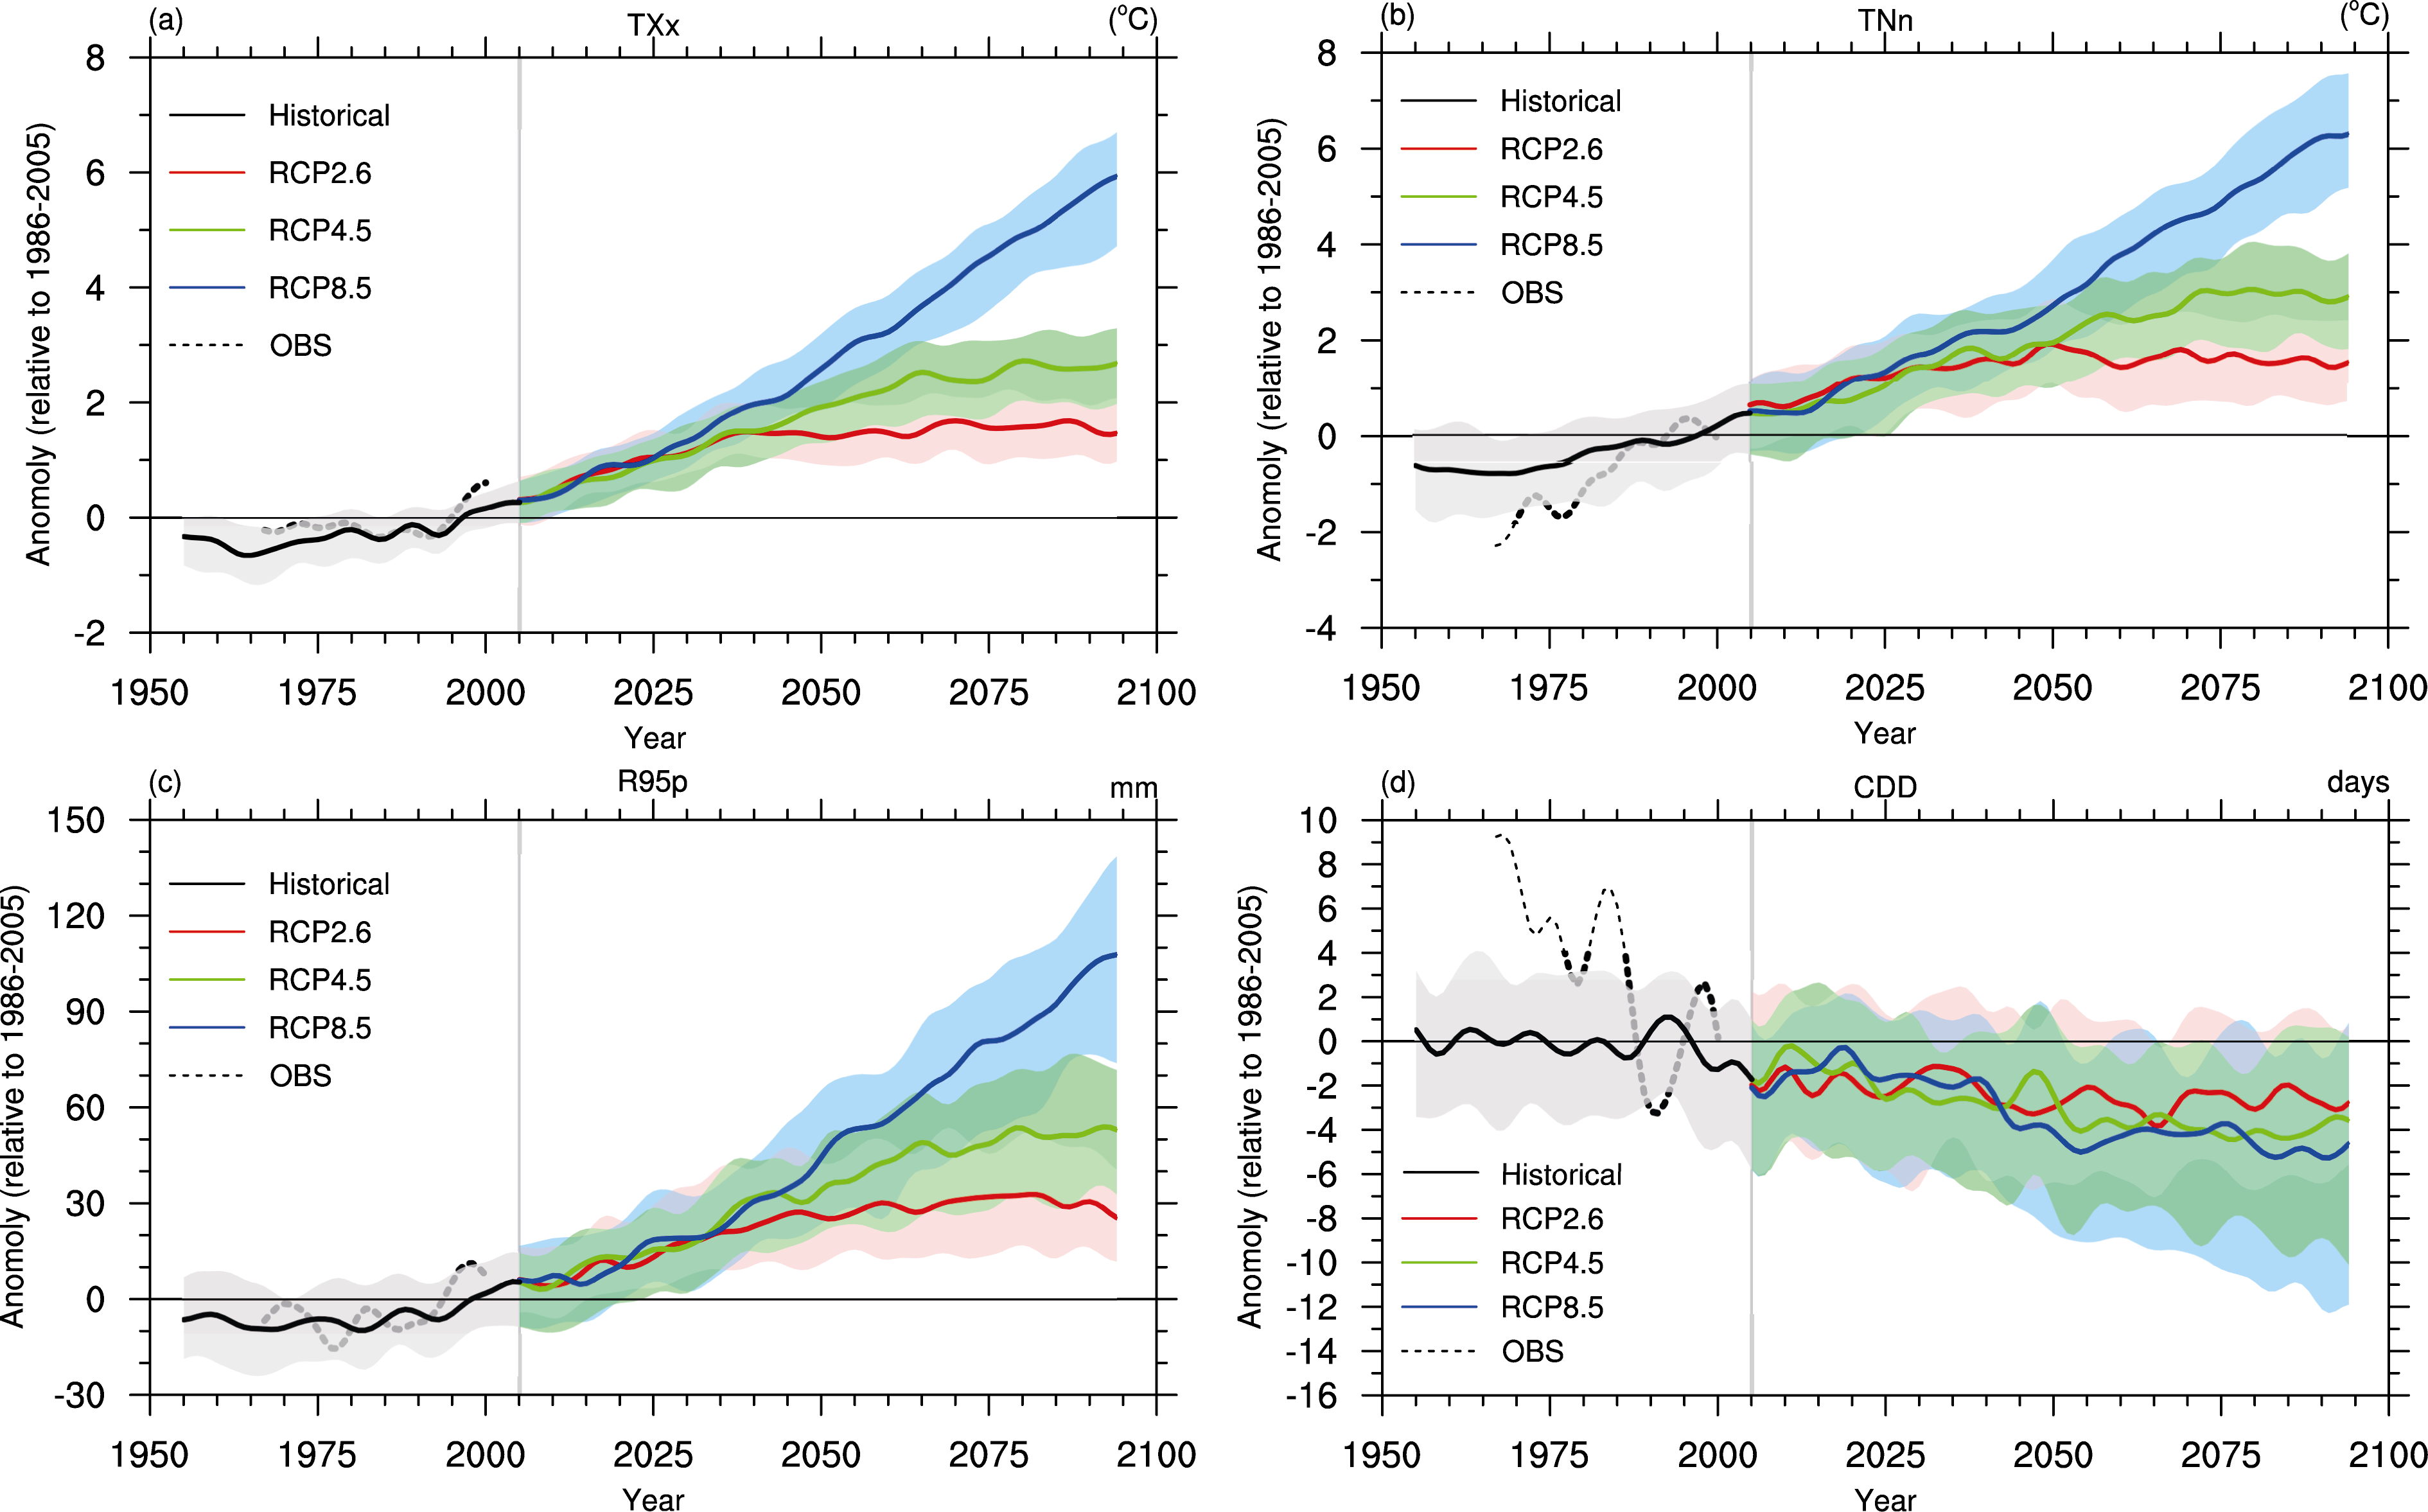 | Figure 1 Temporal evolution of maximum of daily maximum temperature (TXx), minimum of daily minimum temperature (TNn), annual total precipitation when the daily precipitation exceeds the 95th percentile of wet-day precipitation (very wet days, R95p), and the maximum number of consecutive days with less than 1 mm of precipitation (consecutive dry days, CDD) under Representative Concentration Pathway 2.6 (RCP2.6), RCP4.5, and RCP8.5 relative to 1986-2005. |
R95p is projected to increase under all RCPs (Fig. 1c). The increase is relatively consistent under the three RCP scenarios, at about 15 mm in 2025. The index increases by 20-40 mm in 2050. The increment of R95p under RCP8.5 is the largest (105 ± 30 mm) at the end of the 21st century; under RCP4.5 it is 45 ± 15 mm; while the smallest increment (25 ± 15 mm) occurs under RCP2.6.
CDD is projected to decrease under all RCPs (Fig. 1d). The index decreases by two to three days and three to four days in 2025 and 2050, respectively. At the end of the 21st century, CDD decreases by four to six days, but with greater uncertainty.
Figure 2 shows the changes and uncertainty ranges of extreme warm events (TXx) and extreme cold events (TNn) under different RCP scenarios in three periods over China. The results show that, relative to 1986-2005, the projected ensemble median TXx increases slightly in the
early, middle, and latter parts of the 21st century under RCP2.6 over the whole of China. The warming is greater under higher emissions scenarios and the projected ensemble median in TXx increases by about 5° C at the end of the 21st century under RCP8.5. The TXx index shows similar characteristics in the eight sub-regions, with the warming being largest in NWC, NC, NEC, and CC. Furthermore, the box (50% inter-model range) in Fig. 2 indicates the uncertainty ranges, and the results show that the uncertainty is larger under higher emissions scenarios, and the regions with more significant changes possess greater uncertainty. The uncertainty ranges in the early period (2016-2035) are smaller than those in the middle and latter parts of the 21st century (Fig. 2a).
Figure 2b shows the TNn changes from the multi-model ensemble over China relative to 1986-2005. The results show that the projected ensemble median in TNn increases slightly in the early, middle, and latter parts of the 21st century under RCP2.6, but the warming amplitude becomes smaller at the end of the 21st century compared to in the middle of the century. Under RCP4.5 and RCP8.5, the projected ensemble median increases over China for TNn, and the increase is greater under higher RCP scenarios. Under RCP8.5, the projected ensemble median for TNn over China increases by 6° C at the end of the 21st century. There is a similar characteristic of change between the sub-regions and the whole of China in the 21st century, and the projected ensemble median for TNn shows slight differences in different regions. Moreover, under higher emissions scenarios, the uncertainty ranges for TNn are larger, i.e., those regions with more significant changes possess greater uncertainty.
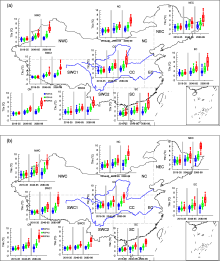
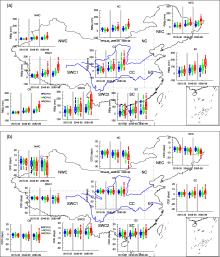
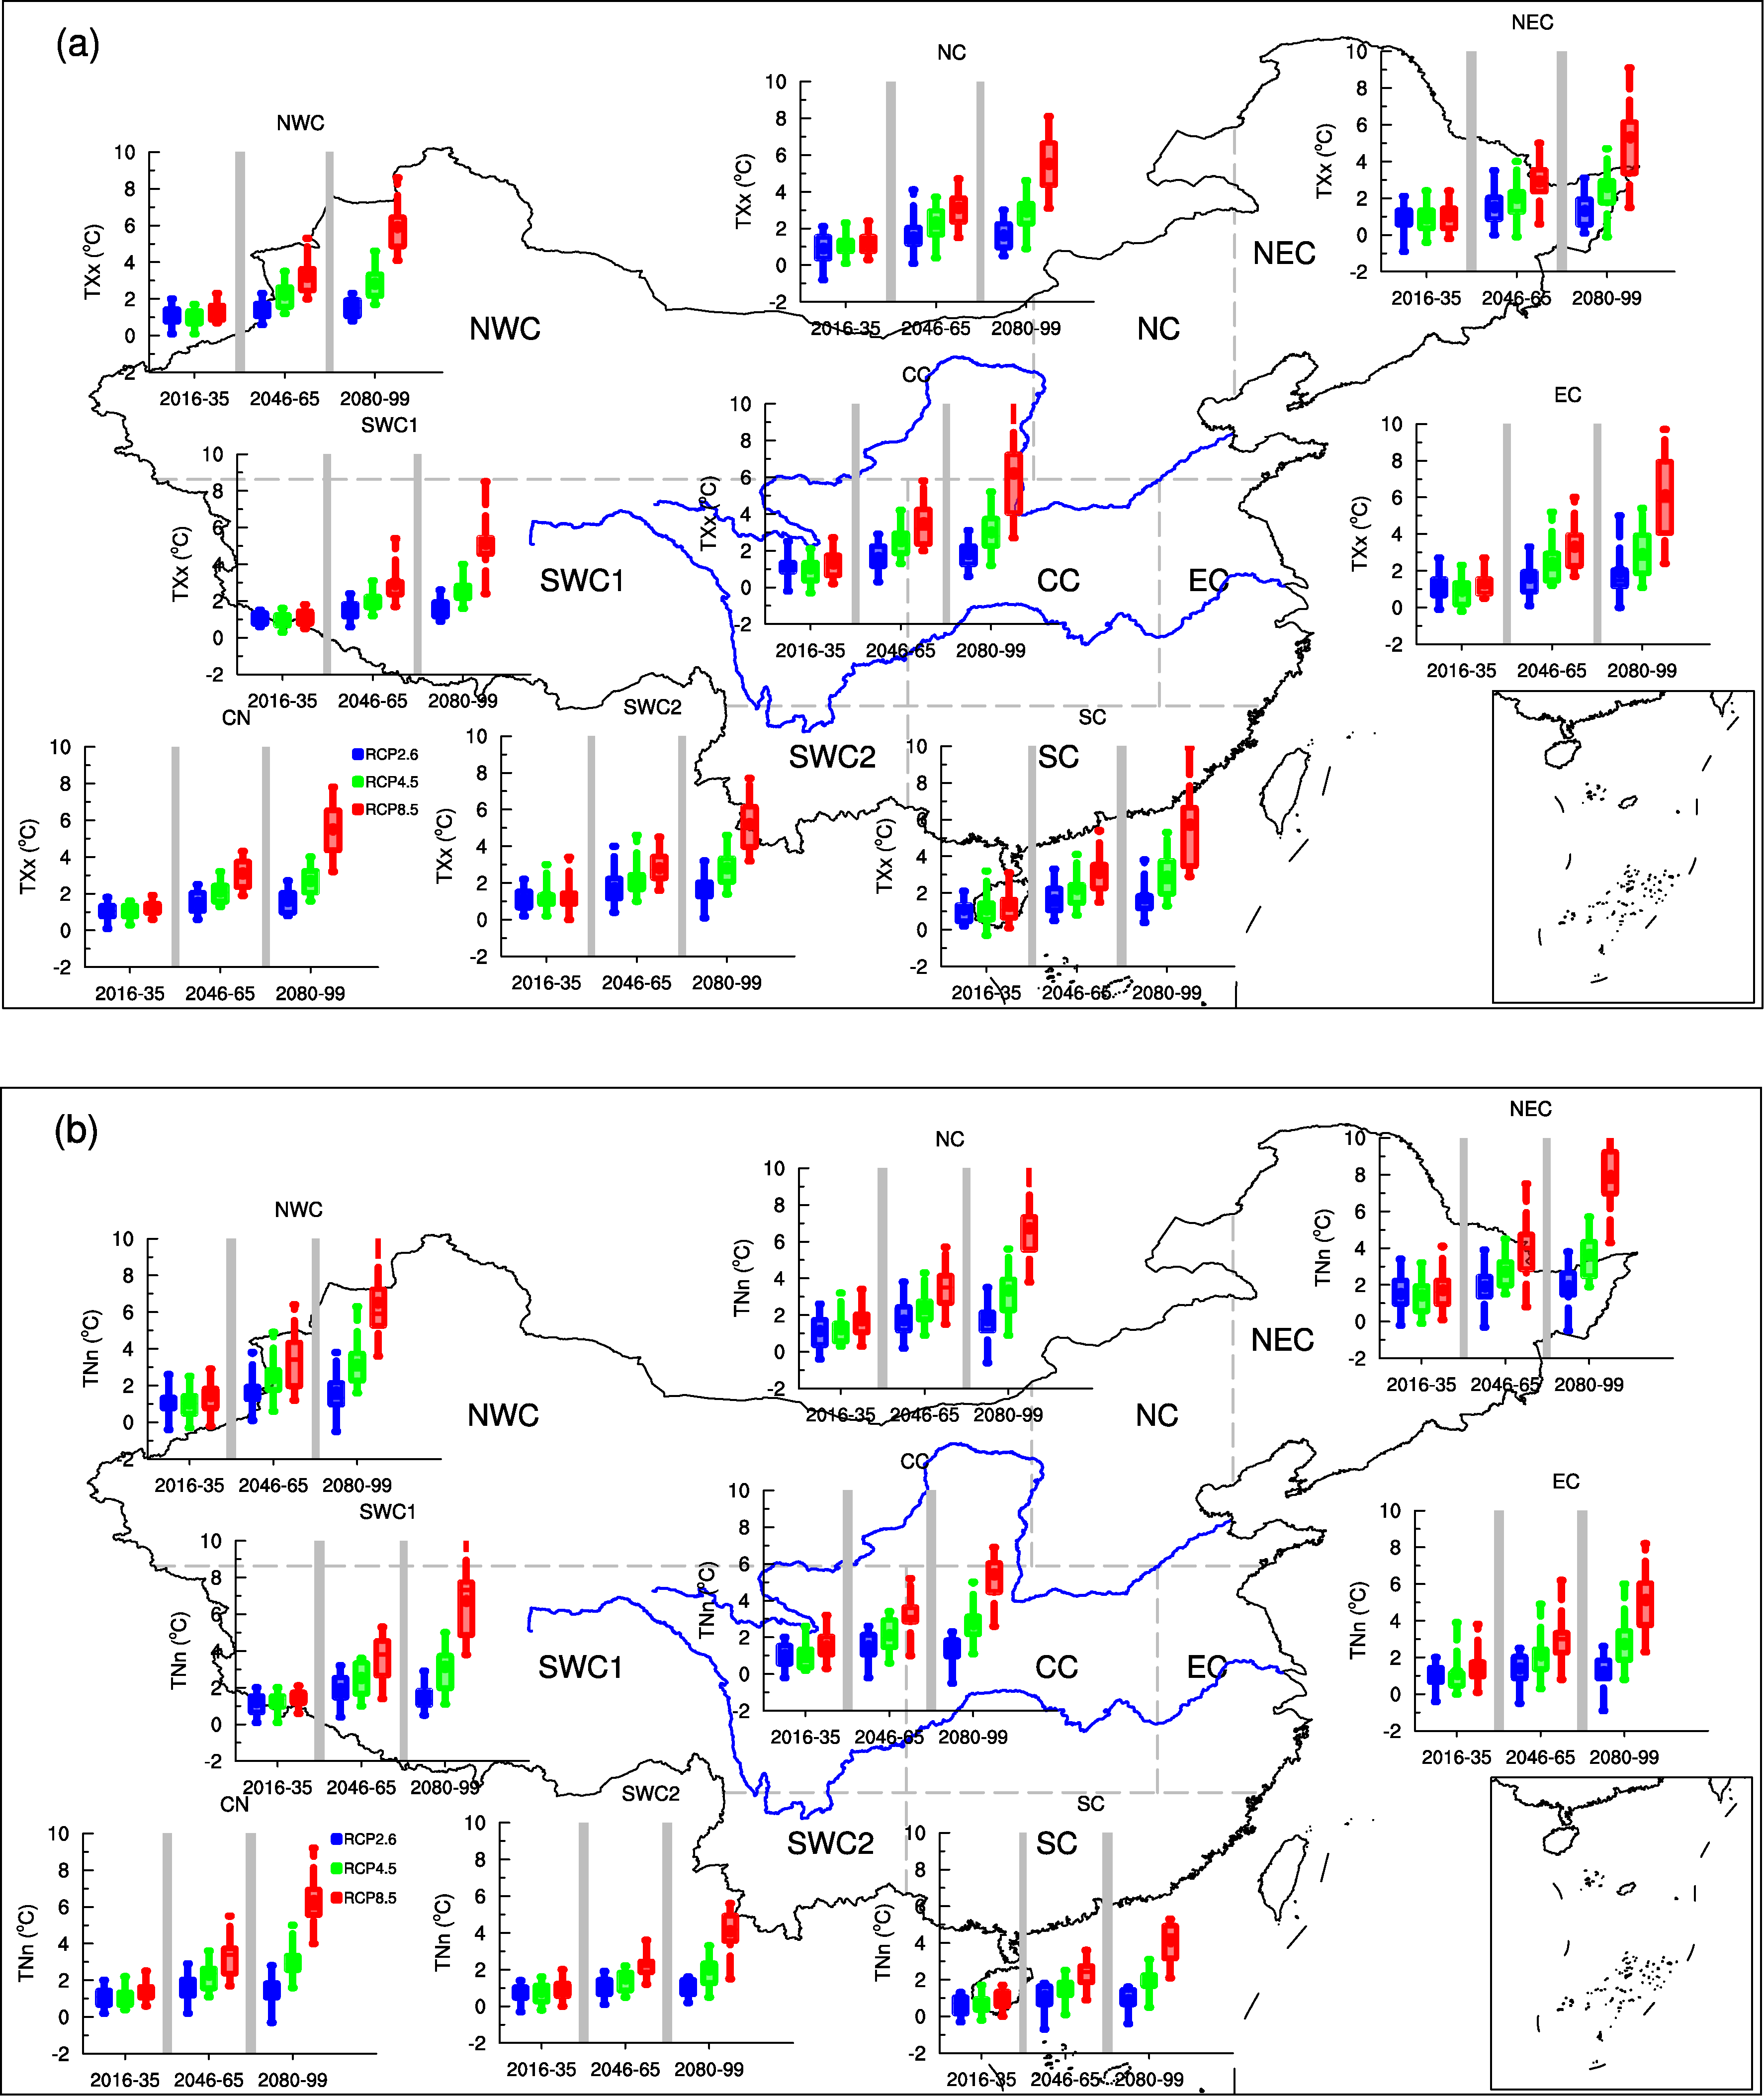 | Figure 2 Projected changes in TXx and TNn over eight sub-regions (see Table 2 for definitions) relative to 1986-2005 during different periods in the future. The central rectangle boxes indicate the interquartile range, the bars through the boxes are drawn at the medians, and the whiskers extend to the maximum and minimum values of the multiple-models. |
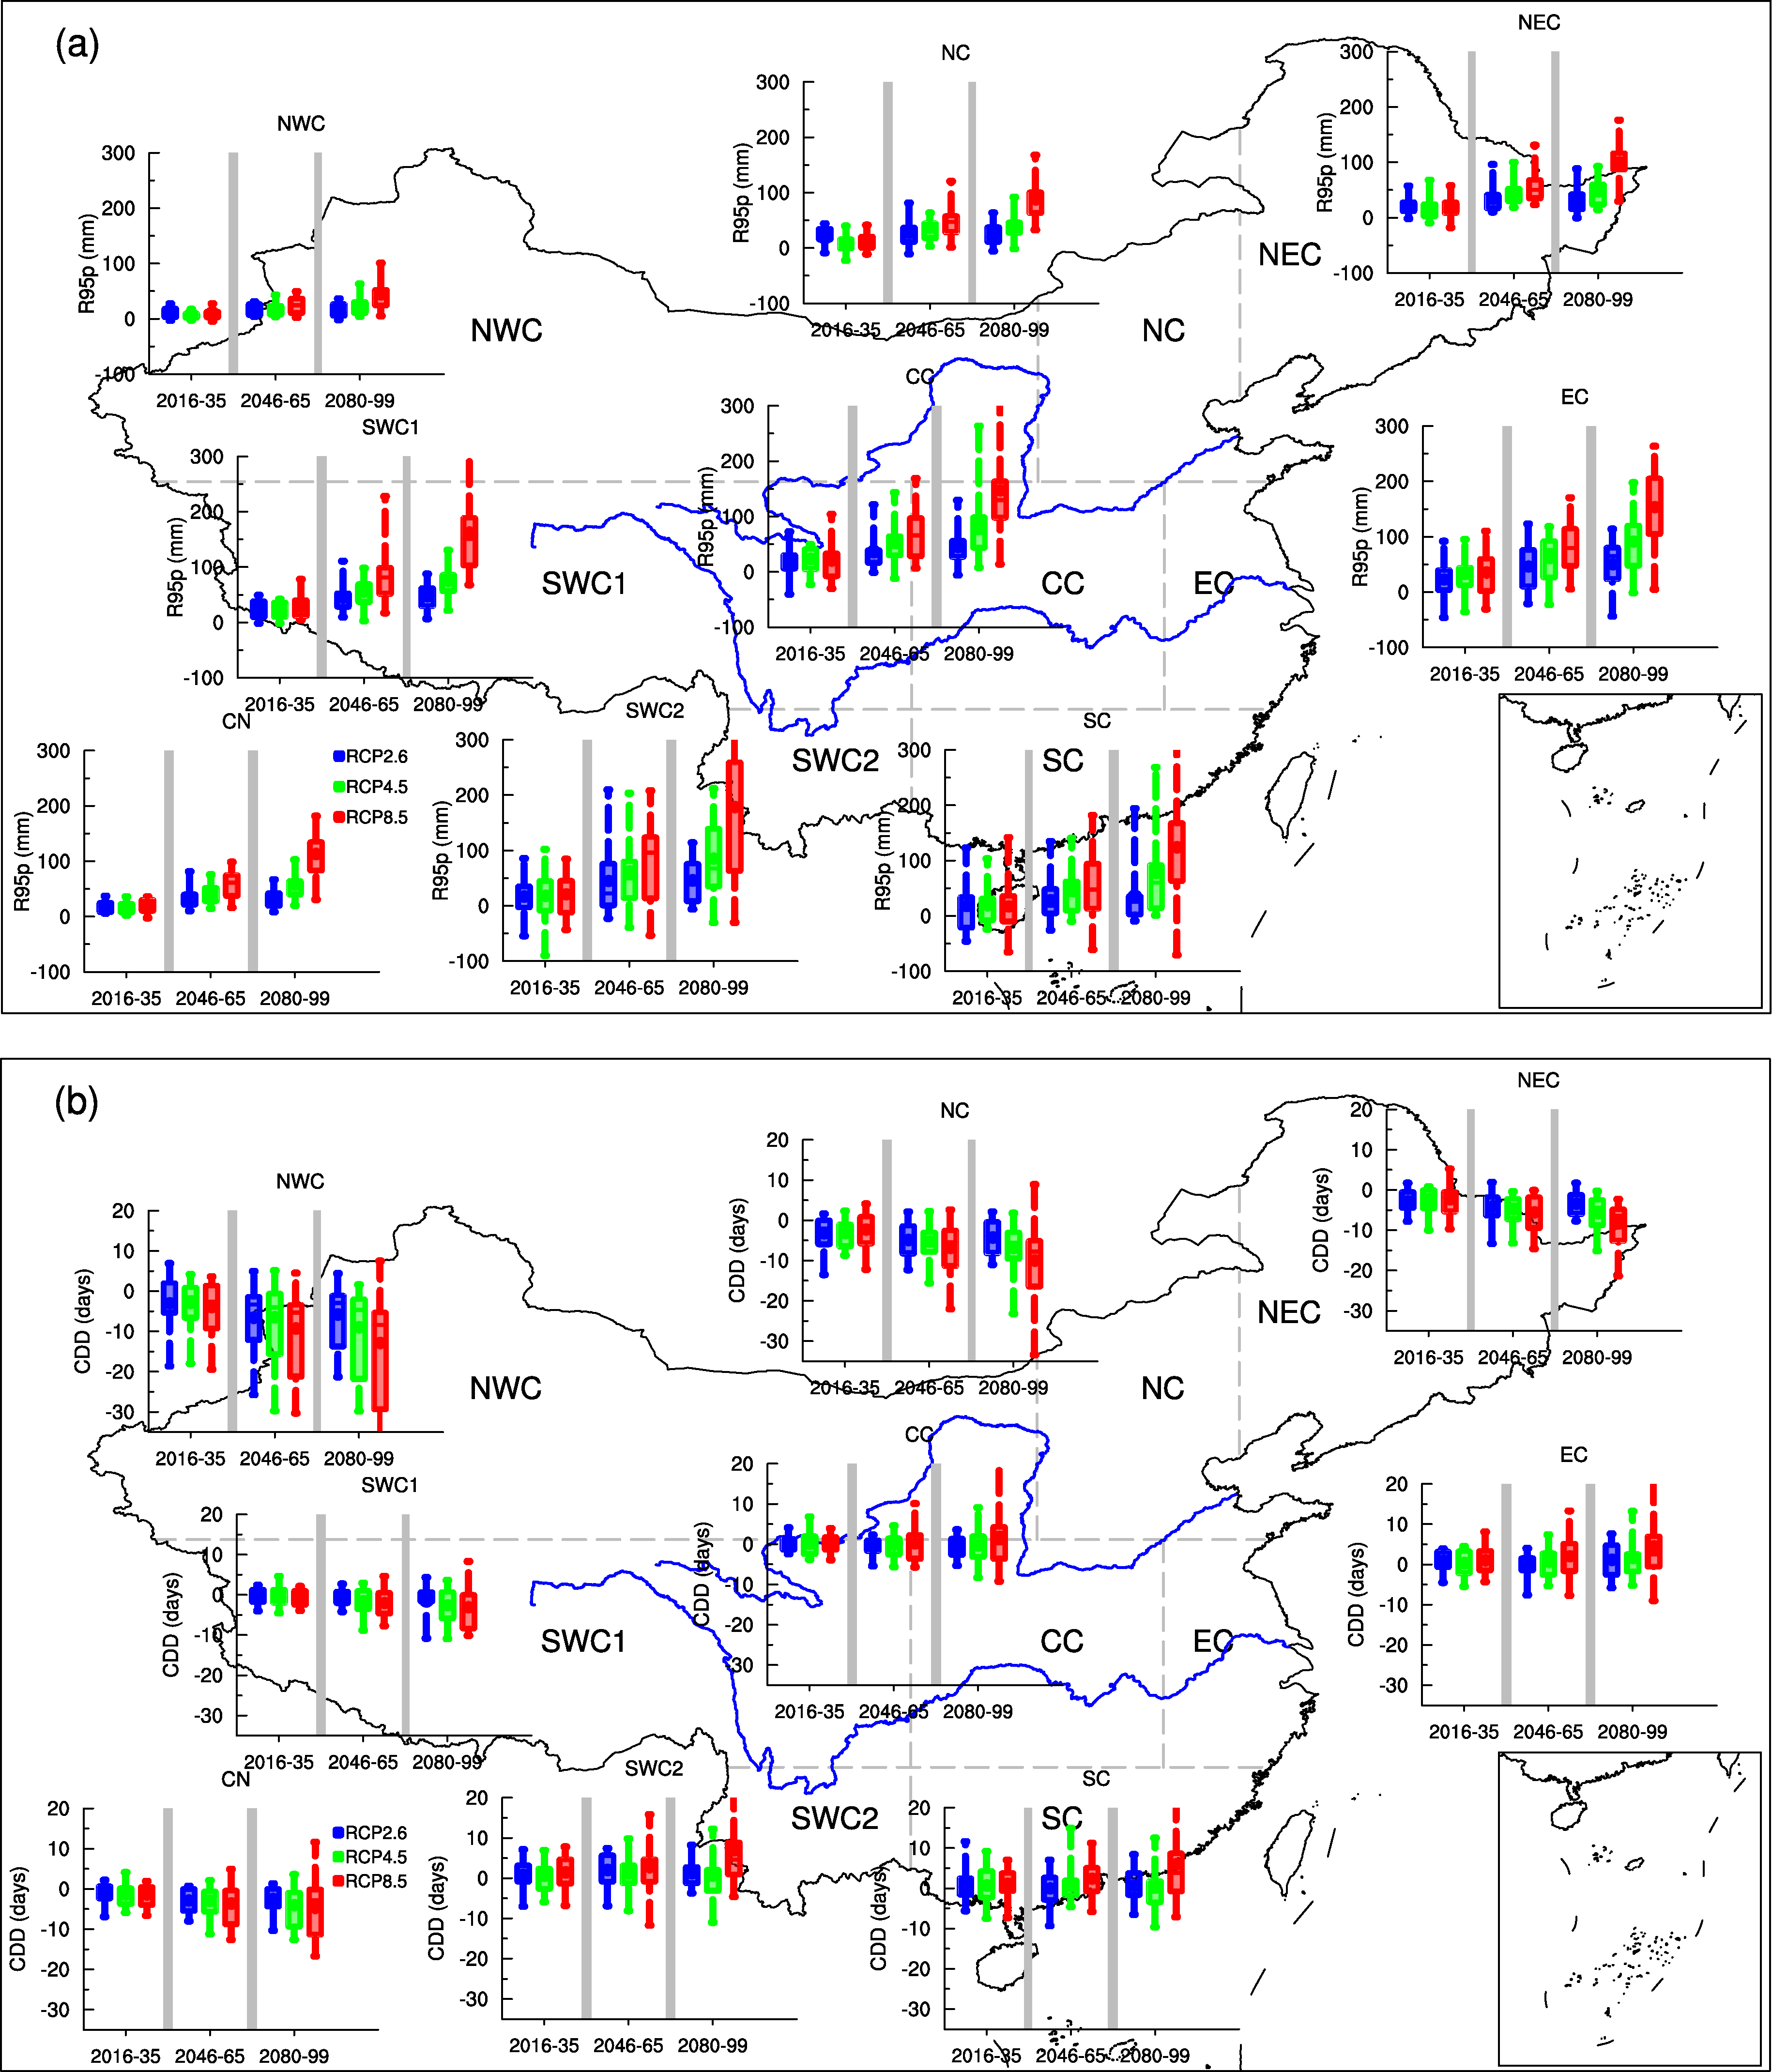 | Figure 3 Projected changes in R95p and CDD over eight sub-regions (see Table 2 for definitions) relative to 1986-2005 during different periods in the future. The central rectangle boxes indicate the interquartile range, the bars through the boxes are drawn at the medians, and the whiskers extend to the maximum and minimum values of the multiple models. |
Figure 3a shows the changes in extreme precipitation (R95p) and its uncertainty ranges (the 50% inter-model range) under different RCP scenarios in the eight sub- regions of China in different periods. The results show that the projected ensemble median for R95p over China increases in the 21st century under all RCPs relative to 1986-2005. Under RCP8.5, the 50% inter-model range for R95p over the whole China is about 75-130 mm at the end of the 21st century. The change in R95p in all regions of China in the 21st century is the same as for the whole country. The changes are similar in SWC2, SC, and EC, but a slight increase (absolute value) is apparent in NWC. Moreover, the uncertainty ranges for R95p under the higher emissions scenarios are larger. The uncertainty ranges in the middle and at the end of the 21st century are larger than those in the early 21st century. The uncertainty in regions with more significant change is larger than in regions with smaller change, and thus the greatest level of uncertainty is found in SWC2.
Figure 3b shows the change in CDD and its uncertainty range under different RCPs in the eight sub-regions and for the whole of China in different periods. It can be seen that CDD is projected to decrease in the 21st century under the three RCP scenarios over the whole of China relative to 1986-2005, and the more significant decrease is found under the higher emissions scenarios. Under RCP8.5, the CDD over the whole of China decreases by about 1-13 days at the end of the 21st century. The changes in CDD are similar under all RCPs in SWC1, NC, and NEC; while in NWC, a significant decrease is apparent. In SWC2, SC, and EC, CDD increases slightly, but there are no significant changes in CC. The uncertainty range for CDD in NWC is significantly larger than that in other regions, and larger uncertainty ranges can also be found under higher emissions scenarios. Compared with R95p, CDD shows no significant change under the different emissions scenarios.
In general, the uncertainty ranges of the four extreme climate indices are smaller for the whole of China than in the eight sub-regions, indicating that the level of uncertainty at smaller regional scales would be even greater.
Figure 4 shows the inter-model standard deviations of the four extreme climate indices’ anomalies over China during 2046-65 under RCP4.5, relative to 1986-2005. All models show better consistency for the warm and cold temperature indices (TXx and TNn), as compared to the relatively poor consistency in the extreme indices of precipitation (R95p and CDD). The consistency of TXx in SWC1 is relatively high, but low in EC, Xinjiang, NEC, and the southern part of the Yangtze River. The standard deviations of TXx over the southern part of the Yangtze River can be larger than 1.4° C. Compared to TXx, TNn shows higher consistency in the southern part of the Yangtze River, while in northern regions it is poor, especially in the northern part of Xinjiang, NEC, and the south of SWC1. The inter-model difference can be up to 1.8° C over the Junggar Basin in the western part of Xinjiang.
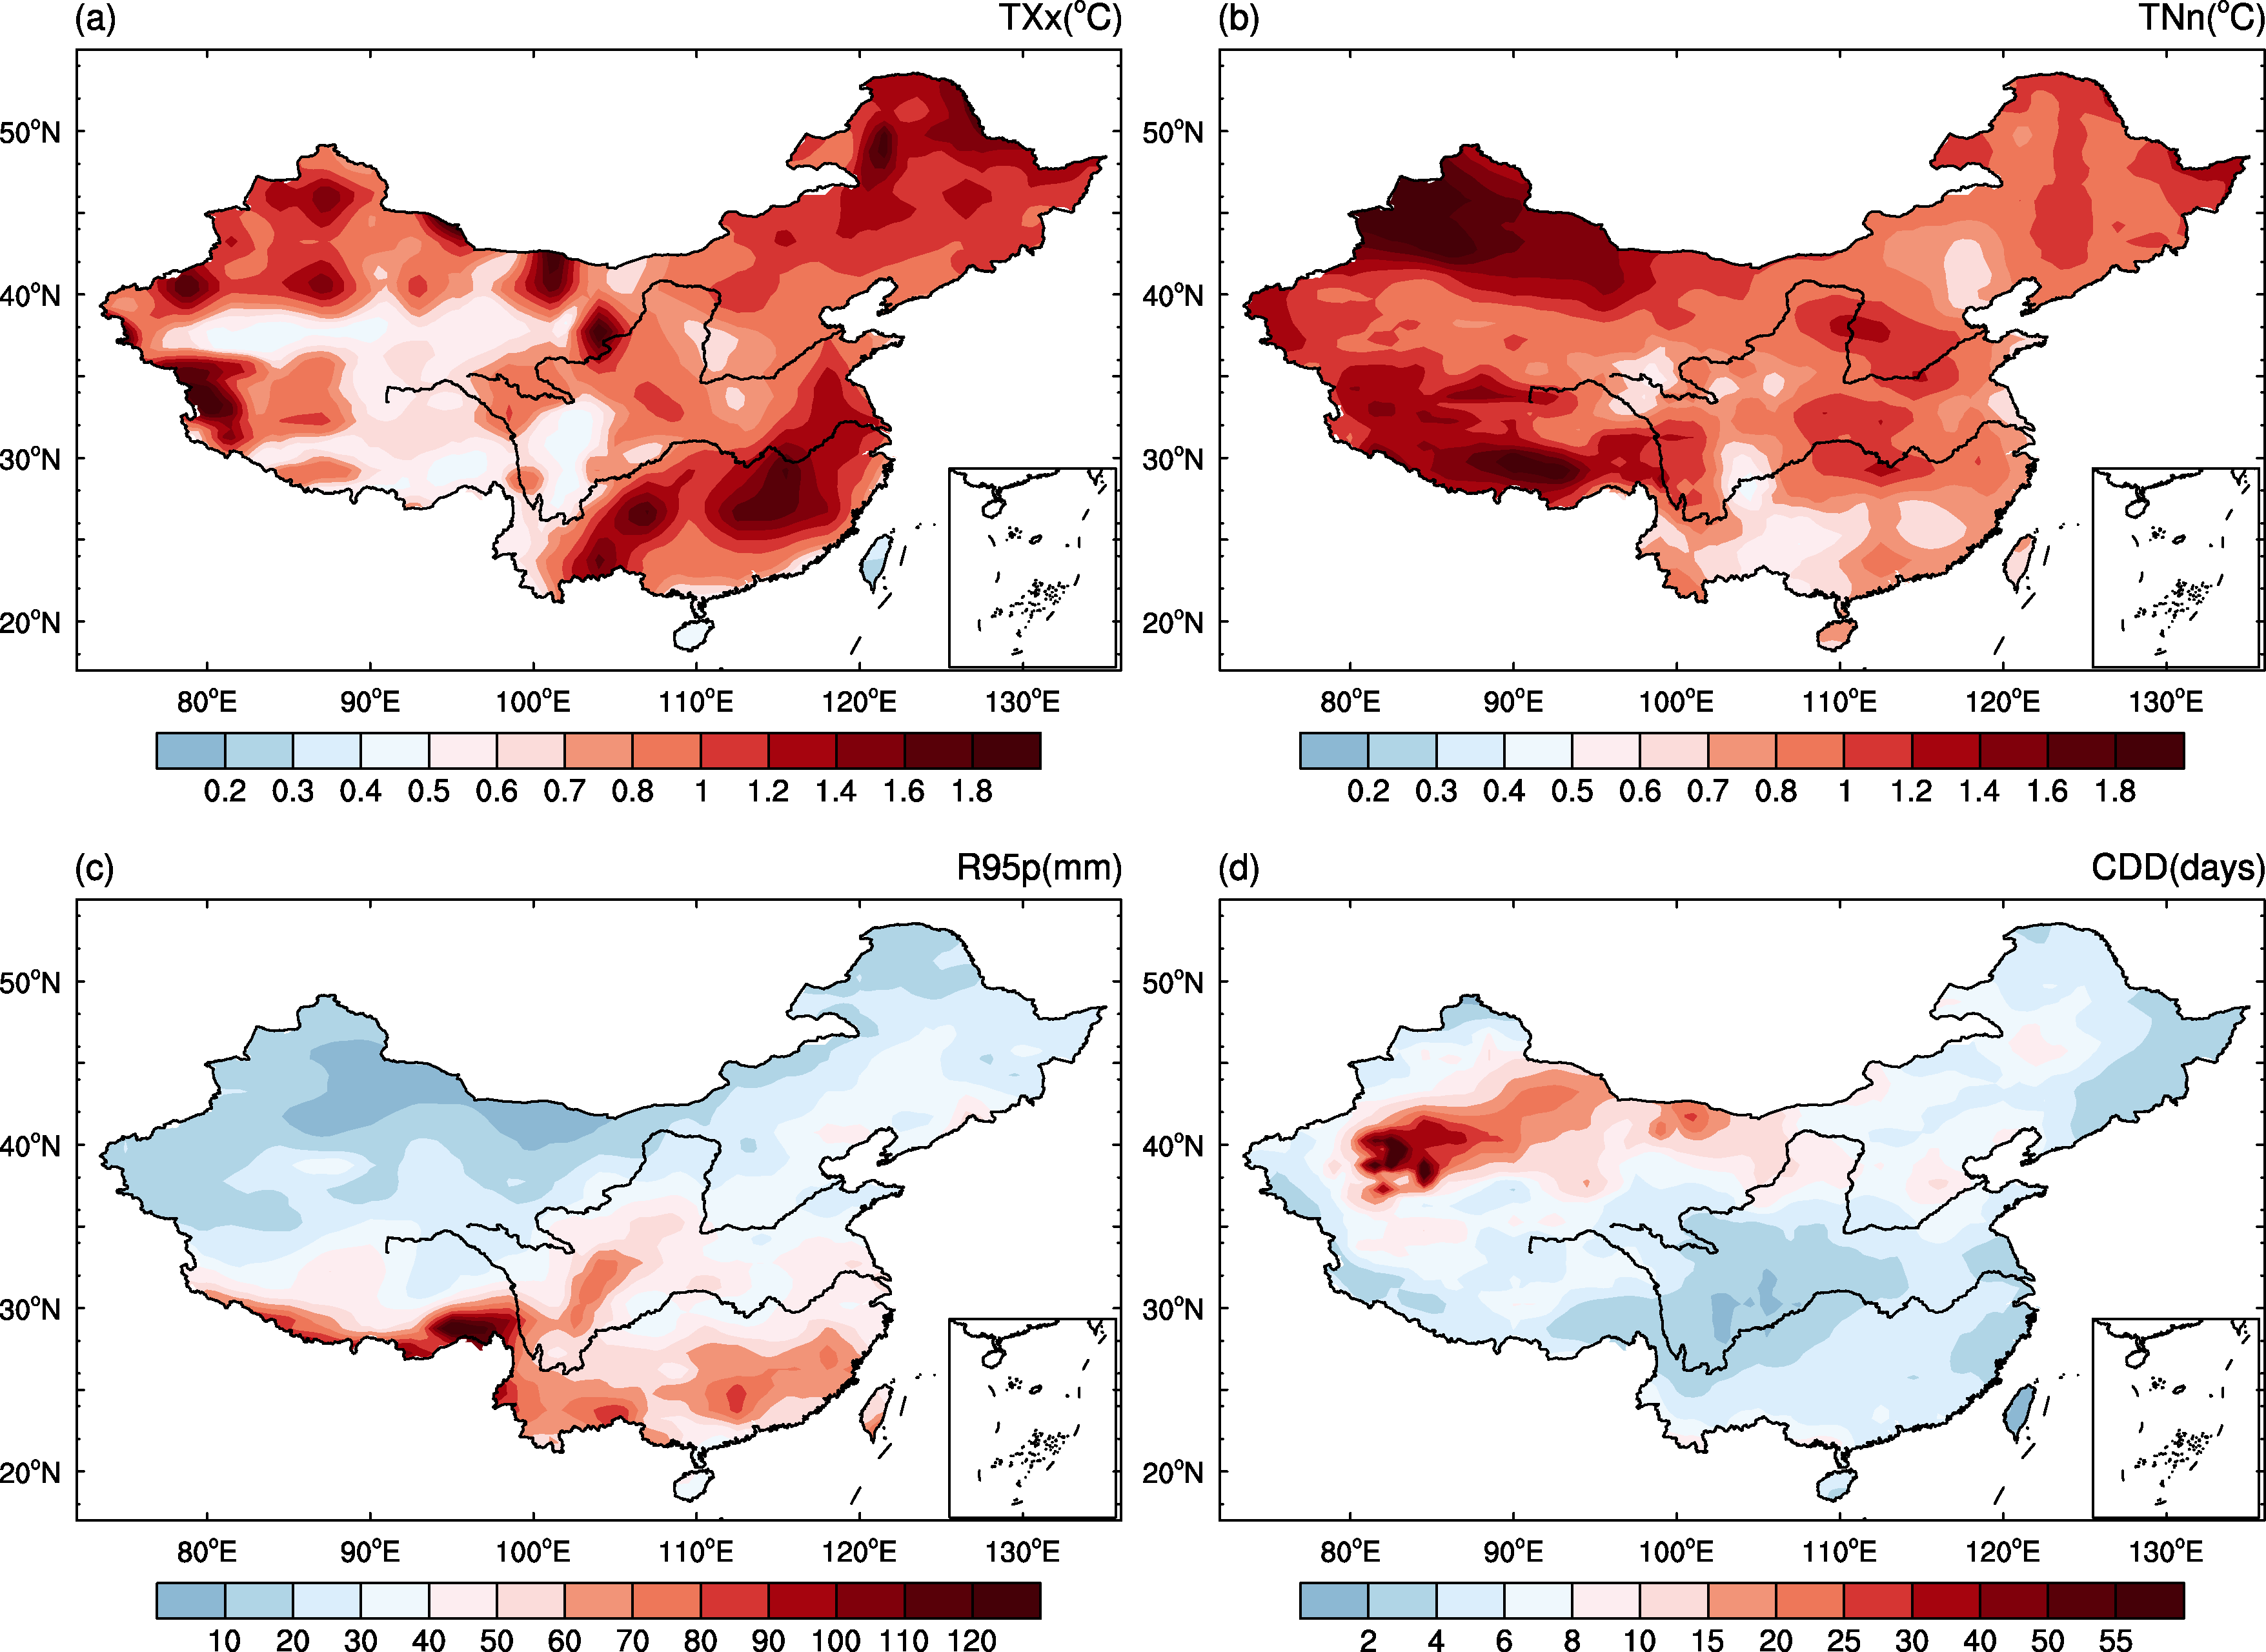 | Figure 4 Inter-model standard deviations for TXx, TNn, R95p, and CDD in 2046-65 under RCP4.5. |
The standard deviations of R95p show low inter-model consistency in southern regions, especially in the southern part of the Yangtze River, which can be up to 80 mm. Meanwhile, in the northern regions of China, remarkable consistency is apparent, especially in Xinjiang. For CDD, the standard deviation is smaller in SC; while from south to north or northwest, it becomes obviously greater. The maximum standard deviation appears in the Tarim Basin of Xinjiang, where its value is more than 50 days.
In summary, the inter-model consistencies are different among the four extreme climate indices. For TXx and TNn, greater inconsistency can be found in those regions where high or low temperatures are likely to happen; while for R95p and CDD, it is found in most of the southern regions and in the basins of Xinjiang, respectively. Previous studies show that the uncertainty in such simulation results is mainly caused by coarse model resolution and an insufficient description of steep terrain (Jiang et al., 2008). Higher resolution could improve the accuracy of models, especially for the precipitation caused by complex topography (Gao et al., 2002).
Comparing the simulation results under RCP2.6, RCP4.5, and RCP8.5, the uncertainty ranges of the four extreme climate indices are different, and the inter-model inconsistency increases under higher emissions scenarios (figures not shown). Moreover, by analyzing the standard deviations in different periods (2016-35, 2046-65, and 2080-99) under the same emissions scenario, we find that with the temporal evolution the inter-model consistencies in TXx, TNn, R95p, and CDD reduce. At the same time, the area of inconsistency gradually expands and the value of inconsistency increases. The value of 1.4° C under RCP4.5 over some regions increases to 1.8° C for TXx under RCP8.5; the value of 1.8° C over some regions becomes greater than 2.0° C for TNn in 2046-65; the value in the upper region of the Yangtze River can be greater than 100 mm for R95p; and the value in the Tarim Basin, Xinjiang, can be up to 55 days for CDD in 2046-65.
This paper projects the changes over China of four extreme climate indices in the early (2016-35), middle (2046-65), and latter (2080-99) parts of the 21st century under different RCP scenarios based on CMIP5 multi- model simulations and analyzes their uncertainty. The conclusions of the study can be summarized as follows:
1) TXx and TNn are projected to increase in the 21st century under all RCPs, with the increase in TNn being larger than that of TXx. In 2025, TXx and TNn increase by 1° C and 1.2° C, respectively. R95p increases significantly and CDD decreases significantly in 2025. R95p increases by 20 mm and CDD decreases by two to three days, relative to 1986-2005.
2) TXx and TNn show similar warming levels in the 21st century over different regions of China relative to 1986-2005. The largest warming for TXx occurs in NWC, NC, NEC, and CC, while the warming for TNn is different in the eight sub-regions. The change in R95p is most significant in SWC2, SC, EC, and NWC. CDD decreases, and more significant change occurs under higher emissions scenarios.
3) The analysis of multi-model standard deviations indicates that greater inconsistency can be found in those regions where high and low temperatures are likely to happen for TXx and TNn, respectively. For the projection of R95p and CDD, greater inconsistency can be found in most of the southern regions and in the basins of Xinjiang. The uncertainty ranges in the extreme climate indices are different under different emissions scenarios. Furthermore, with temporal evolution, the level of uncertainty increases.
| [1] |
|
| [2] |
|
| [3] |
|
| [4] |
|
| [5] |
|
| [6] |
|
| [7] |
|
| [8] |
|
| [9] |
|
| [10] |
|
| [11] |
|
| [12] |
|
| [13] |
|
| [14] |
|
| [15] |
|
| [16] |
|
| [17] |
|