

Projected Climate Change against Natural Internal Variability over China
[JIANG Jiang1, 2, 4  , SUI Yue
1, 4 , LANG Xian-Mei1, 3 ]
, SUI Yue|
|


The ability of 42 Coupled Model Intercomparison Project Phase 5 (CMIP5) models in simulating the annual and seasonal temperature and precipitation over China is first examined by using their historical experiments for 1986-2005, and then 39 relatively reliable models are chosen to project temperature and precipitation changes against the natural internal variability over the country under the Representative Concentration Pathways (RCP) scenarios in the 21st century. The result shows the temperature continuing to increase, especially in northern China. The annual warming for 2081-2099 relative to 1986-2005 over the whole of the country is larger than the background variability, with the multi- model median changes under RCP2.6, RCP4.5, RCP6.0, and RCP8.5 being 9.9, 19.3, 22.8, and 35.9 times greater than one standard deviation of internal variability, respectively. The annual precipitation is projected to increase by 6.1%, 9.3%, 9.6%, and 16.2% for 2081-2099 relative to 1986-2005 under RCP2.6, RCP4.5, RCP6.0, and RCP8.5 respectively, while large changes with high model agreement only occur over the northern Tibetan Plateau and Northeast China, which is mainly due to the robust changes in winter and spring under RCP6.0 and RCP8.5.
China has experienced surface warming, with a temperature increase of 0.78° C (0.51-1.05° C) for the period 1906-2005 (Ding et al., 2007; Tang et al., 2009), which is slightly higher than the accompanying global warming of 0.74° C (0.56-0.92° C) (Intergovernmental Panel on Climate Change (IPCC), 2007). In general, there is no significant trend for annual precipitation in China, but it does show distinctive regional and seasonal patterns (Zhai et al., 2005), such as the southern-flood-northern-drought pattern in eastern China related directly to the weakening of the East Asian summer monsoon (Wang, 2001; Jiang and Wang, 2005; Ding et al., 2009).
To cope with anthropogenic climate change, interest has grown regarding climate projection. Such projection depends on emissions scenarios (including emissions of greenhouse gases and aerosols into the atmosphere) and other natural and anthropogenic forcings. Numerical experiments undertaken by global climate models (GCMs) forced with future scenarios together comprise the primary method for estimating the trend and variability of future climate (Kharin et al., 2007). The Coupled Model Intercomparison Project Phase 5 (CMIP5) presents an unprecedented level of information on which to base projections, including new earth system models with a more complete representation of forcings (Taylor et al., 2012), new Representative Concentration Pathway (RCP) scenarios (Meinshausen et al., 2011), and more output available for analysis. Several studies have been conducted into analyzing future climate changes over China using multiple CMIP5 GCMs (e.g., Jiang and Tian, 2013; Lang and Sui, 2013; Chen et al., 2014; Zhou et al., 2014). These studies project that temperature and precipitation will increase in the 21st century, with a generally larger magnitude in northern China than in southern China (e.g., Xu and Xu, 2012a, b). However, previous projections have focused mainly on the change in climatology using a selection of CMIP5 GCMs. Little attention has been given to the significance of climate change signals relative to the natural internal variability (Sui et al., 2014). Within this context, the present study analyzes the climate change in China for the 21st century using all currently available CMIP5 GCMs, with emphasis on climate changes relative to the background natural variability.
The GCM data of surface air temperature at 2 m and precipitation are derived from 42 CMIP5 GCMs for historical experiments and four sets of RCP experiments available online at http://pcmdi9.llnl.gov. The four RCPs include one mitigation scenario leading to a very low forcing level (RCP2.6), two medium stabilization scenarios (RCP4.5 and RCP6.0), and one very high baseline emissions scenario (RCP8.5) (van Vuuren et al., 2011). Basic information on the 42 GCMs and their experiments is provided in Table 1. The China Region 05.1 (CN05.1)
observational dataset, based on 2416 meteorological stations, is used to evaluate the ability of the GCMs in simulating the climatology over China for 1986-2005 (Wu and Gao, 2013).
| Table 1 Information on the 42 CMIP5 models and their experiments, in which “ * ” denote the models with the length of the pre-industrial control run being at least 500 years, “ √ ” denotes the period 2006-2100, and “ × ” denote the period 2006-2009 for EC-EARTH, 2006-2035 for HadCM3 and MIROC4h, and 2006-2099 for HadGEM2-AO and HadGEM2-ES. |
| Table 1 (Continued) |
Considering the natural internal variability of a climate system occurs in the absence of external forcings (Deser et al., 2012; Hawkins and Sutton, 2012), the present internal variability of temperature and precipitation is obtained based on 27 GCMs with the length of the pre-industrial control simulation being at least 500 years. The first 100 years of the pre-industrial control run are not used to exclude the influence of initial conditions. The natural variability is calculated as the standard deviation of non-overlapping 20-year means after a quadratic fit is subtracted at every grid point to eliminate model drift (Collins et al., 2013). This is multiplied by the square root of 2, a factor that arises as the comparison is between two distributions of numbers. The median across all models of that quantity is used. In our work, regions where the multi-GCM median change exceeds two standard deviations of internal variability, and where at least 90% of the GCMs agree on the sign of change, are interpreted as ‘ large change with high model agreement’ ; and regions where the median change is less than one standard deviation of internal variability are interpreted as ‘ small signal or low agreement of models’ (Collins et al., 2013). In addition, based on the range of the horizontal resolutions of 42 GCMs, all the above data are re-gridded to a relatively mid-range horizontal grid resolution of 2° × 2° using a bilinear interpolation algorithm, which is roughly the average resolution of all the GCMs.
To quantitatively evaluate the capability of the 42 GCMs, spatial correlation coefficients (SCCs) and the centered root-mean-square error (RMSE) of annual and seasonal temperature and precipitation between each baseline simulation and the observation for the period 1986-2005 are calculated on the basis of 240 grid points over continental China. For temperature (precipitation), the SCCs range from 0.85 to 0.98 (0.03 to 0.93), and the centered RMSEs range from 0.19 to 0.67 (0.46 to 1.86). Since the abilities of the GCMs differ from one another, two thresholds are set to identify reliable GCMs. First, the SCCs must be positive and statistically significant at the 99% confidence level, and second, the RMSEs must be smaller than 1.5. For temperature, all GCMs pass the two criteria; where precipitation is concerned, BNU-ESM, FIO-ESM, and MIROC-ESM are excluded accordingly. Thus, a total of 39 GCMs are used in the subsequent analysis. Of note is that, compared with observation, the median of the 39 CMIP5 GCMs reproduces the spatial pattern and variability of climatological temperature and precipitation over China reasonably well. Nevertheless, there are still biases, such as cold biases over most of China, excessive precipitation on the Tibetan Plateau and northern East China, and underestimated precipitation in southeastern China and parts of Xinjiang.
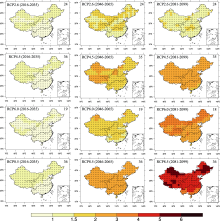
The annual temperature over China is projected to continue to increase in the 21st century under all four RCPs, with warming in northern China being larger than in southern China (Fig. 1). Relative to 1986-2005, the increases of annual temperature for 2016-2035 under the four RCPs are close to each other, with regional averages of 1.0° C, 1.0° C, 0.9° C, and 1.1° C under RCP2.6, RCP4.5, RCP6.0, and RCP8.5, respectively. The magnitude of the warming becomes stronger as the radiative forcing increases, with regional averages of 1.5° C, 1.9° C, 1.7° C, and 2.6° C (1.4° C, 2.5° C, 3.0° C, and 4.7° C) under RCP2.6, RCP4.5, RCP6.0, and RCP8.5 for 2046-2065 (2081-2099), respectively. For 2016-2035, large annual temperature change with high model agreement occurs over most of China under all four RCPs. For 2081-2099, the medians of the annual changes are 9.9, 19.3, 22.8, and 35.9 times greater than one standard deviation of their internal variability under RCP2.6, RCP4.5, RCP6.0, and RCP8.5, respectively.
 | Figure 1 Multi-model median of annual temperature changes (units: ° C) relative to 1986-2005 for 2016-2035, 2046-2065, and 2081-2099 under RCP2.6, RCP4.5, RCP6.0, and RCP8.5, respectively. Stippling indicates regions where the median change is greater than two standard deviations of internal variability and where at least 90% of models agree on the sign of change. Blank space indicates regions where the median change is between one and two standard deviations of internal variability. The number in the top-right corner indicates how many chosen models were available. |
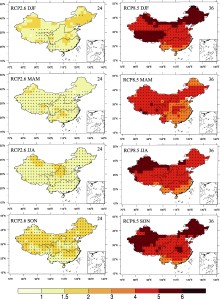
On the seasonal scale, large-scale warming patterns resemble the annual mean under all RCPs, and the warming also becomes stronger as the radiative forcing increases. However, for 2081-2099, a large temperature increase with high model agreement under RCP2.6 only occurs in the southeastern Tibetan Plateau in winter, while it appears over most of China in the other seasons (Fig. 2). Under RCP8.5, it occurs over the whole country during 2081-2099 for all seasons.
 | Figure 2 Multi-model median of seasonal temperature changes (units: ° C) relative to 1986-2005 for 2081-2099 under RCP2.6 and RCP8.5. Stippling indicates regions where the median change is greater than two standard deviations of internal variability and where at least 90% of models agree on the sign of change. Blank space indicates regions where the median change is between one and two standard deviations of internal variability. The number in the top-right corner indicates how many chosen models were available. |
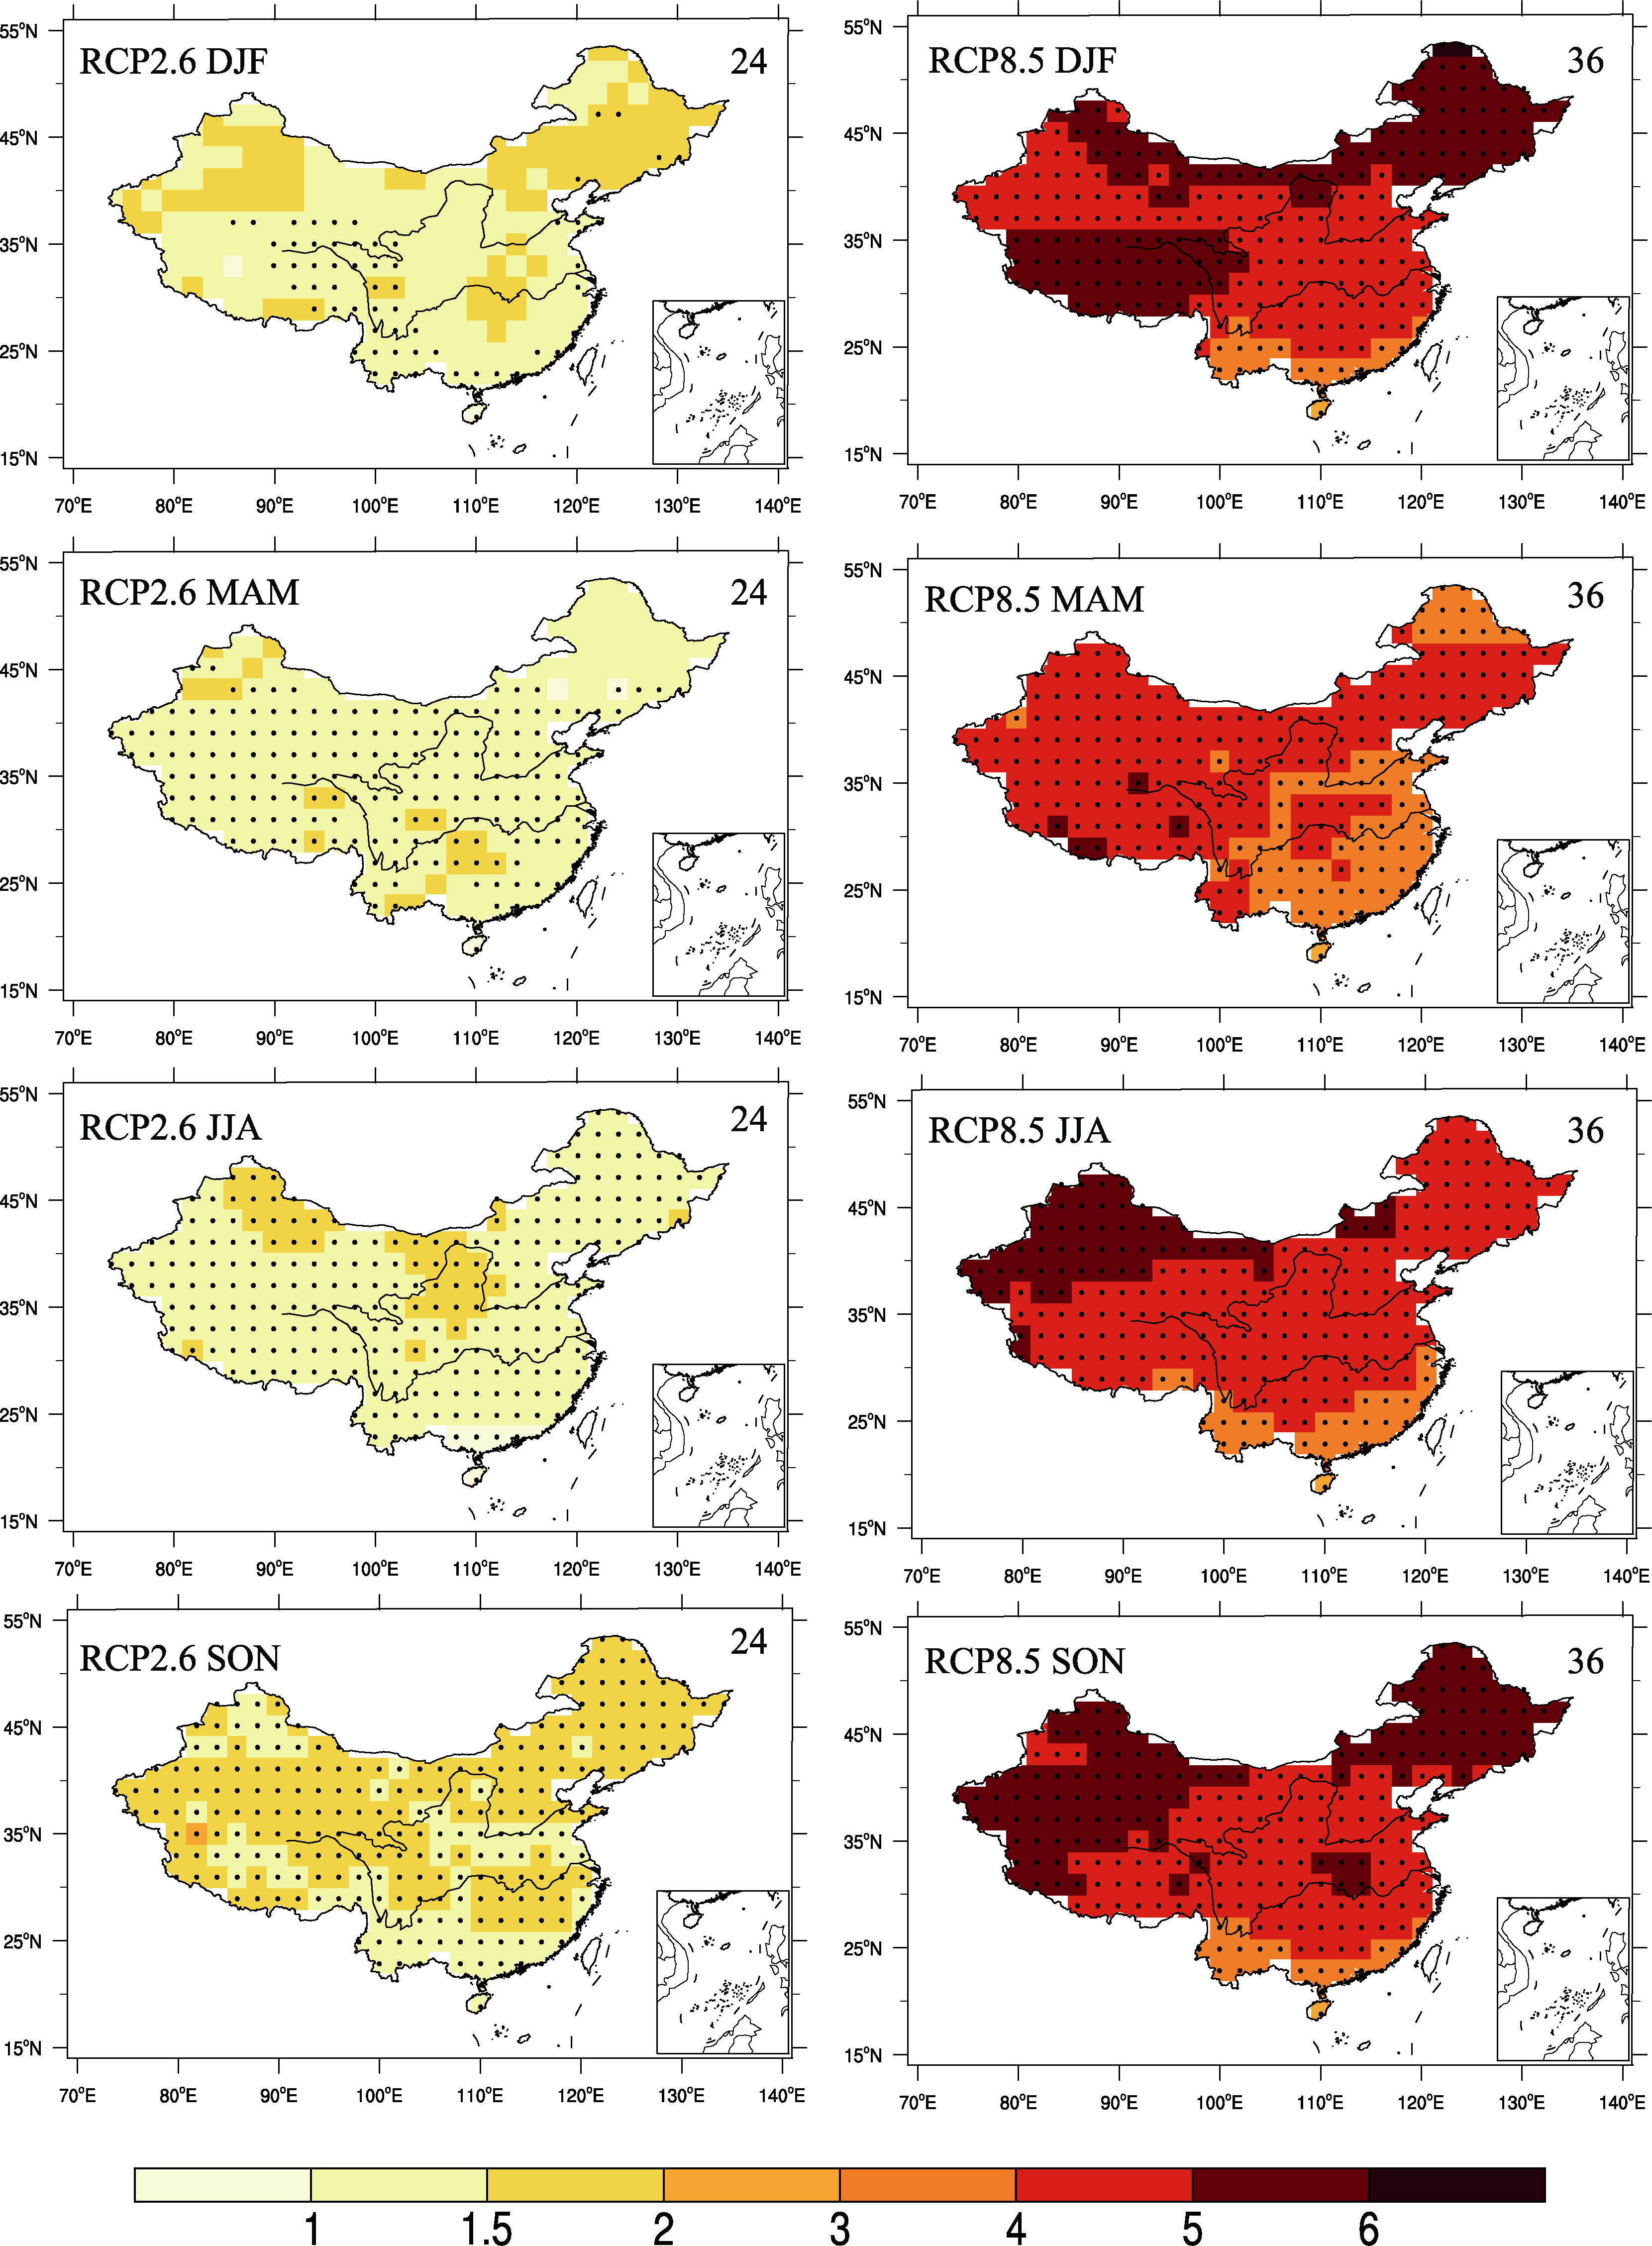
The annual precipitation amount is projected to increase in the 21st century in most of China, and the magnitude of the changes becomes larger with increasing radiative forcing, especially in northern China (Fig. 3). Quantitatively, the increases of annual precipitation over China for 2016-2035 range from 2.5% to 3.5% under the four RCPs. For 2046-2065 (2081-2099), the regional averages of changes in annual precipitation are 6.2%, 6.5%, 5.3%, and 8.4% (6.1%, 9.3%, 9.6%, and 16.2%) under RCP2.6, RCP4.5, RCP6.0, and RCP8.5, respectively.
 | Figure 3 Multi-model median of the percentage change in annual precipitation (units: %) relative to 1986-2005 for 2016-2035, 2046-2065, and 2081-2099 under RCP2.6, RCP4.5, RCP6.0, and RCP8.5, respectively. Stippling indicates regions where the median change is greater than two standard deviations of internal variability and where at least 90% of models agree on the sign of change. Blank space indicates regions where the median change is between one and two standard deviations of internal variability, and the crosses indicate regions where the median change is less than one standard deviation of internal variability. The number in the top-right corner means how many chosen models were available. |
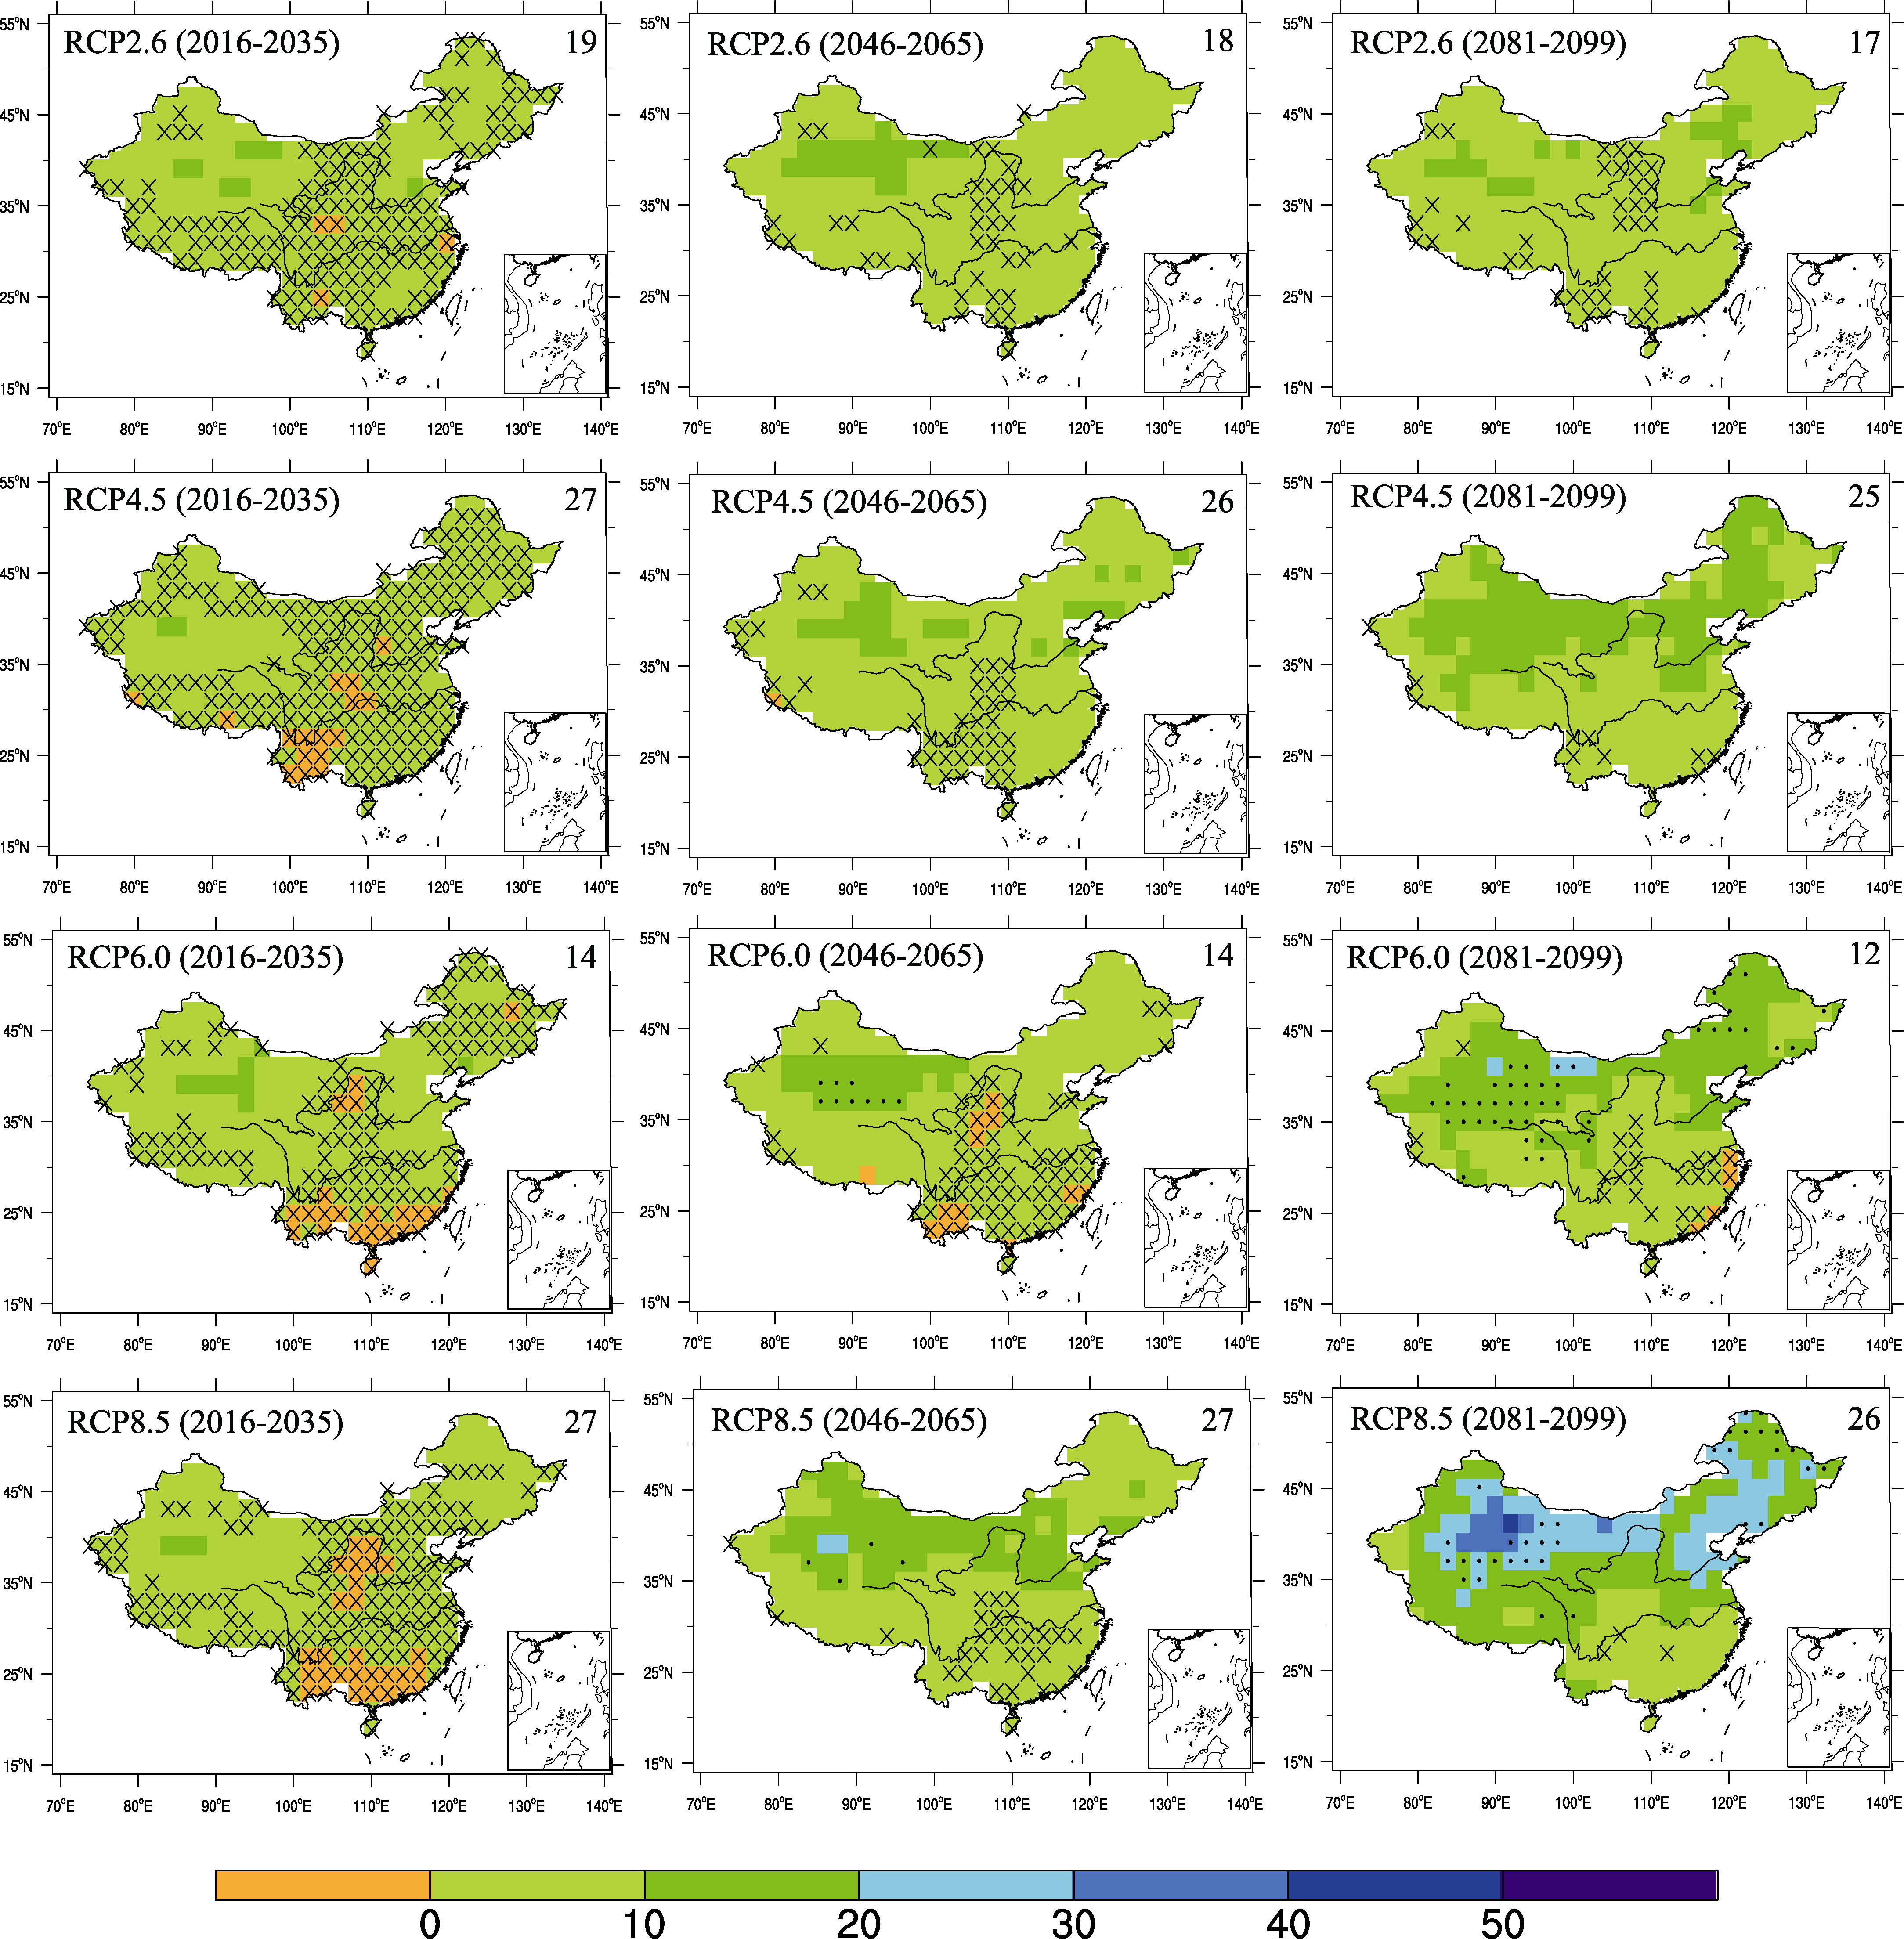
As indicated by the crosses in Fig. 3, a small signal or low agreement of models appears over most of the country under the four RCPs for 2016-2035. For 2046-2065, a small signal or low agreement of models is less apparent than for 2016-2035, and mainly appears in central and eastern China. A large annual precipitation change with high model agreement occurs in the northern Tibetan Plateau under RCP6.0 and RCP8.5. For 2081-2099, parts of central and eastern China still have a small signal or low agreement of models under the low and middle radiative forcing, while a large annual precipitation increase with high model agreement occurs in the northern Tibetan Plateau and the northern margin of Northeast China under the RCP6.0 and RCP8.5 scenarios (Fig. 3). For 2081- 2099, the medians of annual precipitation changes are 1.6, 2.3, 2.7, and 4.0 times greater than one standard deviation of their internal variability under RCP2.6, RCP4.5, RCP6.0, and RCP8.5, respectively. Seasonally, under the low and high radiative forcing, large-scale precipitation increases occur in China for 2081-2099, especially in northern China, but decreases in the central of East China in winter under RCP 8.5 (Fig. 4). A large change with high model agreement does not appear in any of the fourseasons under the RCP2.6 scenario. By contrast, it occurs in winter in parts of Xinjiang, Northeast China, and the northeastern Tibetan Plateau, and in spring in the northeastern Tibetan Plateau under the RCP8.5 scenario. For precipitation, a discrepancy exists between the observation and GCM simulations in East Asia, which need downscaling (Yu et al., 2010). Furthermore, the results from downscaling differ with GCMs (Gao et al., 2013).
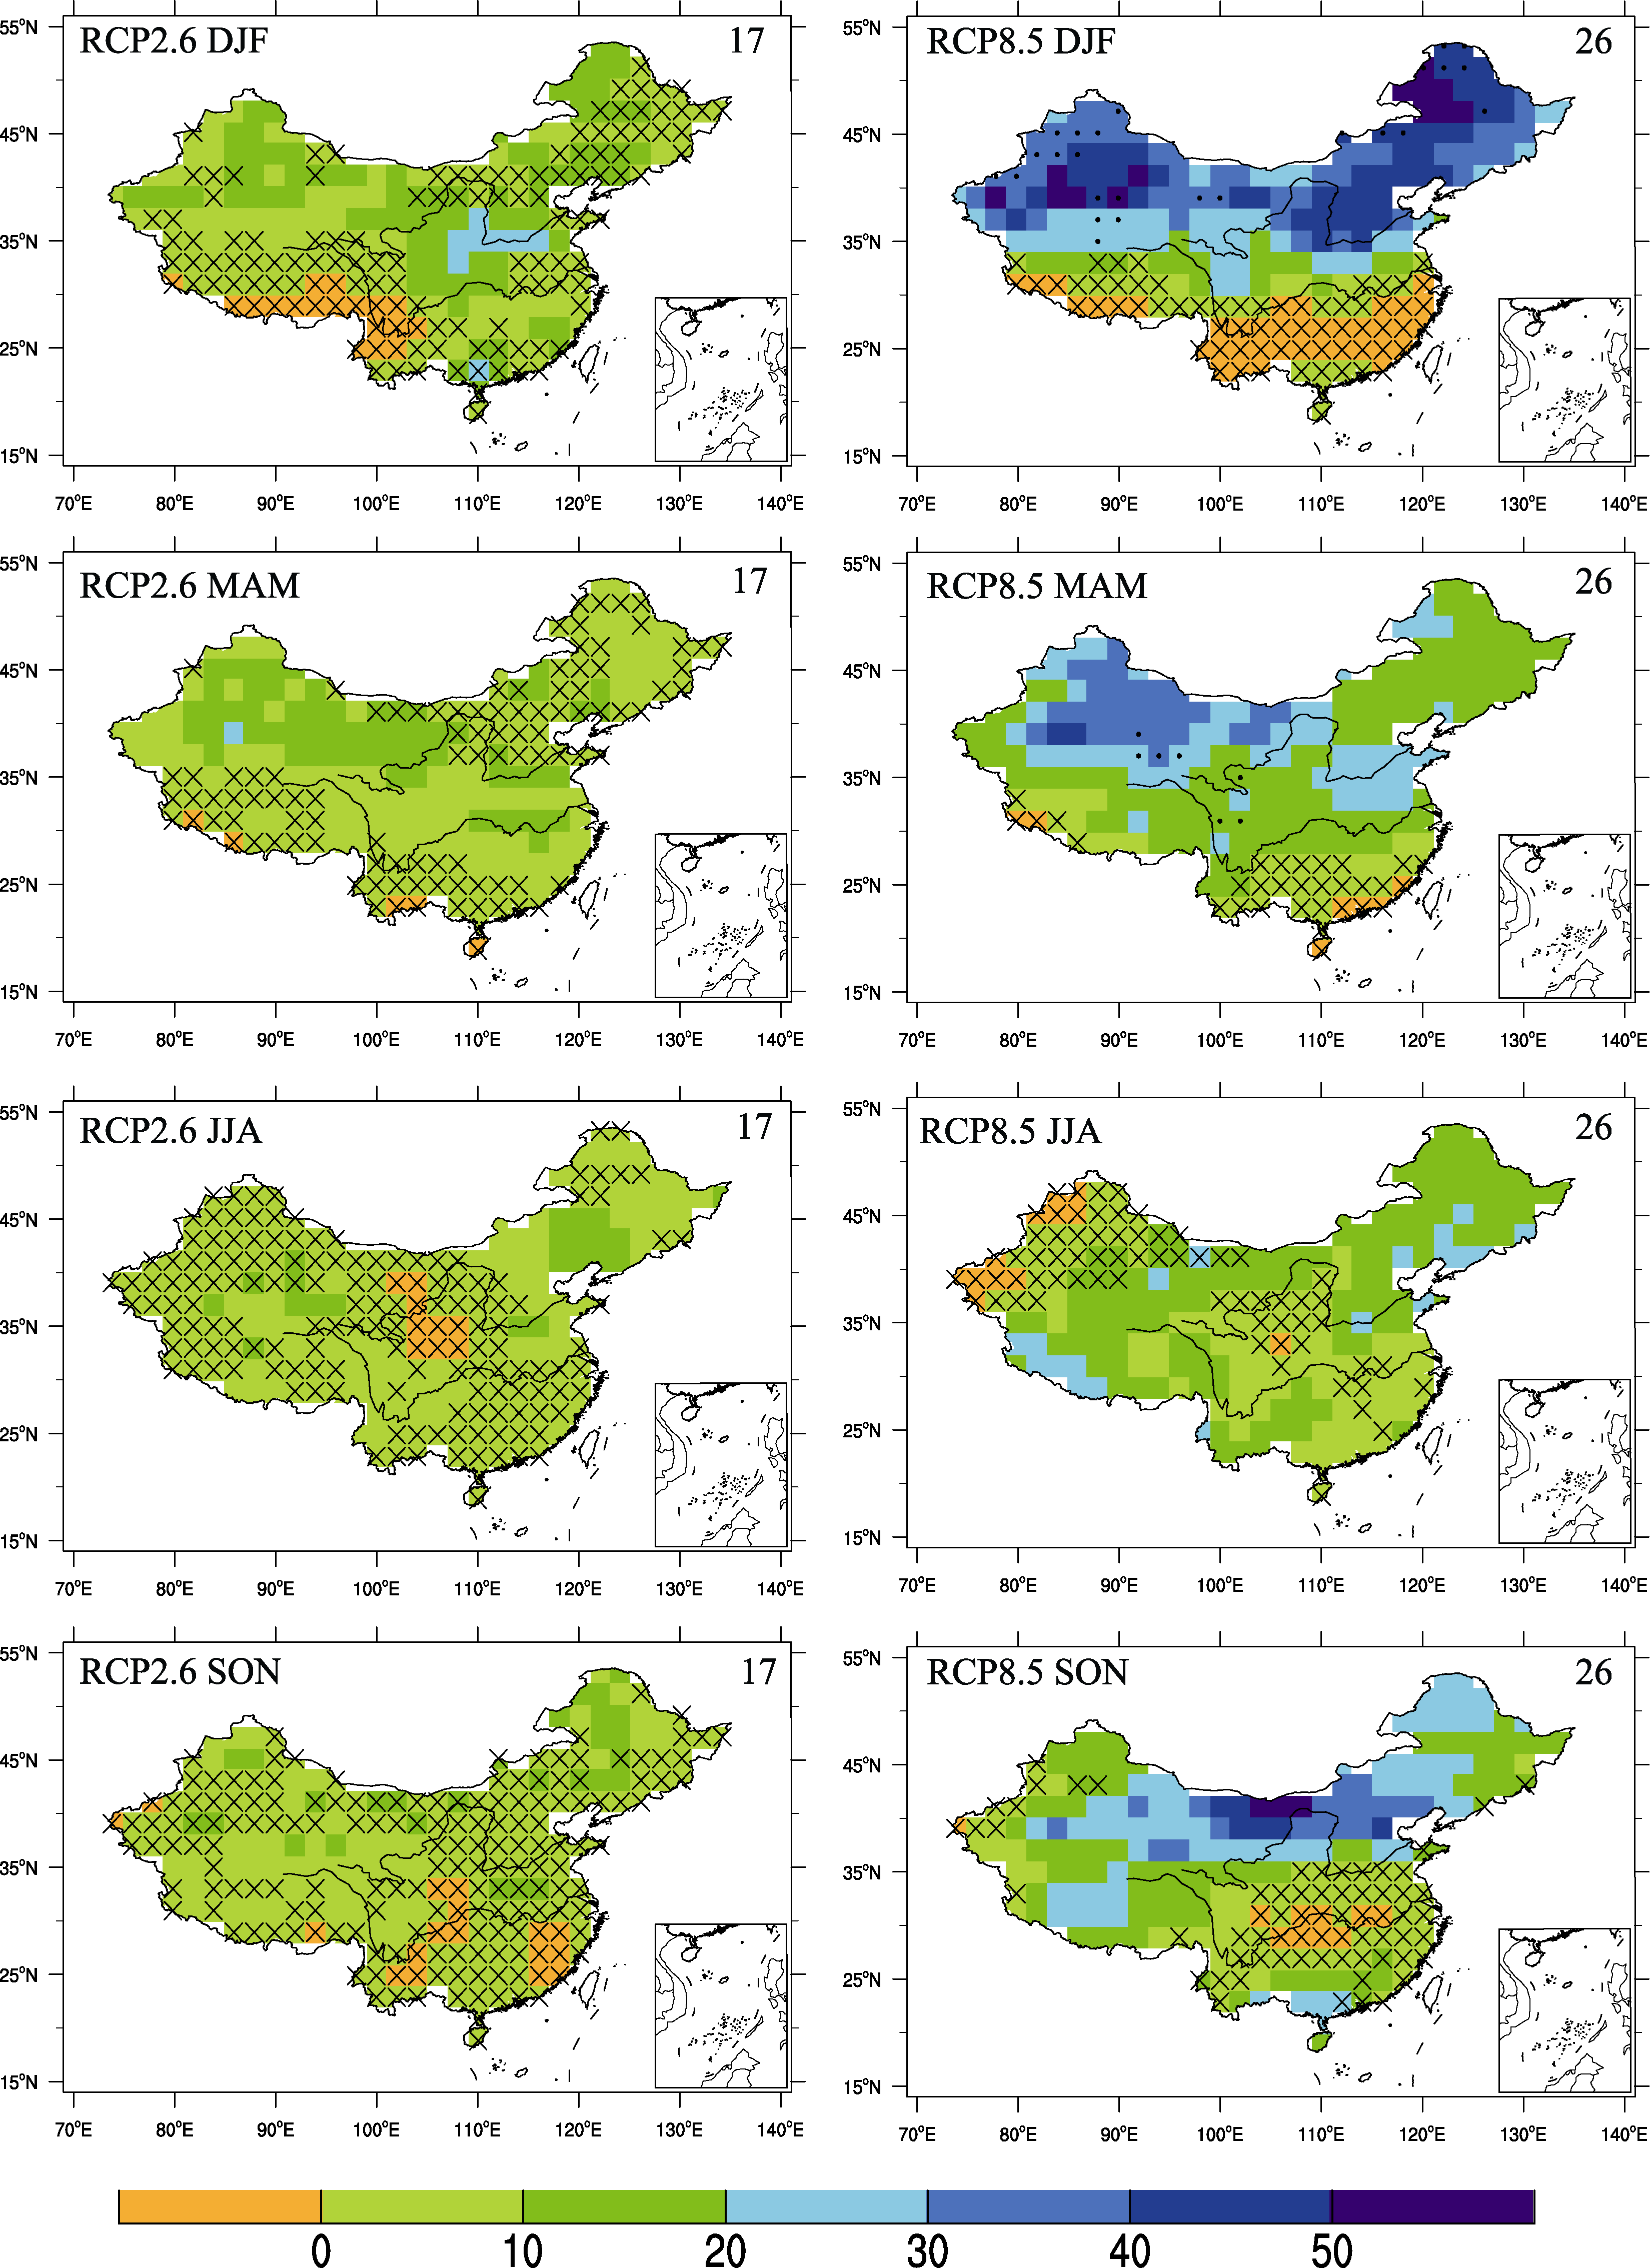 | Figure 4 Multi-model median of the percentage change in seasonal precipitation (units: %) relative to 1986-2005 for 2081-2099 under RCP2.6 and RCP8.5. Stippling indicates regions where the median change is greater than two standard deviations of internal variability and where at least 90% of models agree on the sign of change. Blank space indicates regions where the median change is between one and two standard deviations of internal variability, and the crosses indicate regions where the median change is less than one standard deviation of internal variability. The number in the top-right corner means how many chosen models were available. |
This study uses 39 relatively reliable CMIP5 GCMs to project changes of temperature and precipitation against natural internal variability over China in the 21st century under four RCPs. The primary conclusions are as follows:
(1) China is projected to experience an overall increase in both temperature and precipitation under the RCPs relative to 1986-2005, and those changes vary with region and season to a certain degree and are larger in the north than in the south of the country.
(2) Large changes with high model agreement of annual temperature cover the whole of China since the beginning of this century. The medians of annual temperature changes for 2081-2099 under RCP2.6, RCP4.5, RCP6.0, and RCP8.5 are 9.9, 19.3, 22.8, and 35.9 times greater than one standard deviation of internal variability, respectively. In winter, large changes with high model agreement for 2081-2099 appear only in the southeastern Tibetan Plateau under RCP2.6, while they cover the whole country in all seasons under RCP8.5.
(3) The large changes with high model agreement of annual precipitation occur in the northern Tibetan Plateau and Northeast China for 2046-2065 and 2081-2099 under both RCP6.0 and RCP8.5, which is mainly due to the robust changes in winter and spring. The medians of annual precipitation changes are 1.6, 2.3, 2.7, and 4.0 times greater than one standard deviation of internal variability under RCP2.6, RCP4.5, RCP6.0, and RCP8.5, respectively.
| [1] |
|
| [2] |
|
| [3] |
|
| [4] |
|
| [5] |
|
| [6] |
|
| [7] |
|
| [8] |
|
| [9] |
|
| [10] |
|
| [11] |
|
| [12] |
|
| [13] |
|
| [14] |
|
| [15] |
|
| [16] |
|
| [17] |
|
| [18] |
|
| [19] |
|
| [20] |
|
| [21] |
|
| [22] |
|
| [23] |
|
| [24] |
|