
Seasonal Prediction Assessment of the South Asian Summer Monsoon: ENSEMBLES versus DEMETER
[TIAN Bao-Qiang1  , FAN Ke
1, 2 ]
, FAN Ke|
|


The seasonal forecasting skill with respect to the South Asian summer monsoon (SASM) was compared between the European Commission FP7 project (ENSEMBLES) and the Development of a European Multimodel Ensemble System for Seasonal to Interannual Prediction project (DEMETER). The Webster-Yang index (WYI) was chosen to represent the intensity of the SASM. First, the authors compared the ability to forecast the zonal wind at 850 hPa ( U850) and 200 hPa ( U200) between ENSEMBLES and DEMETER models. The results indicated that the models from the European Centre for Medium-Range Weather Forecasts, International Organization (ECMWF) and UK Met Office (UKMO) in ENSEMBLES possess greater skill in seasonally forecasting the JJA (June, July, and August) U850, U200, and U850 minus U200 than in DEMETER. Compared to in DEMETER, the JJA U200 and U850 minus U200 forecasting skill was greater for the model from Météo- France (MF) in ENSEMBLES over most of the SASM region. The three coupled models (ECMWF, MF, and UKMO), especially the UKMO model in ENSEMBLES, all demonstrated improved skill in their seasonal forecasts compared to in DEMETER with respect to the interannual variability of the SASM. The three ENSEMBLES models also showed better ability in forecasting the sea surface temperature anomalies (SSTAs) over the eastern equatorial Pacific and North Indian Ocean, and more accurately reproduced the large-scale atmospheric circulation and precipitation over northern India, which are related to the SASM. It seems that the couple between the atmospheric system and external forcing of ENSMBLES over Indian Ocean and Pacific is better than that of DEMETER.
Improvements in the seasonal forecasting of the South Asian summer monsoon (SASM) could help ameliorate the related economic losses experienced in many South Asian countries, where agriculture and hydroelectric power generation are dependent on the intensity of summer monsoon. Therefore, the accurate prediction of the SASM is an important research topic.
Climate models have played a key role in the seasonal forecasting of summer monsoon. During the past several decades, most climate models have been developed to simulate the global climate, and thus they are less able to reproduce the observed interannual variability of the seasonal mean rainfall over the Asian monsoon region (Gadgil and Sajani, 1998; Kang et al., 2002; Fan et al., 2012). However, their collective power, via ensemble-based approaches, is more positive; and among these methods, over the SASM region, the forecasting skill of the multimodel super-ensemble has been found to be superior to that of the ensemble mean (Chakraborty and Krishnamurti, 2006).
Recently, research has focused mainly on the seasonal forecasting of Indian summer monsoon rainfall (Chakraborty and Krishnamurti, 2006; Krishnamurti et al., 2006; Ajayamohan, 2007; Annamalai et al., 2007; Pattanaik and Kumar, 2010). For example, an all-Indian summer rainfall index has been used as a measure of the Indian summer monsoon, and shown to be a good indicator of the strength of Indian summer monsoon rainfall (Parthasarathy et al., 1994). However, such studies have paid little attention to the seasonal forecasting of the large-scale SASM. To describe the variability of the large-scale SASM, Webster and Yang (1992) used a atmospheric circulation index defined by the time-mean zonal wind vertical shear between 850 hPa and 200 hPa, averaged in the region (0° -20° N, 40-110° E) (hereafter referred to as the ‘ WYI’ , i.e., the Webster-Yang Index). The WYI successfully represents the strength of both the low-level (850 hPa) westerly jet and upper-level (200 hPa) easterly jet (Wang and Fan, 1999). Indeed, the National Centers for Environmental Prediction Climate Forecast System has been shown to perform better in predicting the large-scale monsoon when measured by the WYI, as compared to other regional monsoon components (Yang et al., 2008b).
The global multimodel ensemble (MME) reforecast dataset created within the European Commission (EC) FP7 project called ENSEMBLES (Weisheimer et al., 2009) is a new version of the dataset developed during the Development of a European Multimodel Ensemble System for Seasonal to Interannual Prediction (DEMETER) project (Palmer et al., 2004). Probabilistic skill scores show higher skill for ENSEMBLES than for DEMETER in the 4-6-month forecast range (Weisheimer et al., 2009). Alessandri et al. (2010) found that ENSEMBLES results show an overall enhancement in terms of the prediction of anomalous surface temperature conditions compared to DEMETER, but that the improvement is quite small and with considerable spatiotemporal variation.
In this study, we compared results from ENSEMBLES and DEMETER models to examine whether ENSEMBLES shows an appreciable improvement over DEMETER with respect to predicting the SASM. The possible reasons for our findings are discussed.
The DEMETER seasonal forecast initiative comprises of seven global coupled atmosphere-ocean climate models: CERFACS (European Centre for Research and Advanced Training in Scientific Computation, France), ECMWF (European Centre for Medium-Range Weather Forecasts, International Organization), INGV (Istituto Nazionale de Geofisica e Vulcanologia, Italy), LODYC (Laboratoire d'Océ anographie Dynamique et de Climatologie, France), MF (Centre National de Recherches Mé té orologiques, Mé té o-France, France), UKMO (UK Met Office), and MPI (Max-Planck-Institut fü r Meteorologie, Germany) (Palmer et al., 2004). The ENSEMBLES consists of five dynamical models from UKMO, MF, ECMWF, the Leibniz Institute of Marine Sciences at Kiel University (IFM-GEOMAR), and the Euro-Mediterranean Centre for Climate Change (CMCC-INGV) in Bologna (Weisheimer et al., 2009). For each year, six months seasonal forecasts of the DEMETER and seven months seasonal forecasts of the ENSEMBLES were started from 1 February, 1 May, 1 August, and 1 November initial conditions. Each model hindcast comprises an ensemble of nine members. Compared with the DEMETER models, the ENSEMBLES models have improved in all aspects: in their subgrid physical processes, by including additional components (e.g., sea-ice or land-surface modules) and interannual variability in the greenhouse gas forcing; in horizontal and vertical resolution and in the ocean initial conditions (Weisheimer et al., 2009; Alessandri et al., 2010).
The common hindcast periods of the DEMETER project consists of three modes over the period 1959-2001 and seven models over the period 1980-2001. The hindcast period of the ENSEMBLES covers the period 1960-2005. In this study, the three atmosphere-ocean global coupled models with a longer hindcast covering the same period between 1960 and 2001, selected in the ENSEMBLES and DEMETER projects are ECMWF, MF, and UKMO. The JJA (June, July, and August) seasonal mean and interannual variability of the SASM in ENSEMBLES and DEMETER for 42 years (1960-2001) using the initial conditions of May were analyzed.
Monthly atmospheric reanalysis data with 2.5° × 2.5° horizontal resolution were derived from the National Centers for Environmental Prediction/National Center for Atmospheric Research (NCEP/NCAR) for the period 1960-2001. Extended reconstructed sea surface temperature (SST) data V3b (resolution: 2.0° × 2.0° ) from the National Oceanic and Atmospheric Administration (NOAA) were also used (Smith et al., 2008). The precipitation was from the NOAA’ s Precipitation Reconstruction Dataset (Chen et al., 2002). To examine the interannual variability of the SASM, the WYI was normalized and the linear trend removed. The reanalysis data were regarded as the observational data in this study.
The ability of the ENSEMBLES MME in terms of the seasonal forecasting of Indian summer monsoon rainfall has already been shown to be significantly improved compared to that of the DEMETER MME (Rajeevan et al., 2012). In the present study, we compared the seasonal forecasting skill of ENSEMBLES and DEMETER with respect to the zonal wind in the SASM region and the WYI.
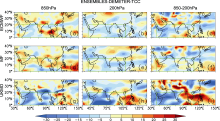
The ability of ENSEMBLES and DEMETER in forecasting the zonal wind at 850 hPa (U850) and 200 hPa (U200) in the SASM region (0° -20° N, 40-110° E) was compared using the time correlation coefficient (TCC) and root-mean-square error (RMSE). Figure 1 shows the TCCs between the predicted and observed JJA zonal wind anomalies difference between ENSEMBLES and DEMETER. In most of the SASM region, the TCCs of U850 between the observed and predicted (ECMWF and UKMO) results from ENSEMBLES were higher than those from DEMETER, especially over the Arabian Sea region (Figs. 1a and 1g). Compared with DEMETER, the TCCs for MF in ENSEMBLES were not significant for JJA U850 over India and the Indochina Peninsula (Fig. 1d). For the forecast of U200, the TCCs of the three coupled models in ENSEMBLES increased significantly over most of the SASM region (Figs. 1b, 1e, and 1h). Because the WYI represents the zonal wind vertical shear between U850 and U200, the TCC differences for U850 minus U200 between the ENSEMBLES and DEMETER models were also plotted (Fig. 1). The TCCs for ENSEMBLES, especially for ECMWF and UKMO, were higher than those for DEMETER in the SASM region.
 | Figure 1 Time correlation coefficients (TCCs) between the predicted and observed June-July-August (JJA) zonal wind anomaly difference between ENSEMBLES and the Development of a European Multimodel Ensemble System for Seasonal to Interannual Prediction project (DEMETER): (a-c) zonal wind at 850 hPa (U850); (d-f) zonal wind at 200 hPa (U200); (g-i) U850 minus U200. The green box is the South Asian summer monsoon (SASM) region. |
The RMSE is also a good indicator of the forecast skill of climate models. Figure 2 shows the percentage of improvement in RMSE for the forecasted JJA zonal wind anomalies between ENSEMBLES and DEMETER. Compared with the ECMWF model in DEMETER, the equivalent results from ENSEMBLES showed some reduction in RMSE for U850, mainly concentrated over the Arabian Sea region (Fig. 2a). For the MF in ENSEMBLES, the RMSEs increased over most of the SASM region (Fig. 2d). As indicated in Fig. 2g, the RMSEs of the UKMO results in ENSEMBLES decreased in the lower-level troposphere over most of the SASM region. The RMSEs of ENSEMBLES for U200 decreased significantly over the SASM region compared to those of DEMETER (Figs. 2b, 2e, and 2h), especially for the UKMO model. The RMSEs in the ENSEMBLES models’ results for U850 minus U200 also decreased over most of the SASM region (Figs. 2c, 2f, and 2i).
 | Figure 2 Root-mean-square error (RMSE) of the predicted JJA zonal wind anomaly difference between ENSEMBLES and DEMETER: (a-c) U850; (d-f) U200; (g-i) U850 minus U200. |
In general, the ECMWF and UKMO in ENSEMBLES showed higher seasonal predictive skill for JJA U850, U200, and U850 minus U200, as compared to DEMETER. The MF model in ENSEMBLES showed lower prediction ability than in DEMETER for JJA U850 over India and the Indochina Peninsula. However, the predictive skill of the MF model for JJA U200 and U850 minus U200 was greater in ENSEMBLES over most of the SASM region.
The ability of ENSEMBLES and DEMETER to forecast the WYI was also investigated. Table 1 shows the TCCs between the predicted and observed WYI. For the period 1960-2001, the TCCs of the three models in DEMETER were 0.36 (ECMWF), 0.57 (MF), and 0.26 (UKMO), with RMSEs of 1.10, 0.91, and 1.18, respectively (Table 1). Therefore, the ECMWF and UKMO models in DEMETER showed lower prediction ability in terms of the interannual variability of the WYI. The TCCs for the WYI of the ECMWF, MF, and UKMO models in ENSEMBLES were 0.47, 0.60, and 0.59, all of which exceeded the 99% confidence level. Meanwhile, the RMSEs in ENSEMBLES decreased by 10% for ECMWF, 3.3% for MF, and 27% for UKMO (Table 1). Hence, the three coupled models, especially the UKMO model in ENSEMBLES, can all provide improved skill in terms of seasonal climate prediction, compared to DEMETER, for the interannual variability of the SASM. To evaluate the seasonal forecast skill of the SASM in early months before summer, we also explored the results of the ENSEMBLES models initiated in February. For the period 1960-2001, the TCCs between the predicted and observed WYI of the three ENSEMBLES models for four-month lead forecasts, were 0.28 (ECMWF), 0.42 (MF), and 0.53 (UKMO), with RMSEs of 1.04, 1.06, and 0.95, respectively. Although the predictive skill of the WYI was lower than that for one-month lead forecast, the MF and UKMO models in ENSEMBLES models initiated in February also showed good predictive ability in terms of the interannual variability of the WYI.
| Table 1 Time correlation coefficients (TCCs) and root-mean-square error (RMSE) of the predicted Webster-Yang index (WYI) derived from the three coupled models in ENSEMBLES and the Development of a European Multimodel Ensemble System for Seasonal to Interannual Prediction project (DEMETER) during 1960-2001. |
To explain the reasons for the improvement in SASM prediction in ENSEMBLES, we investigated the ability to forecast SST anomalies (SSTAs) and the atmospheric circulation related to the SASM. Previous studies have shown that the SASM is influenced by the El Niñ o-Southern Oscillation (ENSO) through the displacement of the Walker circulation (Ropelewski and Halpert, 1987; Nigam, 1994). Most climate models also exhibit a robust ENSO-SASM contemporaneous teleconnection, including the known inverse relationship between ENSO and rainfall variation over India (Annamalai et al., 2007; Fan et al., 2010; Fu and Lu, 2010). In addition, the significant increasing SST trend in the Indian Ocean is another important cause of the weakening of the Indian summer monsoon and South Asian High (SAH), through the atmospheric response of the Matsuno-Gill pattern (Li et al., 2008; Yang and Liu, 2008; Yang et al., 2008a; Krishnamurthy and Kirtman, 2009).
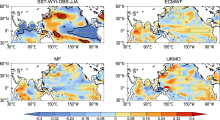
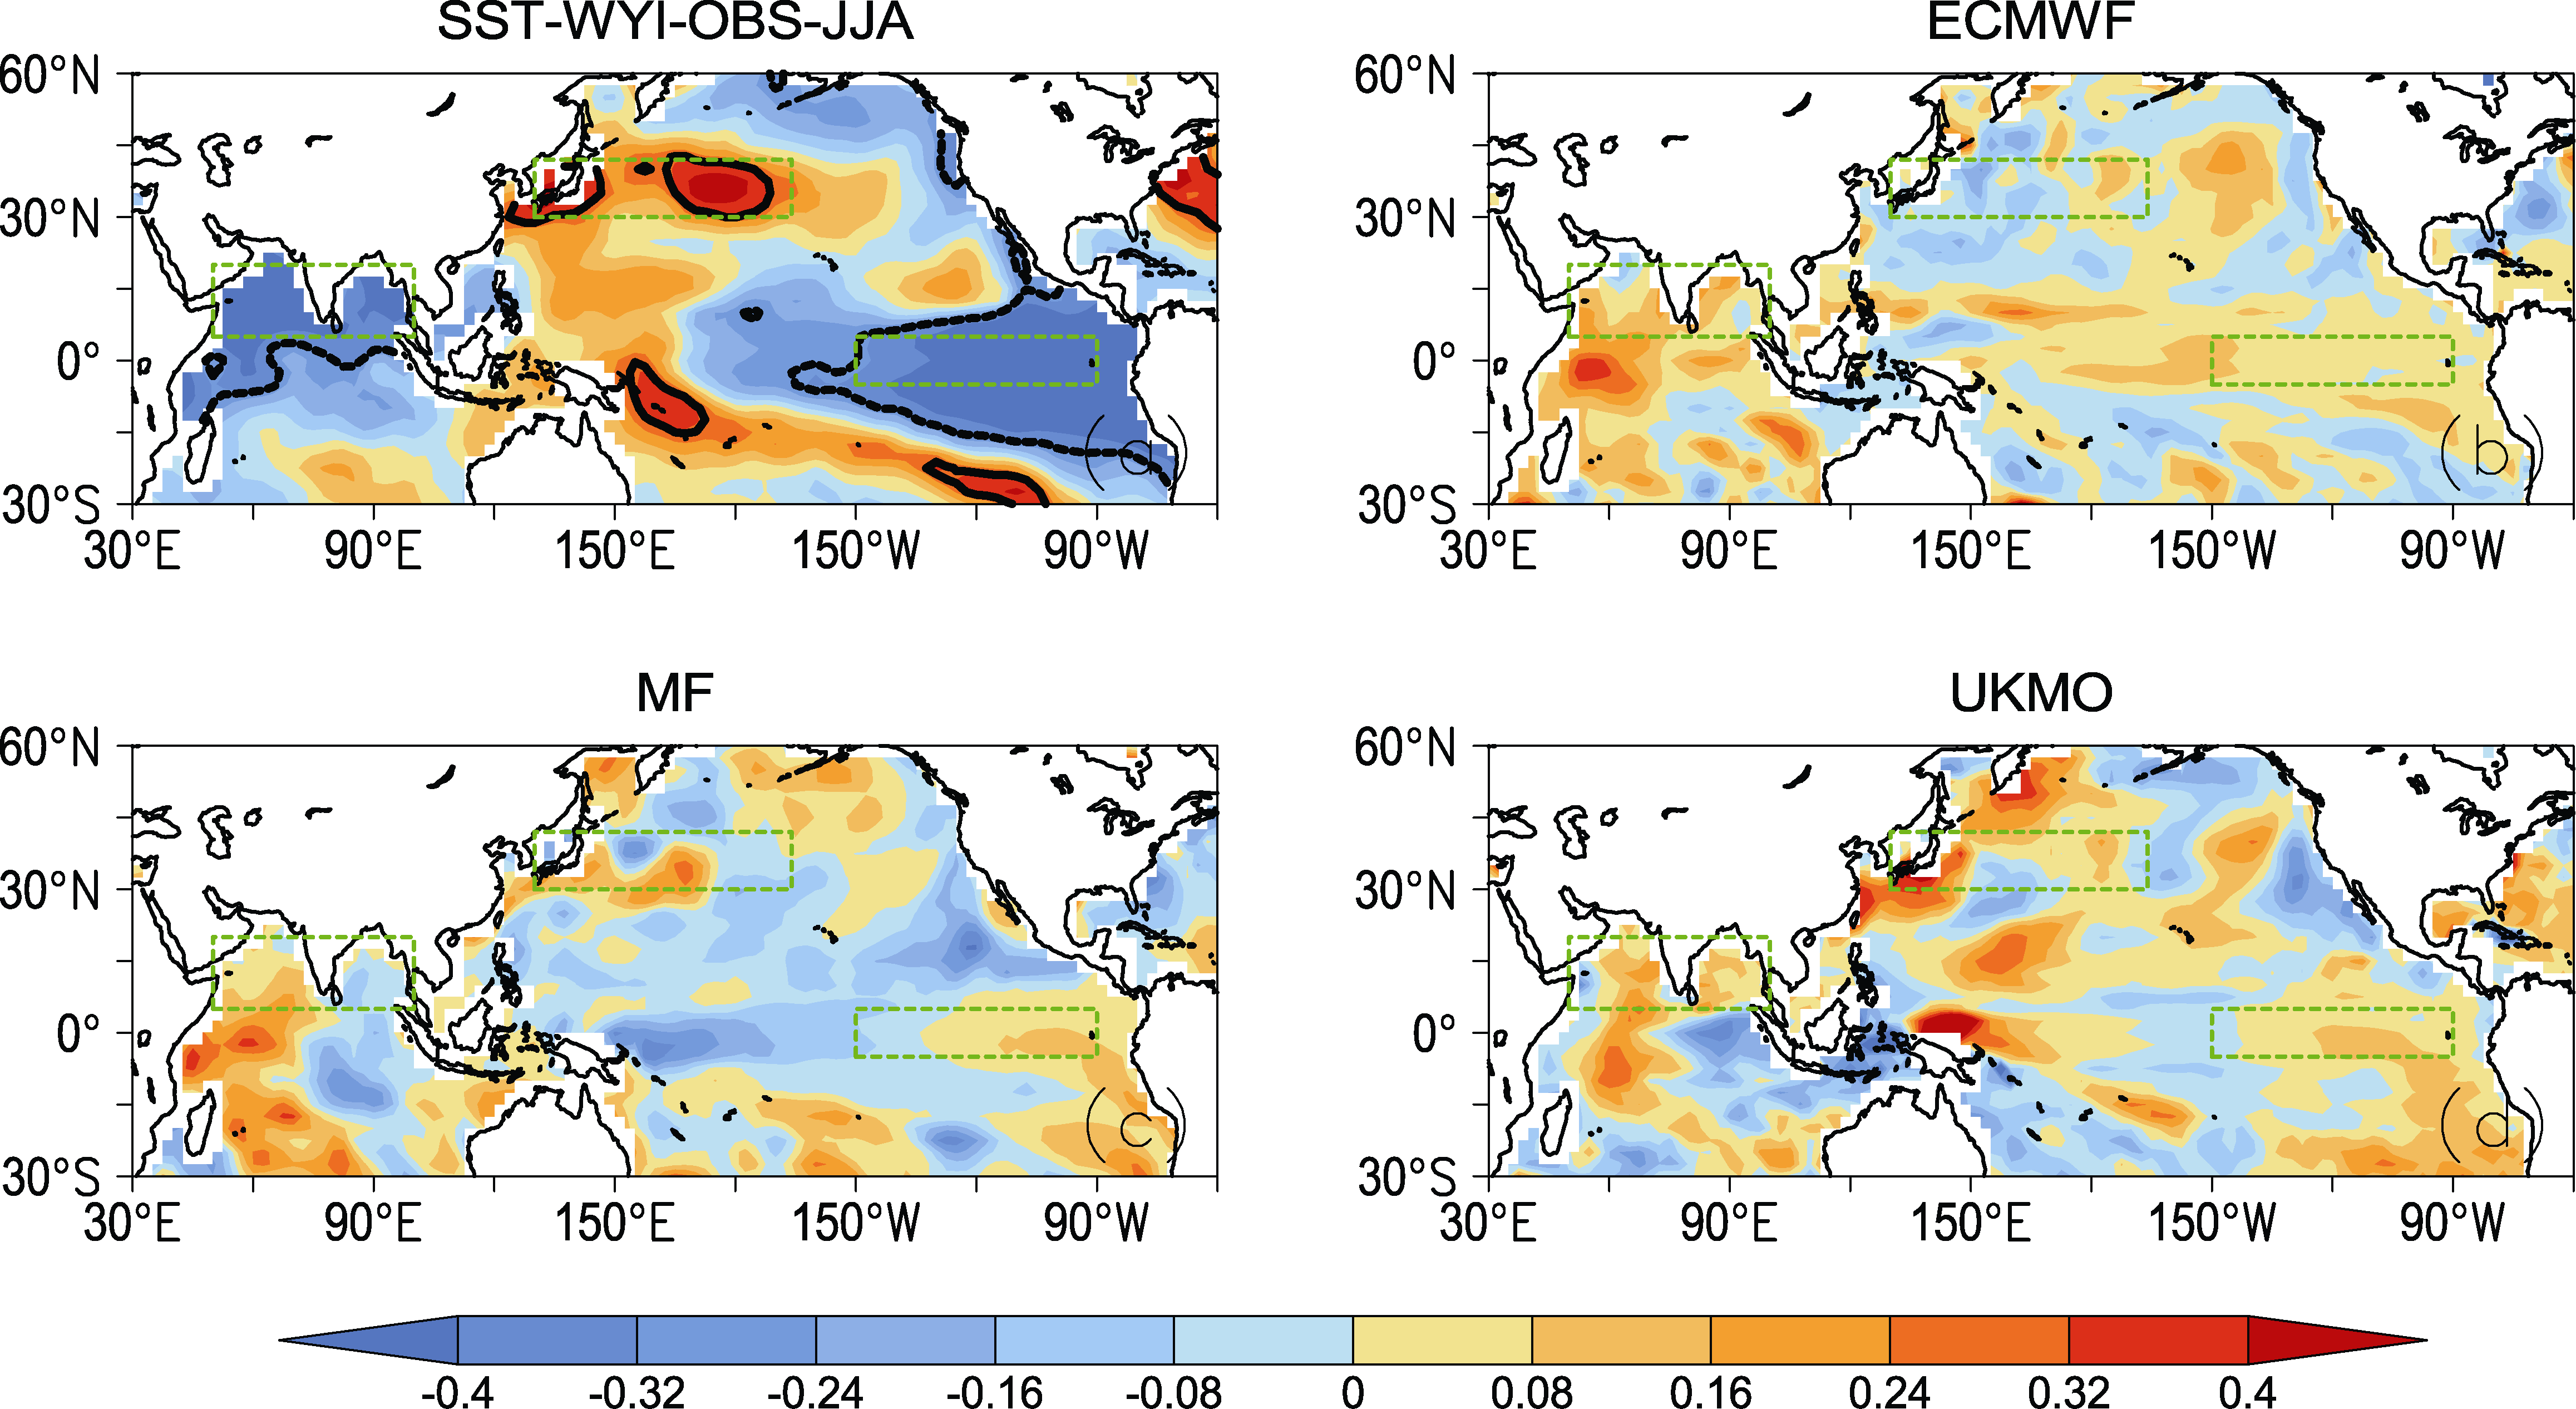 | Figure 3 (a) TCCs between the observed JJA sea surface temperature anomalies (SSTAs) and the observed Webster-Yang index (WYI); and (b-d) the TCCs of the observed JJA SSTAs and the predicted SSTAs difference between ENSEMBLES and DEMETER: (b) ECMWF (the European Centre for Medium-Range Weather Forecasts) model; (c) MF (Mé té o-France) model; (d) UKMO (UK Met Office) model. |
Figure 3a shows the TCCs between the observed JJA SSTAs and the observed WYI. We can see that the interannual variability of the SASM is significantly influenced by the SSTAs in the North Indian Ocean, the western North Pacific Ocean and the eastern equatorial Pacific. The TCCs of the observed JJA SSTAs and the predicted SSTAs difference between the ENSEMBLES and DEMETER models are shown in Figs. 2b-d. The ECMWF and UKMO models in ENSEMBLES showed higher skill than those in DEMETER in terms of reproducing the SSTAs in the North Indian Ocean and the eastern equatorial Pacific (Figs. 2b and 2d). Compared with DEMETER, the MF model in ENSEMBLES better reproduced the SSTAs in the Arabian Sea and most parts of eastern equatorial Pacific. Therefore, we defined two SST indices in JJA: North Indian Ocean index (NIOI) (5-20° N, 50- 100° E) and Niñ o-3 (5° S-5° N, 150-90° W), to investigate the improvement of the relationships between the WYI and SSTAs in the ENSEMBLES models (Fig. 3a). The TCCs between the two observed SST indices and the observed WYI were -0.57 (NIOI) and -0.55 (Niñ o-3). The TCCs between the predicted NIOI and the predicted WYI derived from the three models in ENSEMBLES (DEMETER) were -0.72 (-0.70) for ECMWF, -0.66 (-0.51) for MF, and -0.62 (-0.22) for UKMO (Table 2). Compared with DEMETER, the ENSEMBLES models have the higher skill in reproducing the relationship between the NIOI and WYI. During the period 1960-2001 the TCCs between the predicted Niñ o-3 and the predicted WYI derived from the three models in ENSEMBLES (DEMETER) were -0.33 (-0.16) for ECMWF, -0.52 (-0.63) for MF, and -0.38 (-0.31) for UKMO (Table 2). The ECMWF and UKMO models in DEMETER have the poor skill in reproducing the relationship between the NIOI and WYI. However, the MF in DEMETER provided improved seasonal forecasting skill for this relationship. The relationship between ENSO and the WYI can be more accurately reproduced in the three ENSEMBLES models.
| Table 2 TCCs between the predicted WYI and the predicted North Indian Ocean index (NIOI) and Niñ o-3 index derived from the three coupled models in ENSEMBLES and DEMETER during 1960-2001. |
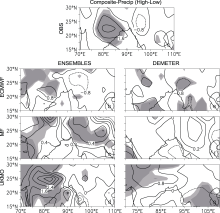
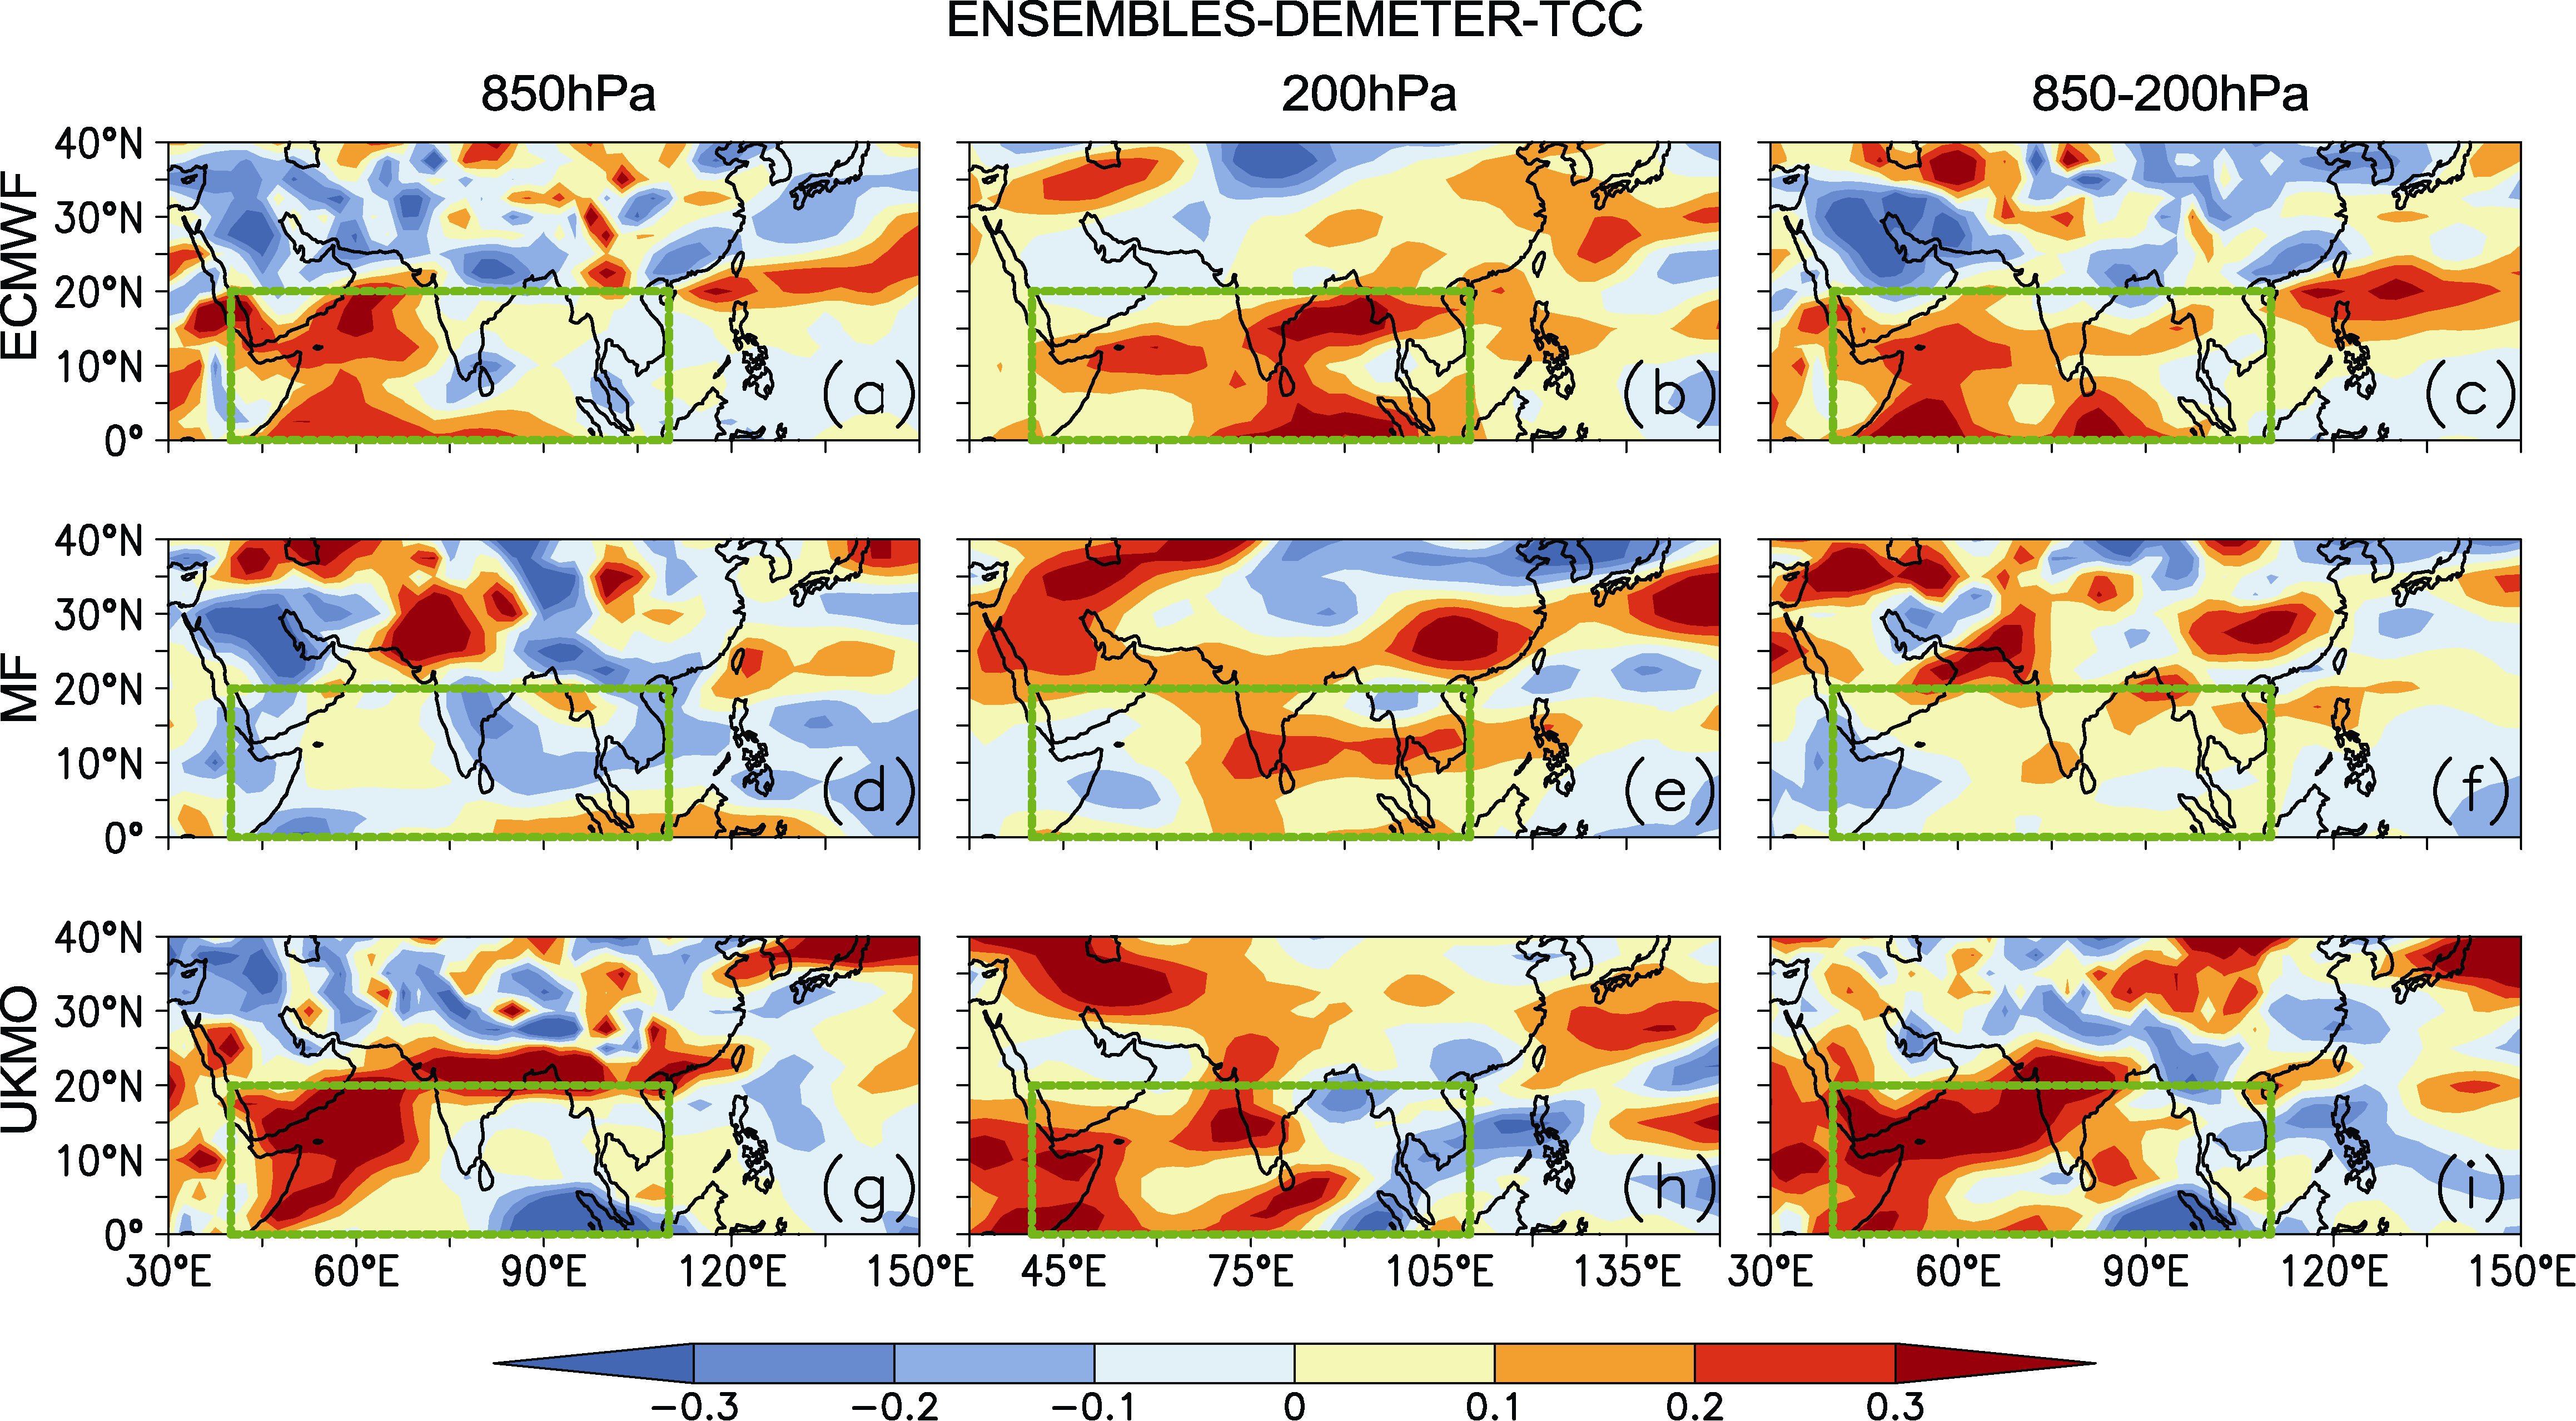
To explore the relationship between the interannual variability of the SASM and the related atmospheric circulation, we performed a composite analysis for horizontal winds at 200 hPa for the period 1960-2001. The years in which the observed WYI were above positive one standard deviation were defined as high WYI years (1961, 1970, 1984, 1985, 1990, 1994, 1999, and 2001), and the years in which the WYI were below minus one standard deviation were defined as low WYI years (1966, 1972, 1979, 1983, 1987, 1992, 1996, and 1997). Figure 4 shows the differences in the composite winds at 200 hPa for high and low years from the observation, ENSEMBLES, and DEMETER. We can see that, according to observations (Fig. 4a), a strong SASM is accompanied by a strengthened SAH and easterly flow over the upper levels of South Asia. The three ENSEMBLES models were able to reproduce the strengthened SAH and easterly flow in high WYI years (Figs. 4b-d). However, the three DEMETER models were unable to capture the relationship between the SASM and SAH (Figs. 4e-g). In addition, we also found that the ENSEMBLES models improved the forecast skill in terms of the relationship between the SASM and precipitation over northern India (Fig. 5) Compared to DEMETER, the three models in ENSEMBLES showed higher skill in forecasting the SSTAs over the Niñ o-3 and North Indian Ocean regions, and more accurately reproduced the large-scale atmospheric circulation and precipitation over northern India, which are related to the SASM. These results represent the probable cause for the improvement in the prediction of the SASM by ENSEMBLES. For the seasonal forecast skill of the SASM, the UKMO in ENSEMBLES was improved the most substantially among three models, as compared to UKMO in DEMETER, TCC of NINO, and WYI in UKMO in DEMETER of -0.22 increased to -0.66 in ENSEMBLES.
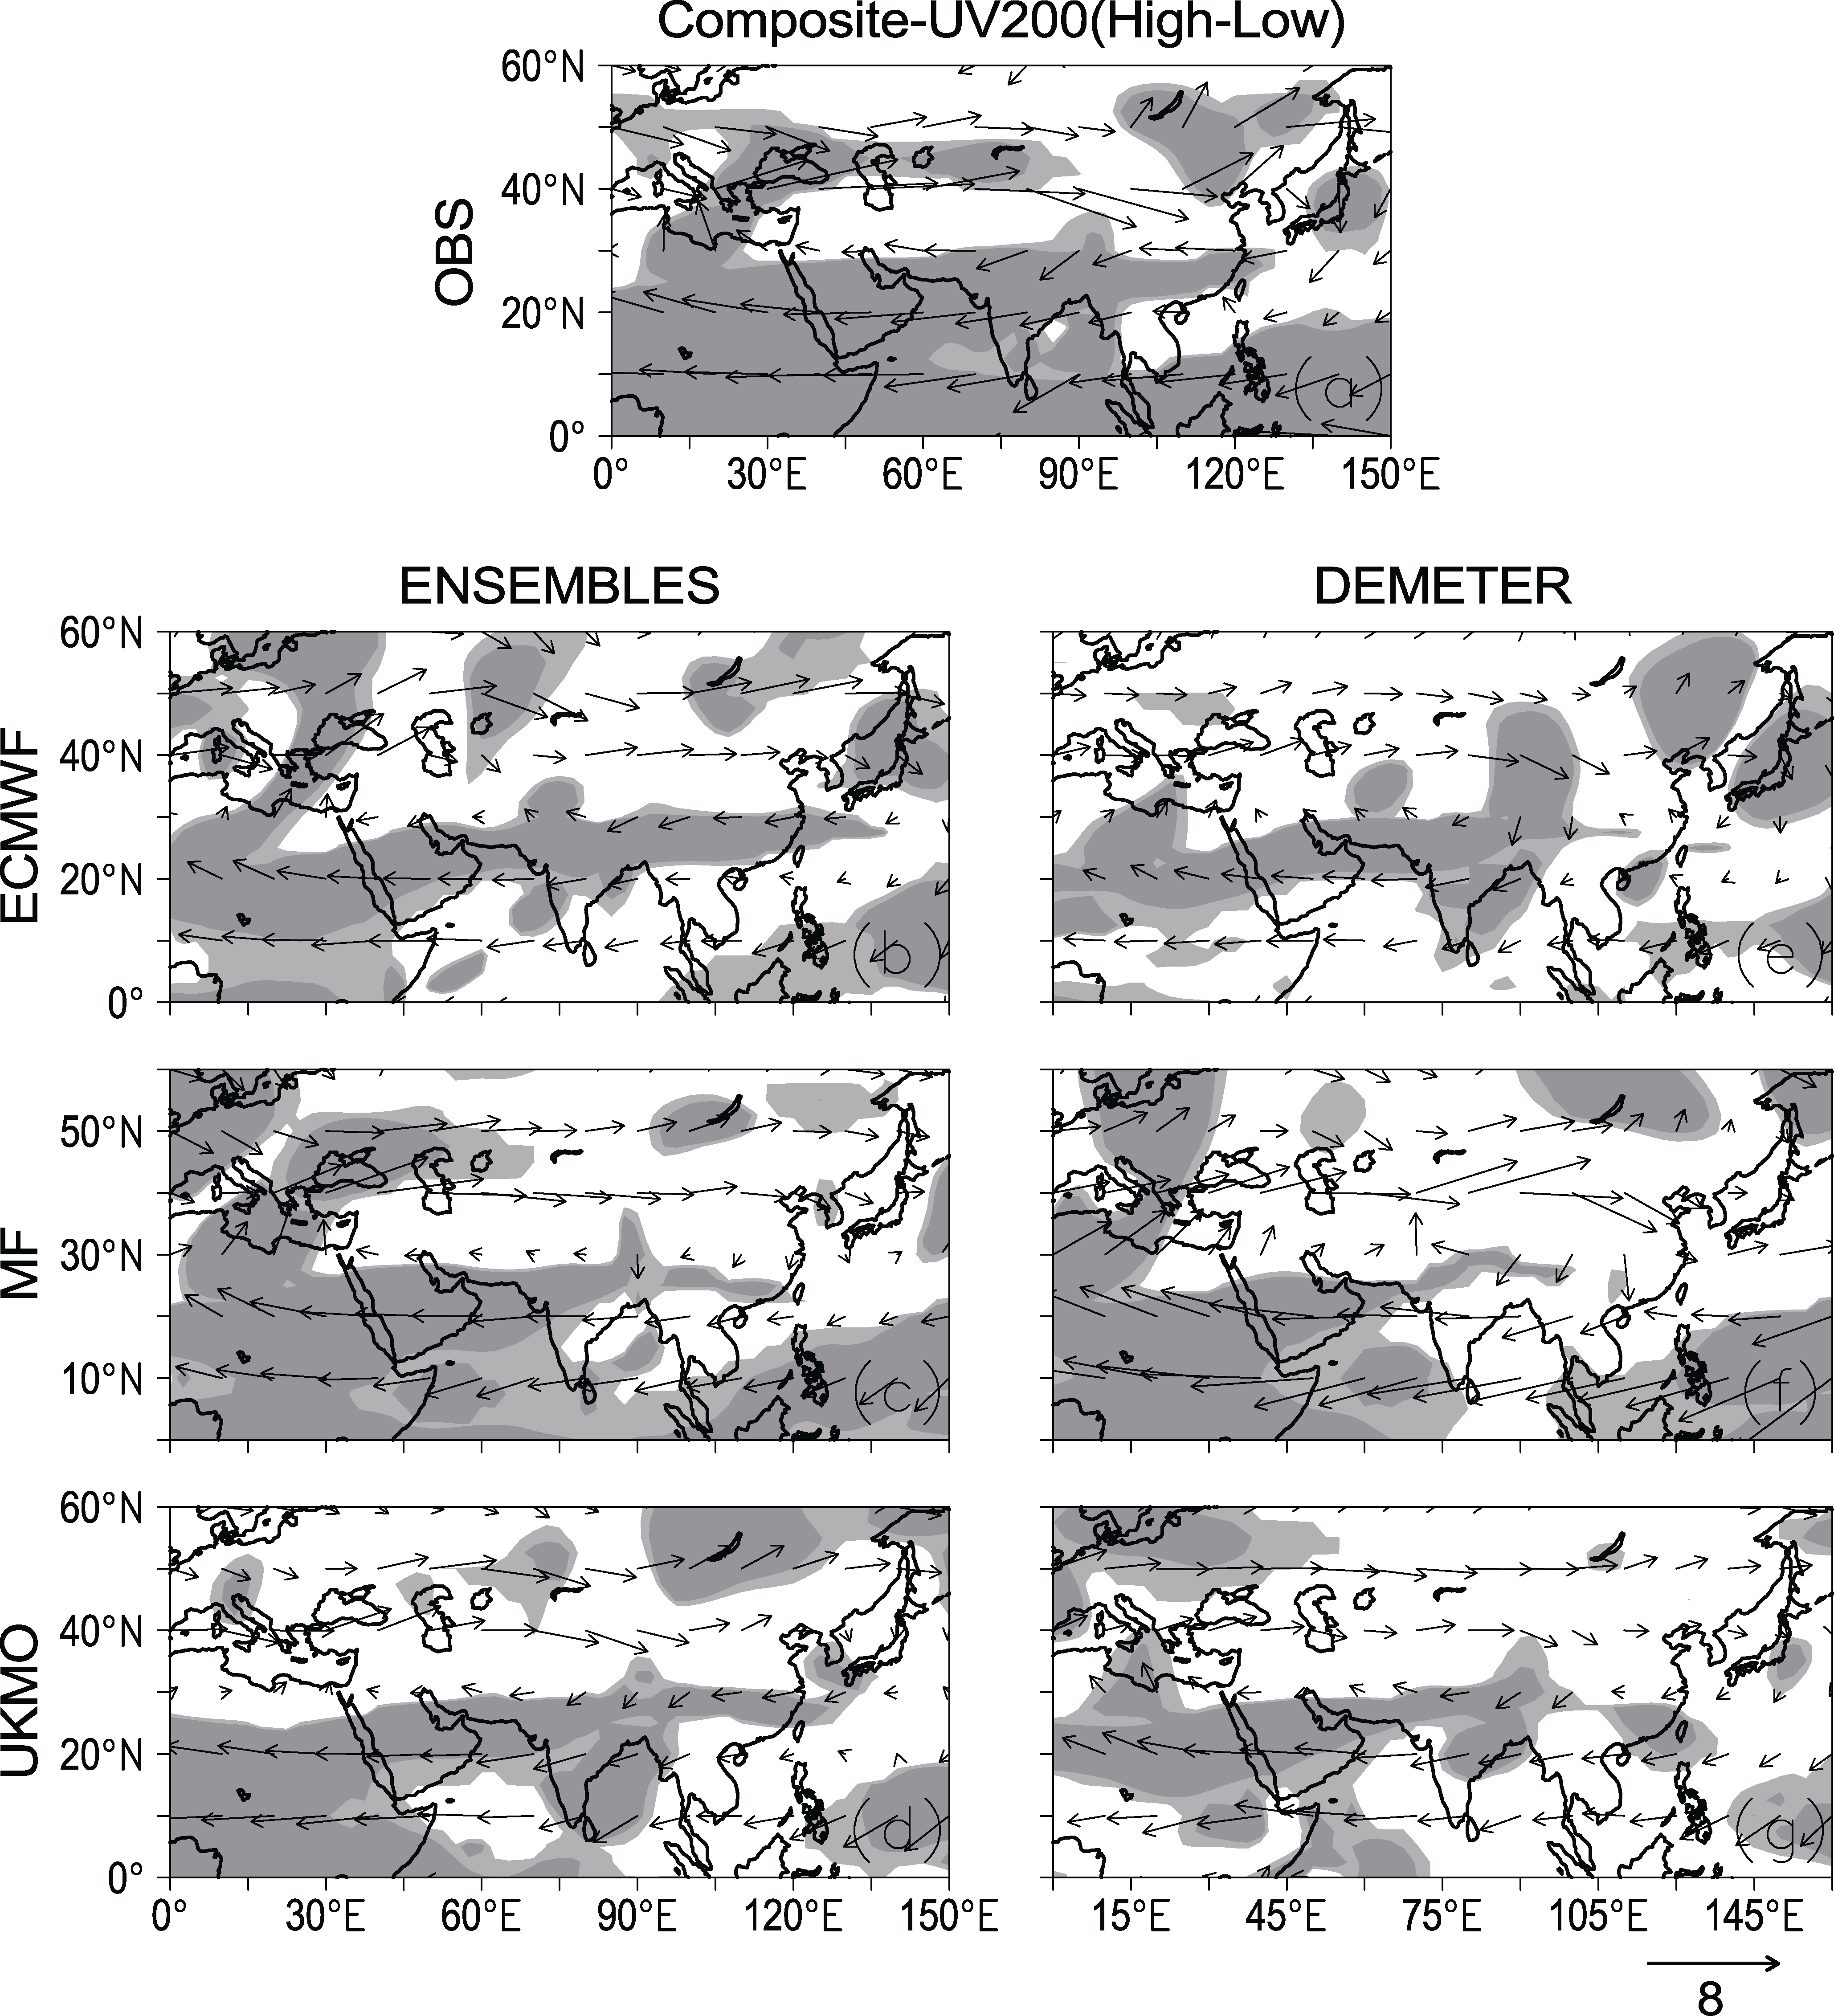 | Figure 4 Differences in composite horizontal winds at 200 hPa for high and low years from (a) observation, (b-d) ENSEMBLES, and (e-g) DEMETER. Light and dark shading indicates statistical significance at the 90% and 95% confidence level, respectively. |
 | Figure 5 Differences in composite the JJA precipitation (units: mm d-1) for high and low years from (a) observation, (b-d) ENSEMBLES, and (e-g) DEMETER. Light and dark shading indicates statistical significance at the 90% and 95% confidence level, respectively. |
In this study, we compared the seasonal forecasting skill with respect to the interannual variability of the SASM between ENSEMBLES and DEMETER models. The WYI, which reflects the variability of the large-scale atmospheric circulation over South Asian monsoon, was chosen to represent the intensity of the SASM. By contrasting the predictive ability in terms of U850 and U200 between the ENSEMBLES and DEMETER models, we found that the ECMWF and UKMO models in ENSEMBLES possess greater seasonal forecasting skill for JJA U850, U200, and U850 minus U200 than in DEMETER. Compared to DEMETER, the MF model in ENSEMBLES showed lower prediction ability for JJA U850 over India and the Indochina Peninsula. However, the JJA U200 and U850 minus U200 forecast skill of the MF model in ENSEMBLES was greater over most of the SASM region. The three coupled models, especially the UKMO in ENSEMBLES, all provide improved seasonal forecasting skill compared to DEMETER in terms of the interannual variability of the SASM. Also, the MF and UKMO models in ENSEMBLES models initiated in February also showed good predictive ability in terms of the interannual variability of the WYI.
Compared with DEMETER, the ENSEMBLES models, especially the UKMO model, showed better prediction ability in forecasting the SSTAs over the Niñ o-3 and North Indian Ocean regions, and more accurately reproduced the large-scale high-level circulation and precipitation over northern India, which are associated with the SASM. It seems that the couple between the atmospheric system and external forcing of ENSMBLES over Indian Ocean and Pacific is better than that of DEMETER.
| [1] |
|
| [2] |
|
| [3] |
|
| [4] |
|
| [5] |
|
| [6] |
|
| [7] |
|
| [8] |
|
| [9] |
|
| [10] |
|
| [11] |
|
| [12] |
|
| [13] |
|
| [14] |
|
| [15] |
|
| [16] |
|
| [17] |
|
| [18] |
|
| [19] |
|
| [20] |
|
| [21] |
|
| [22] |
|
| [23] |
|
| [24] |
|
| [25] |
|
| [26] |
|