Trends of Temperature Extremes in Summer and Winter during 1971-2013 in China
[HUANG Ling1 , CHEN Ai-Fang1 , ZHU Yun-Hua2 , WANG Hong-Lin1 , HE Bin1, *  ]
]
]
|
|


The diurnal temperature range (DTR) has decreased dramatically in recent decades, but it is not yet obvious whether the extreme values of DTR have also reduced. Based on the daily maximum and minimum temperature data of 653 stations in China, a set of monthly indices of warm extremes, cold extremes, and DTR extremes in summer (June, July, August) and winter (December, January, February) were studied for spatial and temporal features during the period 1971-2013. Results show that the incidence of warm extremes has been increasing in most parts of China, while the opposite trend was found in the cold extremes for summer and winter months. Both increasing and decreasing trends of monthly DTR extremes were identified in China for both seasons. For high DTR extremes, decreasing trends were identified in northern China for both seasons, but increasing trends were found only in southern China in summer, while in winter, they were found in central China. Monthly low DTR extreme indices demonstrated consistent positive trends in summer and winter, while significant increases ( P < 0.05) were identified for only a few stations.
As mentioned in Fifth Assessment Report of Intergovernmental Panel on Climate Change (IPCC, 2013), global annual mean surface temperatures increased by 0.85° C between 1880 and 2012. Global warming is expected to affect not only the mean values of climatic variables, but also extreme values (Mearns et al., 1984; Katz and Brown, 1992). Because a warmer atmosphere has the potential to trigger weather systems of greater intensity than those in the historical record, the frequency and/or intensity of extreme weather events is expected to increase (Zhang et al., 2008). Extreme weather and climatic events have substantial economic and environmental impacts. Understanding the variation characteristics of temperature extremes will have great importance for improving the public’ s ability to cope with these extreme events.
Previous studies have reported that the increases in daily minimum temperatures during recent decades were larger than the increases in daily maximum temperatures (Karl et al., 1991). The faster warming of minimum temperature has caused decreases in days with temperatures below freezing, and intra-annual extreme temperature ranges (Frich et al., 2002). According to the study of Alexander et al. (2006), more than 70% of the global land area has experienced a decrease in the annual number of cold nights and an increase in the annual number of warm nights. In Central America and northern South America, the occurrence of extreme warm temperatures has increased, while the occurrence of extreme cold temperature events has decreased (Aguilar et al., 2005).
China has experienced significant temperature changes in recent decades (Gong and Han, 2004; Wang et al., 2012; Chen et al., 2013). Minimum temperatures increased at a greater rate than maximum temperatures from 1955 to 2011 (Liu et al., 2004). Asymmetric warming during the day and night has decreased the diurnal temperature range and triggered greater uncertainties in temperature extremes (Qian and Lin, 2004; You et al., 2011). Zhai and Pan (2003) found that, from 1951 to 1999, the number of hot days (maximum temperature over 35° C) decreased slightly, while the number of days with temperatures below freezing significantly decreased. Different regions have displayed different trends in temperature extremes. Across China’ s north-south axis, the days of maximum temperatures higher than 35° C in summer display a sandwich spatial structure, with significant negative trends in central China and positive trends in northern and southern China (Wei and Chen, 2009). Hua et al. (2006) found that the annual extreme high diurnal temperature range (DTR) has exhibited an decreasing trend both in large cities and small towns. More recently, Huang et al. (2010) suggested that both increasing and decreasing trends of annual extreme high DTR exist over China, and that its trends present an opposite spatial distribution to those of annual extreme low DTR.
Analysis of the studies cited above indicates that the majority investigated temperature extremes on the seasonal or annual scale, which ignores some important information that can be reflected by monthly scales. Meanwhile, many studies (e.g., Lobell, 2007; Peng et al., 2013; Cheng et al., 2014) have confirmed that DTR extremes have large influences on human health, agricultural production, and vegetation growth, while the spatial and temporal characteristics of DTR extremes over the past several decades in China are still poorly understood.
To address the above problem, the goal in the present study was to explore, using the linear regression method, the spatial and temporal changes of warm extremes, cold extremes, and DTR extremes in the summer and winter months during 1971-2013 in China.
Daily maximum and minimum air temperature data for 824 stations in China from 1971 to 2013 were collected by the National Meteorological Center of the China Meteorological Administration. Data quality control and homogeneity were assessed by inspecting the quality control code provided with the dataset. Because of frequent data gaps in earlier years caused by instrument malfunctions, we excluded the data prior to 1971. In addition, stations with missing data were excluded from the analysis. Ultimately, 653 stations were included in the analysis.
Summer and winter have a high incidence rate of temperature extremes, so the focus of this study was on extreme temperatures in summer (June, July, August (JJA)) and winter (December, January, February (DJF)).
In this study, temperature extremes are described as warm extremes, cold extremes, high DTR extremes, and low DTR extremes. The warm extremes and cold extremes indices employed were recommended by Project Central and Eastern Europe Climate Change Impact and Vulnerability Assessment (CECILIA; see http://www. cecilia-eu.org/), and similarly we defined DTR extremes indices. All the indices are based on percentile temperature thresholds, defined as events in the 90th or 10th percentiles of the corresponding variables on the daily scale. In contrast to absolute extreme indices, percentile threshold indices are relatively more comparable across different climatic regions (Zhai and Pan, 2003). These indices have been commonly used in previous studies (e.g., Hirschi et al., 2010; Mueller and Seneviratne, 2012). A set of four indices were selected for the analysis; their descriptions are given in Table 1.
Linear regression using a least squares regression was used to illustrate the long-term change in direction and magnitude of each variable in this study. Moreover, the Student’ s t-test was applied to examine the significance of the trend (O'Mahony, 1986). The significance of the trend was assessed at the > 95% confidence level.
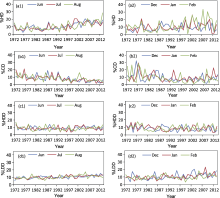
Figure 1 displays the time series of the country-averaged selected extreme indices. Trend coefficients of extreme indices can be seen in Table 2. For China as a whole, the warm extremes (%HD) presented obvious increasing trends in summer months, but little change in winter months (Table 2). The increasing trends of %HD in summer were especially evident after 1992 (Fig. 1a1). Interannual variability of %HD had apparently been fluctuating in the winter months since the 1992 (Fig. 1a2). This phenomenon is consistent with previous studies using annual warm extreme indices during 1956-2010 for China (Wang et al., 2012). Wei and Chen (2009) also identified a jump-like acceleration of high temperature days in summer since the mid 1990s.
| Table 1 Definitions of extreme temperature indices used in this study. |
 | Figure 1 Time series of the country-averaged %HD in (a1) June, July, August (JJA) and (a2) December, January, February (DJF), %CD in (b1) JJA and (b2) DJF, %HDD in (c1) JJA and (c2) DJF, and %LDD in (d1) JJA and (d2) DJF, in China from 1971 to 2013. Units:%. |
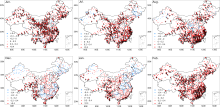
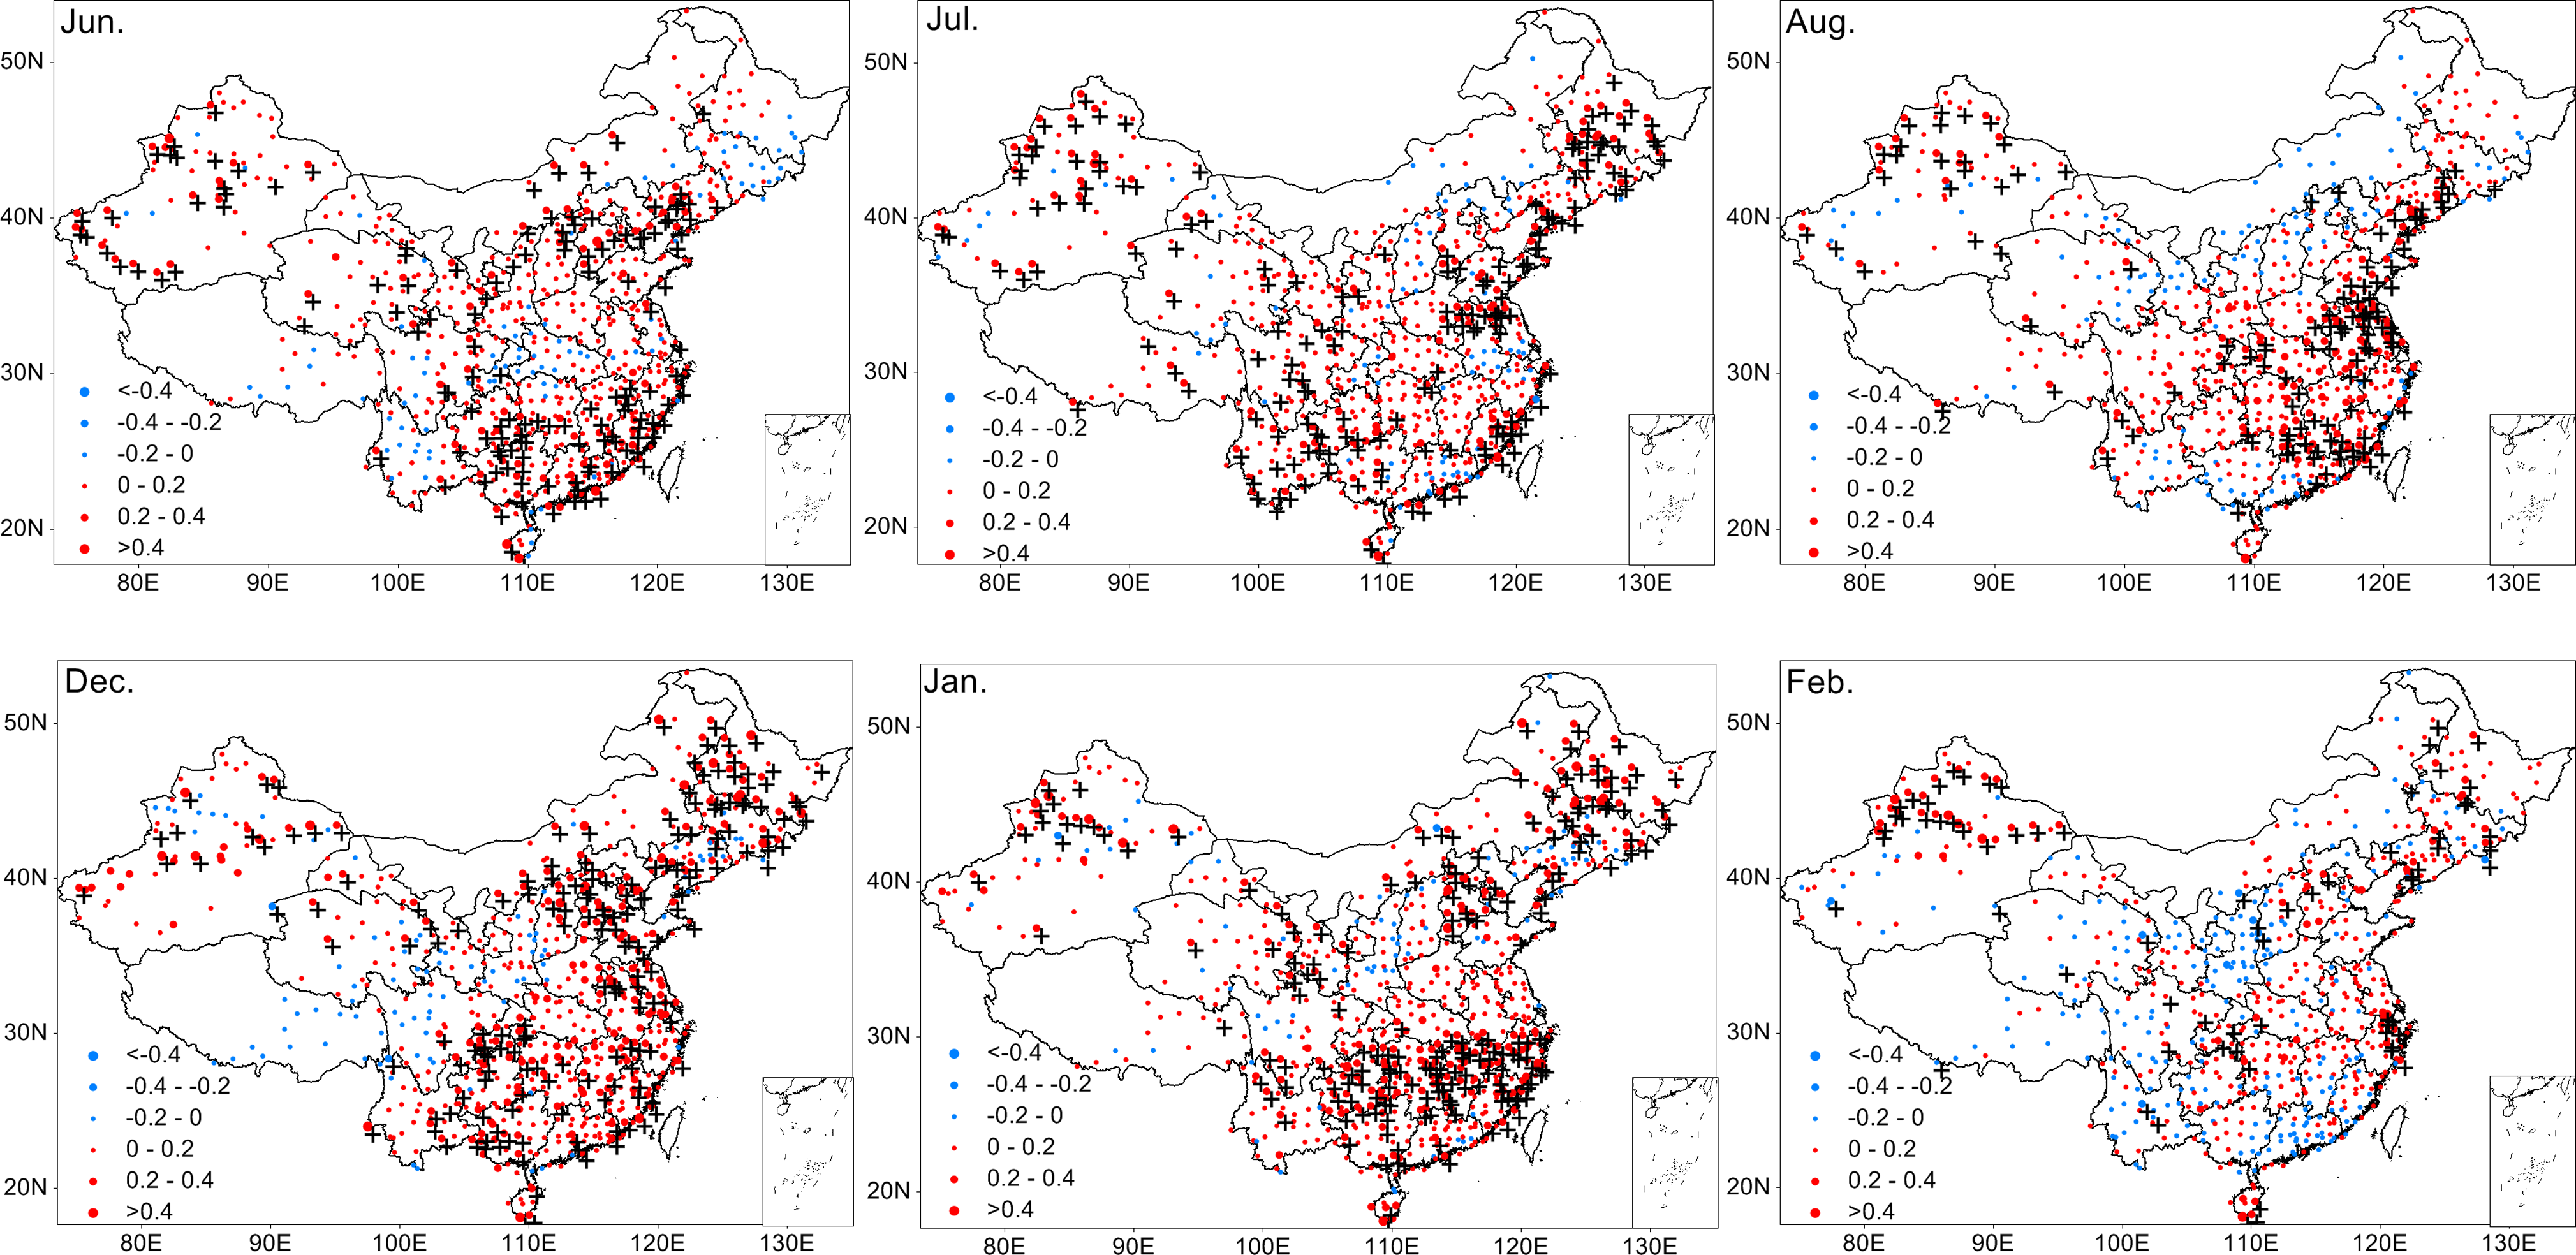
Figure 2 shows the spatial distributions of %HD trends in China for JJA and DJF from 1971 to 2013. The tendency toward more warm extremes was dominant for both seasons. In June and July, the significant positive trends appeared in northwestern China. In August, significant positive trends tended to appear in the south of China. Meanwhile, reductions of %HD were only observed in several stations scattered across central China in JJA. From December to February, regions with significantly increasing %HD trends gradually extended from the Tibetan Plateau and Yunnan Province to the entire country. In addition, more than 30% of stations showed a slight decreasing trend in December and January, mainly in the east and north. The major features of warm extremes discussed in the study are, to a certain degree, similar to those of previous studies (Gong and Han, 2004; Wang and Yang, 2007; Wang et al., 2012).
 | Figure 2 Trend distributions of %HD in JJA and DJF from 1971 to 2013 (units: % yr-1; crosses indicate stations with trends significant at the 95% confidence level). |
Changes of monthly cold extreme indices during 1971-2013 in summer and winter are shown in Fig.1b1 and 1b2. The series in summer showed clear decreasing trends, and an accelerated decrease after 1990. %CD in winter months showed weak decreasing trends before the 1990s and turned to an increasing trend after 2000. This feature has also been reported by Zhou and Ren (2012). Moreover, the linear trends in %HD were stronger than those of %CD in summer (Table 2); a similar phenomenon has also been found in eastern China for the period 1955 to 2000 (Gong et al., 2004).
| Table 2 Trend coefficients of country-averaged temperature extreme indices during 1971-2013. Units: % yr-1. |
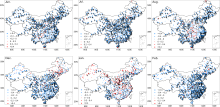
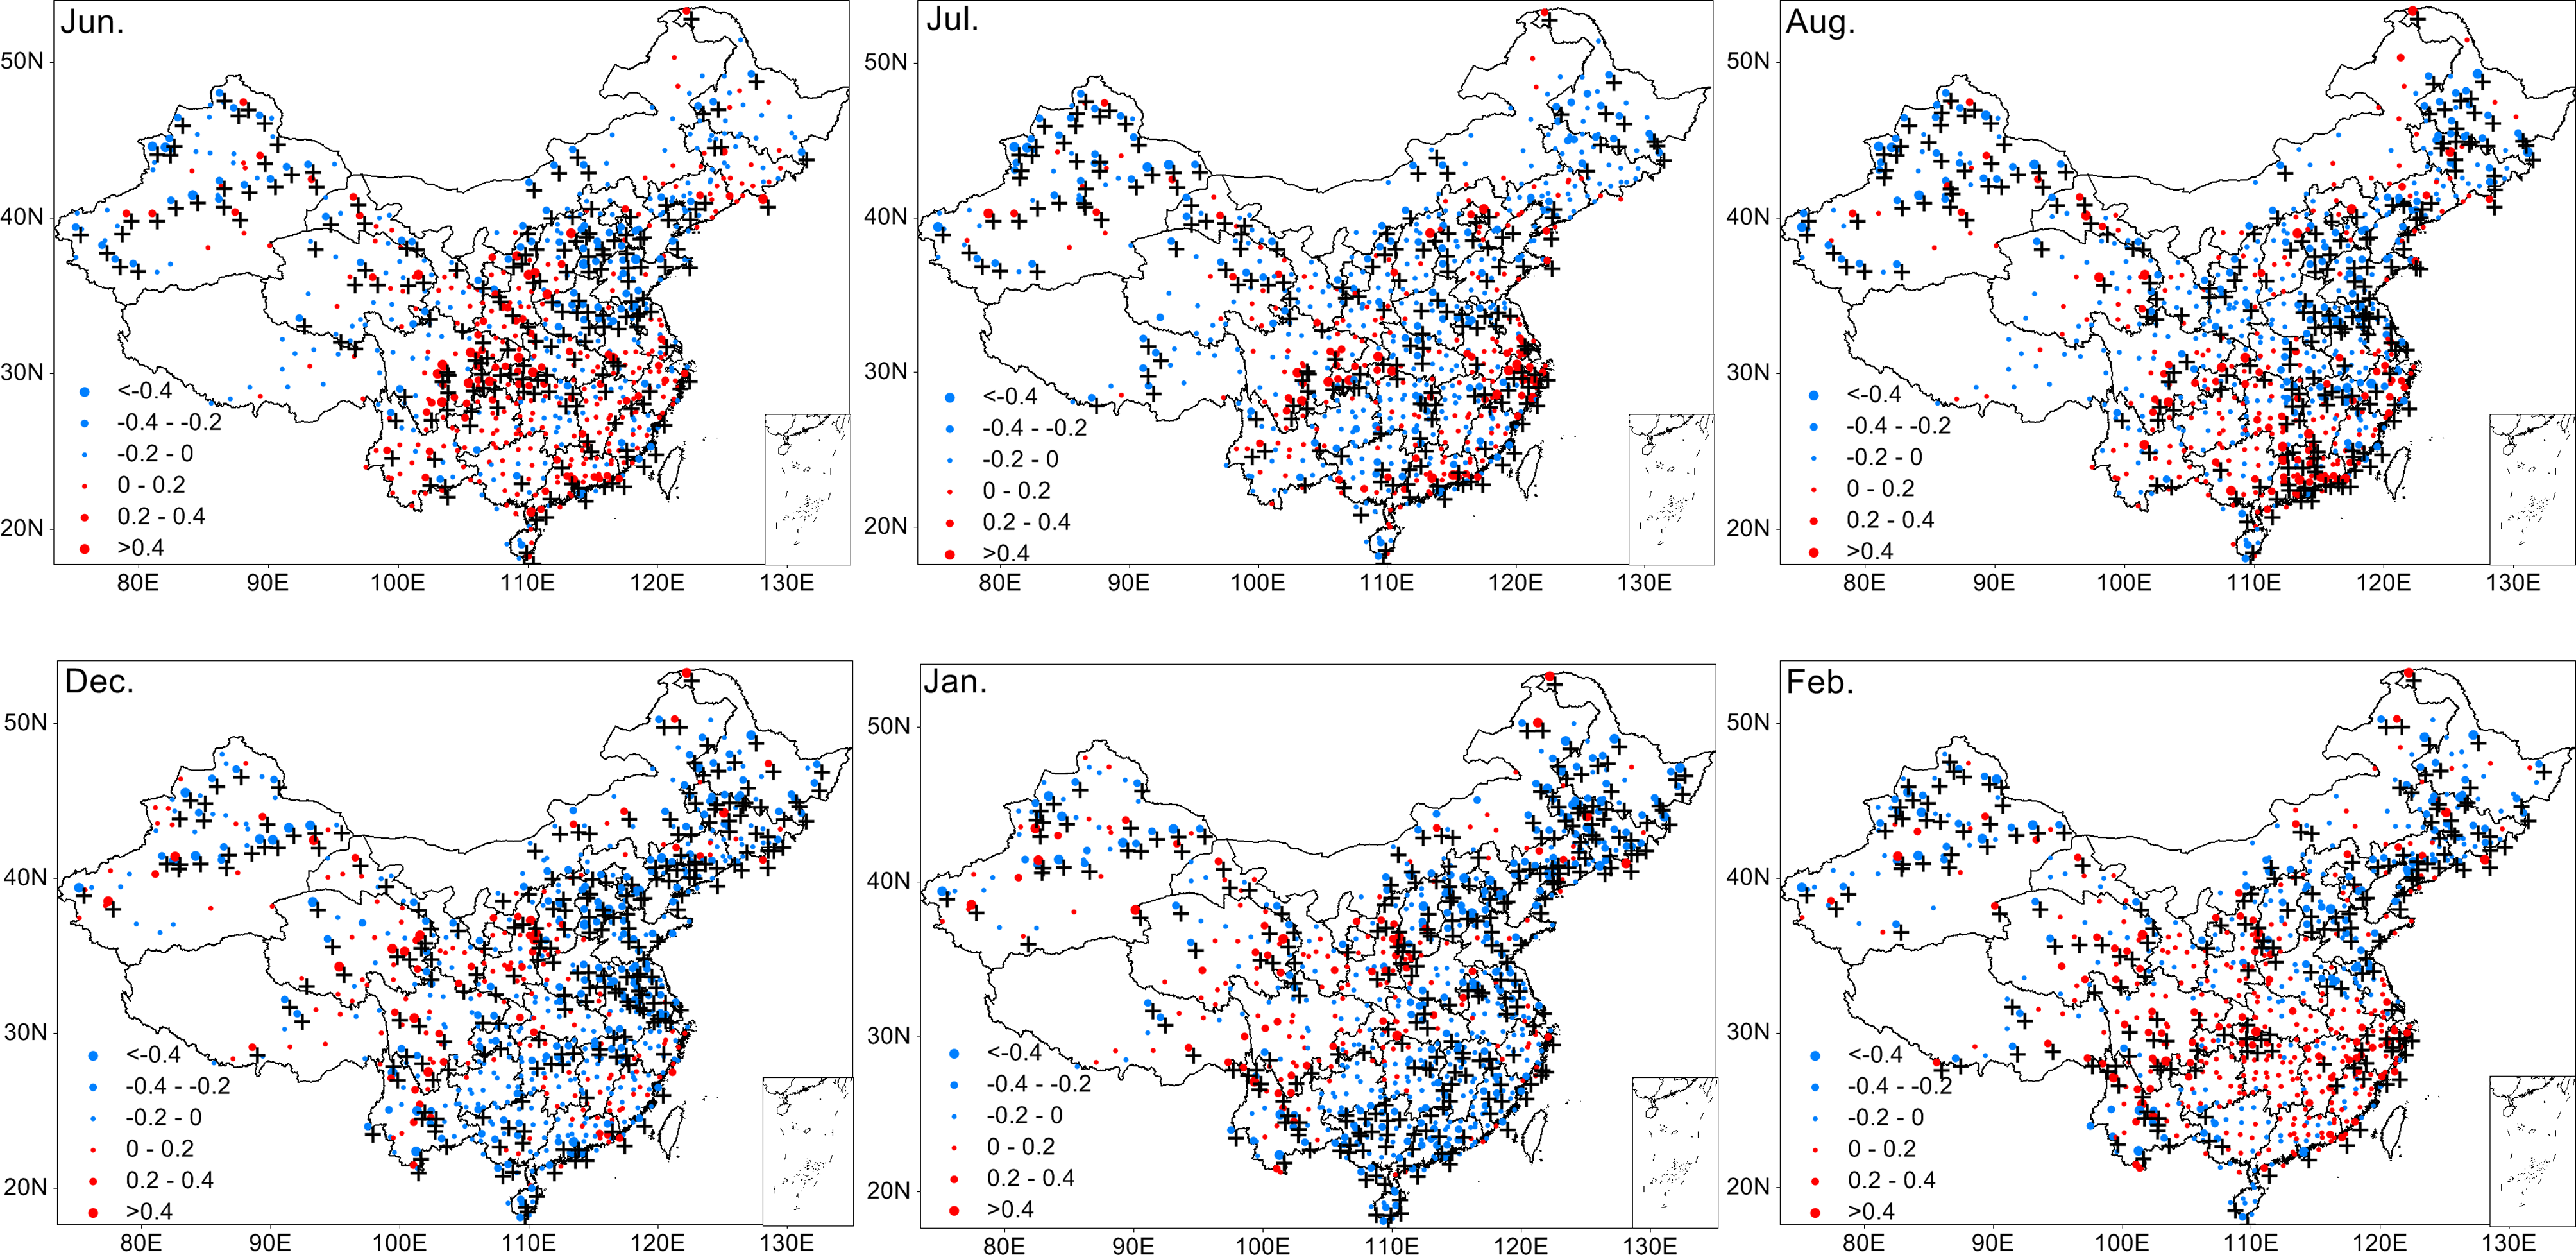
Figure 3 shows the spatial distribution of monthly %CD trends over China from 1971 to 2013. For the majority of stations, %CD displayed a declining trend in both seasons. The %CD decreased significantly in the north of China in June. In July, significant declining trends were found in most parts of China except for Hunan Province. In August, the number of stations with significant trends seemed to be reduced compared to that of July, and the reduced stations mainly concentrated in North China and the coast of China. For winter months, it is interesting to find that the decreasing trends of %CD were not apparent in January; instead, some stations with significant increasing trends were found in North China. For December and February, similar to the %CD trend distributions in summer months, significant decreasing trends still dominated over China.
 | Figure 3 Trend distributions of %CD in JJA and DJF from 1971 to 2013 (units: % yr-1; crosses indicate stations with trends significant at the 95% confidence level). |
Compared with the warm and cold extreme indices, the magnitudes of trends in the high DTR extreme indices were much smaller (Table 2).
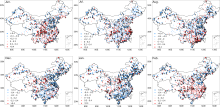
Figure 4 shows that the trends of %HDD in JJA and DJF exhibited remarkable regional differences. Compared with the trends of warm and cold extremes, the significant regions were narrowed. For summer, the spatial pattern of %HDD trends in June were similar to that in July and August. Significant decreasing trends were found in North China, while significant increasing trends mainly concentrated in southern China. In December and January, many stations located in Northeast and North China presented significant decreasing %HDD trends, while a few of stations in Shanxi and Qinghai provinces displayed obviously increasing trends. In February, clear north-south differences could be identified for the distribution of the %HDD trend, with decreases in the north and increases in the south.
 | Figure 4 Trend distributions of %HDD in JJA and DJF from 1971 to 2013 (units: % yr-1; crosses indicate stations with trends significant at the 95% confidence level). |
Figures 1d1 and 1d2 show the variations of monthly low DTR extreme indices in summer and winter. During 1971 to 2013, apparent positive trends for the monthly low DTR extreme indices for JJA and DJF could be identified (Table 2).
As Fig. 5 shows, most of China displayed a positive tendency in low DTR extremes, although only a small portion of stations displayed particularly significant trends. The %LDD showed significant increasing trends over southern China in June, northern China and Yunnan Province in July, and southeastern China in August. For winter months, there was a significant increasing trend of the %LDD indices at most stations in northeastern China, northern northwestern China, and the Yangtze River basin in southern China in December and January. For February, however, the %LDD showed a weakly declining trend over part of China. Furthermore, the trend of %LDD was generally weak, with the exception of some stations in northern China and the province of Xinjiang, where a significant increasing trend of low DTR extremes was observed.
 | Figure 5 Trend distributions of %LDD in JJA and DJF from 1971 to 2013 (units: % yr-1; crosses indicate stations with trends significant at the 95% confidence level). |
Four types of temperature extreme have been investigated in China from 1971 to 2013 in this study. The time period chosen here is somewhat different to previous studies, which usually began from the 1960s. By comparing the results of this study and previous studies, we found that the selected time period does not produce different results, suggesting that our results are not sensitive to the selected time period.
Global warming has triggered great concern about temperature extremes. This paper has presented the statistical features of trends in indices of warm extremes, cold extremes, and DTR extremes in the summer and winter in China from 1971 to 2013. The conclusions can be summarized as follows:
(1) In the summer and winter months, the majority of stations analyzed were dominated by significantly increasing trends of warm extremes. The summer trends have been rising more rapidly than the winter trends. In addition, a wider distribution of increasing warm extremes was found in summer than winter. In contrast, the winter trends of warm extremes have been more variable than the summer warm extremes. The trends over China exhibit marked monthly differences. For example, the area characterized by significantly increasing trends in the examined indices from December to February tended to move from the Tibetan Plateau and Yunnan Province to cover the entire country.
(2) Trends in the examined cold extreme indices displayed widespread and significant declines across China in both seasons, which could be attributed to dramatic increasing minimum temperatures in China (Wang et al., 2003; Sun et al., 2008). From a temporal perspective, the most significant decline occurred in July, with stations mostly located in northern China dominating this significant decrease. The decreasing trends were less pronounced in southern China in June and August. For winter, most of China displayed a significant decrease in the cold extreme indices for December and February, while the decreasing trend was less obvious in January.
(3) The spatial distributions of high DTR extremes were not homogeneous, as the study revealed some regional differences. During the summer, declining trends in the examined indices were observed in northern China, while in southern China obvious increasing trends were seen. During the winter, declining trends were observed in northern China, while in central China increasing trends were evident. For China as a whole, the trend in the total annual number of high DTR extremes was weak and non-significant.
(4) In general, the indices of monthly low DTR extremes showed positive trends in both seasons from 1971 to 2013. Nevertheless, only 20% of the analyzed stations displayed an obvious trend, and these were located in southern China in June, northern China in July, and southeastern China in August. Significant increasing trends for low DTR extremes in December and January were observed in northeastern China, northern China, and the Yangtze River basin. In February, stations in northwestern Xinjiang Province had significant increasing trends.
| [1] |
|
| [2] |
|
| [3] |
|
| [4] |
|
| [5] |
|
| [6] |
|
| [7] |
|
| [8] |
|
| [9] |
|
| [10] |
|
| [11] |
|
| [12] |
|
| [13] |
|
| [14] |
|
| [15] |
|
| [16] |
|
| [17] |
|
| [18] |
|
| [19] |
|
| [20] |
|
| [21] |
|
| [22] |
|
| [23] |
|
| [24] |
|
| [25] |
|
| [26] |
|
| [27] |
|
| [28] |
|
| [29] |
|
| [30] |
|